Note
Access to this page requires authorization. You can try signing in or changing directories.
Access to this page requires authorization. You can try changing directories.
Applies to: ![]() Microsoft Report Builder (SSRS)
Microsoft Report Builder (SSRS) ![]() Power BI Report Builder
Power BI Report Builder ![]() Report Designer in SQL Server Data Tools
Report Designer in SQL Server Data Tools
In pie charts in paginated reports, by default the first value in the dataset starts at 90 degrees from the top of the pie.
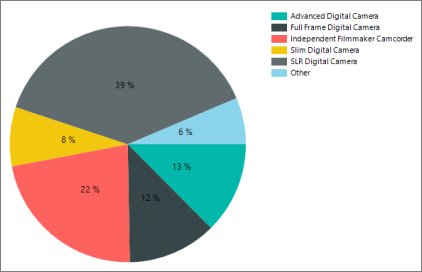
Chart values start at 90 degrees.
You might want the first value to start at the top instead.
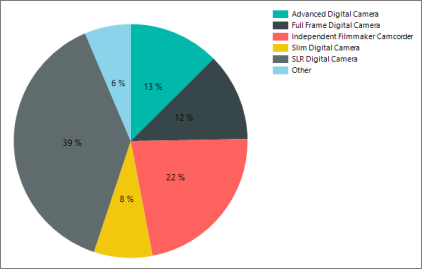
Chart values start at the top of the chart.
To Start the Pie Chart at the Top of the Pie
Click the pie itself.
If the Properties pane is not open, on the View tab, click Properties.
In the Properties pane, under Custom Attributes, change PieStartAngle from 0 to 270.
Click Run to preview your report.
The first value now starts at the top of the pie chart.