Note
Access to this page requires authorization. You can try signing in or changing directories.
Access to this page requires authorization. You can try changing directories.
In this tutorial, you practice formatting text in various ways in a Reporting Services paginated report. You can experiment with different formats.
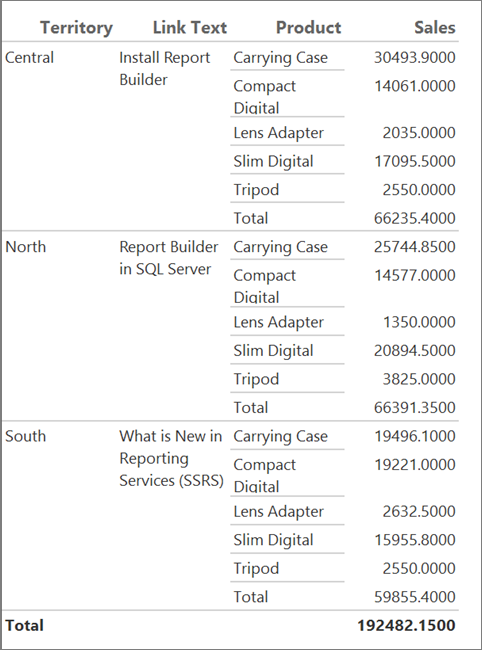
After you set up the blank report with the data source and dataset, you can pick the formats you want to explore. The following illustration shows a report similar to the one you create in this tutorial.
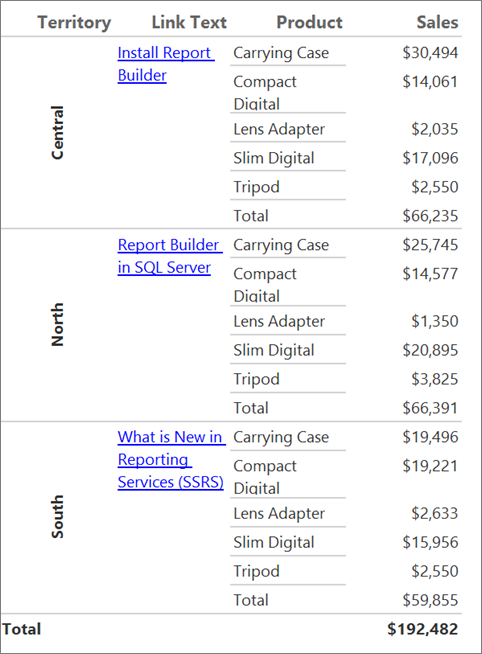
In one step, you make a mistake on purpose so you can see why it's a mistake. Then you correct the mistake to achieve the desired effect.
Estimated time to complete this tutorial: 20 minutes.
Requirements
For information about requirements, see Prerequisites for tutorials (Report Builder).
Create a blank report with a data source and dataset
Create a blank report
Start Report Builder either from your computer, the Reporting Services web portal, or SharePoint integrated mode.
The New Report or Dataset dialog box opens.
If you don't see the New Report or Dataset dialog box, on the File menu > New.
In the left pane of the Getting Started dialog box, verify that New Report is selected.
In the right pane, select Blank Report.
Create a data source
In the Report Data pane, select New > Data Source.
If you don't see the Report Data pane on the View tab, check Report Data.
In the Name box, enter: TextDataSource
Select Use a connection embedded in my report.
Verify that the connection type is Microsoft SQL Server, and then in the Connection string box enter:
Data Source = <servername>Note
The expression
<servername>, for example Report001, specifies a computer on which an instance of the SQL Server Database Engine is installed. This tutorial does not need specific data; it just needs a connection to a SQL Server database. If you already have a data source connection listed under Data Source Connections, you can select it and go to the next procedure, "To create a dataset." For more information, see Alternative ways to get a data connection (Report Builder).Select OK.
Create a dataset
In the Report Data pane, select New > Dataset.
Verify that the data source is TextDataSource.
In the Name box, enter: TextDataset.
Verify that the Text query type is selected, and then choose Query Designer.
Select Edit as Text.
Paste the following query into the query pane:
Note
In this tutorial, the query already contains the data values, so that it does not need an external data source. This makes the query quite long. In a business environment, a query would not contain the data. This is for learning purposes only.
SELECT CAST('2015-01-05' AS date) as SalesDate, 'Lauren Johnson' as FullName,'Central' as Territory, 'Accessories' as Subcategory,'Carrying Case' as Product, CAST(16996.60 AS money) AS Sales, 68 as Quantity, 'Install Report Builder' as LinkText, 'https://go.microsoft.com/fwlink/?LinkId=154882' AS URL
UNION SELECT CAST('2015-01-05' AS date) as SalesDate, 'Warren Pal' as FullName,'North' as Territory, 'Accessories' as Subcategory, 'Carrying Case' as Product, CAST(13747.25 AS money) AS Sales, 55 as Quantity, 'Report Builder in SQL Server' as Link, 'https://go.microsoft.com/fwlink/?LinkId=160556' AS URL
UNION SELECT CAST('2015-01-05' AS date) as SalesDate, 'Fernando Ross' as FullName,'South' as Territory, 'Accessories' as Subcategory,'Carrying Case' as Product, CAST(9248.15 AS money) As Sales, 37 as Quantity, 'What is New in Reporting Services (SSRS)' as Link, 'https://go.microsoft.com/fwlink/?LinkId=165064' AS URL
UNION SELECT CAST('2015-01-05' AS date) as SalesDate, 'Lauren Johnson' as FullName,'Central' as Territory, 'Accessories' as Subcategory,'Tripod' as Product, CAST(1350.00 AS money) AS Sales, 18 as Quantity, 'Install Report Builder' as LinkText, 'https://go.microsoft.com/fwlink/?LinkId=154882' AS URL
UNION SELECT CAST('2015-01-05' AS date) as SalesDate, 'Warren Pal' as FullName,'North' as Territory, 'Accessories' as Subcategory,'Tripod' as Product, CAST(1800.00 AS money) AS Sales, 24 as Quantity, 'Report Builder in SQL Server' as Link, 'https://go.microsoft.com/fwlink/?LinkId=160556' AS URL
UNION SELECT CAST('2015-01-05' AS date) as SalesDate, 'Fernando Ross' as FullName,'South' as Territory, 'Accessories' as Subcategory,'Tripod' as Product, CAST(1125.00 AS money) AS Sales, 15 as Quantity, 'What is New in Reporting Services (SSRS)' as Link, 'https://go.microsoft.com/fwlink/?LinkId=165064' AS URL
UNION SELECT CAST('2015-01-05' AS date) as SalesDate, 'Lauren Johnson' as FullName,'Central' as Territory, 'Accessories' as Subcategory,'Lens Adapter' as Product, CAST(1147.50 AS money) AS Sales, 17 as Quantity, 'Install Report Builder' as LinkText, 'https://go.microsoft.com/fwlink/?LinkId=154882' AS URL
UNION SELECT CAST('2015-01-05' AS date) as SalesDate, 'Warren Pal' as FullName,'North' as Territory, 'Accessories' as Subcategory,  'Lens Adapter' as Product, CAST(742.50 AS money) AS Sales, 11 as Quantity, 'Report Builder in SQL Server' as Link, 'https://go.microsoft.com/fwlink/?LinkId=160556' AS URL
UNION SELECT CAST('2015-01-05' AS date) as SalesDate, 'Fernando Ross' as FullName,'South' as Territory, 'Accessories' as Subcategory,'Lens Adapter' as Product, CAST(1417.50 AS money) AS Sales, 21 as Quantity, 'What is New in Reporting Services (SSRS)' as Link, 'https://go.microsoft.com/fwlink/?LinkId=165064' AS URL
UNION SELECT CAST('2015-01-06' AS date) as SalesDate, 'Lauren Johnson' as FullName,'Central' as Territory, 'Accessories' as Subcategory, 'Carrying Case' as Product, CAST(13497.30 AS money) AS Sales, 54 as Quantity, 'Install Report Builder' as LinkText, 'https://go.microsoft.com/fwlink/?LinkId=154882' AS URL
UNION SELECT CAST('2015-01-06' AS date) as SalesDate, 'Warren Pal' as FullName,'North' as Territory, 'Accessories' as Subcategory, 'Carrying Case' as Product, CAST(11997.60 AS money) AS Sales, 48 as Quantity, 'Report Builder in SQL Server' as Link, 'https://go.microsoft.com/fwlink/?LinkId=160556' AS URL
UNION SELECT CAST('2015-01-06' AS date) as SalesDate, 'Fernando Ross' as FullName,'South' as Territory, 'Accessories' as Subcategory, 'Carrying Case' as Product, CAST(10247.95 AS money) As Sales, 41 as Quantity, 'What is New in Reporting Services (SSRS)' as Link, 'https://go.microsoft.com/fwlink/?LinkId=165064' AS URL
UNION SELECT CAST('2015-01-06' AS date) as SalesDate, 'Lauren Johnson' as FullName,'Central' as Territory, 'Accessories' as Subcategory, 'Tripod' as Product, CAST(1200.00 AS money) AS Sales, 16 as Quantity, 'Install Report Builder' as LinkText, 'https://go.microsoft.com/fwlink/?LinkId=154882' AS URL
UNION SELECT CAST('2015-01-06' AS date) as SalesDate, 'Warren Pal' as FullName,'North' as Territory, 'Accessories' as Subcategory,'Tripod' as Product, CAST(2025.00 AS money) AS Sales, 27 as Quantity, 'Report Builder in SQL Server' as Link, 'https://go.microsoft.com/fwlink/?LinkId=160556' AS URL
UNION SELECT CAST('2015-01-06' AS date) as SalesDate, 'Fernando Ross' as FullName,'South' as Territory, 'Accessories' as Subcategory,'Tripod' as Product, CAST(1425.00 AS money) AS Sales, 19 as Quantity, 'What is New in Reporting Services (SSRS)' as Link, 'https://go.microsoft.com/fwlink/?LinkId=165064' AS URL
UNION SELECT CAST('2015-01-06' AS date) as SalesDate, 'Lauren Johnson' as FullName,'Central' as Territory, 'Accessories' as Subcategory,'Lens Adapter' as Product, CAST(887.50 AS money) AS Sales, 13 as Quantity, 'Install Report Builder' as LinkText, 'https://go.microsoft.com/fwlink/?LinkId=154882' AS URL
UNION SELECT CAST('2015-01-06' AS date) as SalesDate, 'Warren Pal' as FullName,'North' as Territory, 'Accessories' as Subcategory, 'Lens Adapter' as Product, CAST(607.50 AS money) AS Sales, 9 as Quantity, 'Report Builder in SQL Server' as Link, 'https://go.microsoft.com/fwlink/?LinkId=160556' AS URL
UNION SELECT CAST('2015-01-06' AS date) as SalesDate, 'Fernando Ross' as FullName,'South' as Territory, 'Accessories' as Subcategory,'Lens Adapter' as Product, CAST(1215.00 AS money) AS Sales, 18 as Quantity, 'What is New in Reporting Services (SSRS)' as Link, 'https://go.microsoft.com/fwlink/?LinkId=165064' AS URL
UNION SELECT CAST('2015-01-05' AS date) as SalesDate,  'Lauren Johnson' as FullName,'Central' as Territory, 'Digital' as Subcategory,'Compact Digital' as Product, CAST(10191.00 AS money) AS Sales, 79 as Quantity, 'Install Report Builder' as LinkText, 'https://go.microsoft.com/fwlink/?LinkId=154882' AS URL
UNION SELECT CAST('2015-01-05' AS date) as SalesDate,  'Warren Pal' as FullName,'North' as Territory, 'Digital' as Subcategory, 'Compact Digital' as Product, CAST(8772.00 AS money) AS Sales, 68 as Quantity, 'Report Builder in SQL Server' as Link, 'https://go.microsoft.com/fwlink/?LinkId=160556' AS URL
UNION SELECT CAST('2015-01-05' AS date) as SalesDate,  'Fernando Ross' as FullName,'South' as Territory, 'Digital' as Subcategory, 'Compact Digital' as Product, CAST(10578.00 AS money) AS Sales, 82 as Quantity, 'What is New in Reporting Services (SSRS)' as Link, 'https://go.microsoft.com/fwlink/?LinkId=165064' AS URL
UNION SELECT CAST('2015-01-05' AS date) as SalesDate, 'Lauren Johnson' as FullName,'Central' as Territory,'Digital' as Subcategory, 'Slim Digital' as Product, CAST(7218.10 AS money) AS Sales, 38 as Quantity, 'Install Report Builder' as LinkText, 'https://go.microsoft.com/fwlink/?LinkId=154882' AS URL
UNION SELECT CAST('2015-01-05' AS date) as SalesDate, 'Warren Pal' as FullName,'North' as Territory,'Digital' as Subcategory, 'Slim Digital' as Product, CAST(8357.80 AS money) AS Sales, 44 as Quantity, 'Report Builder in SQL Server' as Link, 'https://go.microsoft.com/fwlink/?LinkId=160556' AS URL
UNION SELECT CAST('2015-01-05' AS date) as SalesDate, 'Fernando Ross' as FullName,'South' as Territory,'Digital' as Subcategory,'Slim Digital' as Product, CAST(9307.55 AS money) AS Sales, 49 as Quantity, 'What is New in Reporting Services (SSRS)' as Link, 'https://go.microsoft.com/fwlink/?LinkId=165064' AS URL
UNION SELECT CAST('2015-01-06' AS date) as SalesDate,  'Lauren Johnson' as FullName,'Central' as Territory, 'Digital' as Subcategory,'Compact Digital' as Product, CAST(3870.00 AS money) AS Sales, 30 as Quantity, 'Install Report Builder' as LinkText, 'https://go.microsoft.com/fwlink/?LinkId=154882' AS URL
UNION SELECT CAST('2015-01-06' AS date) as SalesDate,  'Warren Pal' as FullName,'North' as Territory, 'Digital' as Subcategory,'Compact Digital' as Product, CAST(5805.00 AS money) AS Sales, 45 as Quantity, 'Report Builder in SQL Server' as Link, 'https://go.microsoft.com/fwlink/?LinkId=160556' AS URL
UNION SELECT CAST('2015-01-06' AS date) as SalesDate,  'Fernando Ross' as FullName,'South' as Territory, 'Digital' as Subcategory, 'Compact Digital' as Product, CAST(8643.00 AS money) AS Sales, 67 as Quantity, 'What is New in Reporting Services (SSRS)' as Link, 'https://go.microsoft.com/fwlink/?LinkId=165064' AS URL
UNION SELECT CAST('2015-01-06' AS date) as SalesDate, 'Lauren Johnson' as FullName,'Central' as Territory, 'Digital' as Subcategory, 'Slim Digital' as Product, CAST(9877.40 AS money) AS Sales, 52 as Quantity, 'Install Report Builder' as LinkText, 'https://go.microsoft.com/fwlink/?LinkId=154882' AS URL
UNION SELECT CAST('2015-01-06' AS date) as SalesDate, 'Warren Pal' as FullName,'North' as Territory, 'Digital' as Subcategory, 'Slim Digital' as Product, CAST(12536.70 AS money) AS Sales, 66 as Quantity, 'Report Builder in SQL Server' as Link, 'https://go.microsoft.com/fwlink/?LinkId=160556' AS URL
UNION SELECT CAST('2015-01-06' AS date) as SalesDate, 'Fernando Ross' as FullName,'South' as Territory, 'Digital' as Subcategory, 'Slim Digital' as Product, CAST(6648.25 AS money) AS Sales, 35 as Quantity, 'What is New in Reporting Services (SSRS)' as Link, 'https://go.microsoft.com/fwlink/?LinkId=165064' AS URL
Select Run (!) to run the query.
The query results are the data available to display in your report.
Select OK.
Select OK.
Add a field to the report design surface
If you want a field from your dataset to appear in a report, your first impulse might be to drag it directly to the design surface. This exercise points out why that doesn't work and what to do instead.
Add a field to the report (and get the wrong result)
Drag the FullName field from the Report Data pane to the design surface.
Report Builder creates a text box with an expression in it, represented as
<Expr>.Select Run.
You only see one record, Fernando Ross, which is alphabetically the first record in the query. The field doesn't repeat to show the other records in that field.
Select Design to return to design view.
Select the expression
<Expr>in the text box.In the Properties pane, for the Value property, you see the following (if you don't see the Properties pane on the View tab, check Properties):
=First(Fields!FullName.Value, "TextDataSet")The
Firstfunction is designed to retrieve only the first value in a field.Dragging the field directly to the design surface created a text box. Text boxes by themselves aren't data regions, so they don't display data from a report dataset. Text boxes in data regions, such as tables, matrices, and lists, do display data.
Select the text box (if you have the expression selected, press ESC to select the text box), and press the DELETE key.
Add a field to the report (and get the right result)
On the Insert tab of the ribbon, in the Data Regions area, select List. Choose the design surface, and then drag to create a box that about 2 inches wide and 1 inch tall.
Drag the FullName field from the Report Data pane to the list box.
This time Report Builder creates a text box with the expression
[FullName]in it.Select Run.
This time the box repeats to show all the records in the query.
Select Design to return to design view.
Select the expression in the text box.
In the Properties pane, for the Value property, you see the following:
=Fields!FullName.ValueBy dragging the text box to the list data region, you display the data that is in that field in the dataset.
Select the list box and press the DELETE key.
Add a table to the report design surface
Create this table so you have a place to put hyperlinks and rotated text.
On the Insert tab, go to Table > Table Wizard.
On the Choose a dataset page of the New Table or Matrix wizard, select Choose an existing dataset in this report or a shared dataset > TextDataset (in this Report) > Next.
On the Arrange fields page, drag the Territory, LinkText, and Product fields to Row groups, drag the Sales field to Values, then select Next.
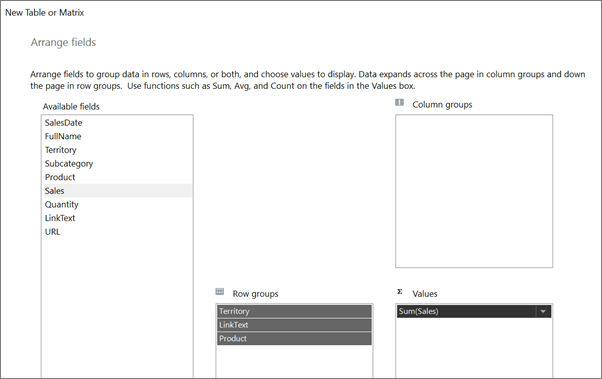
On the Choose the layout page, clear the Expand/collapse groups check box so you can see the whole table, then select Next.
Select Finish.
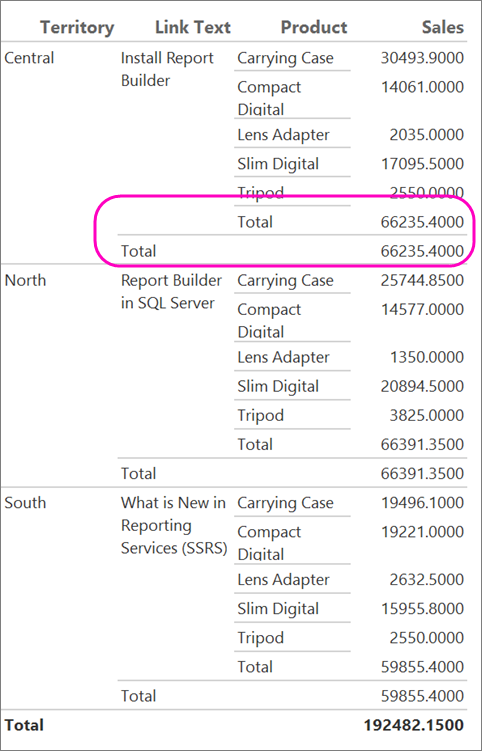
Select Run.
The table looks OK, but it has two Total rows. The LinkText column doesn't need a Total row.
Select Design to return to design view.
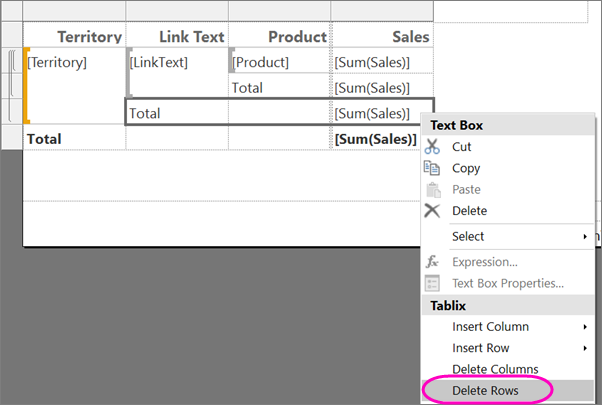
Select the Total cell in the LinkText column, then hold down the SHIFT key and choose the two cells to its right: and the empty cell in the Product column and the
[Sum(Sales)]cell in the Sales column.With those three cells selected, right-click one of those cells and choose Delete Rows.
Select Run.
Now it has only one Total row.
Add a hyperlink to the report
In this section, you add a hyperlink to text in the table from the previous section.
Select Design to return to design view.
Right-click in the cell containing
[LinkText], and select Text Box Properties.On the Action tab, select Go to URL.
In the Select URL box, select [URL], then choose OK.
The text doesn't look any different. You need to make it look like link text.
Select
[LinkText].On the Home tab > Font, select Underline, and change Color to Blue.
Select Run.
The text now looks like a link.
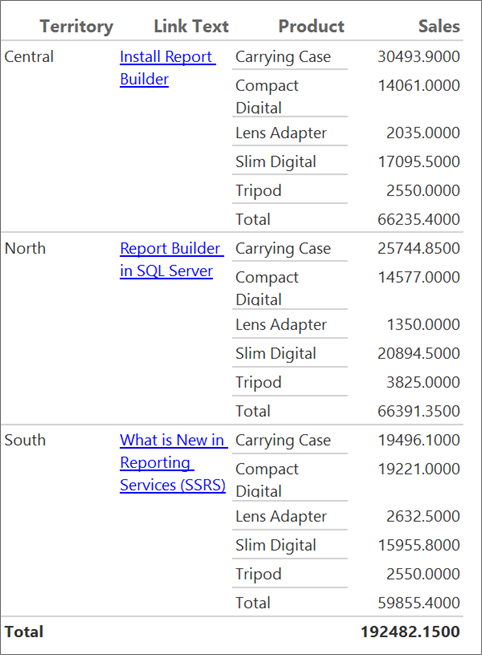
Select a link. If the computer is connected to the Internet, a browser opens to a Report Builder Help article.
Rotate text in the report
In this section, you rotate some of the text in the table from the previous sections.
Select Design to return to design view.
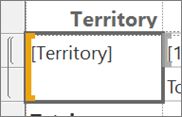
Select in the cell containing
[Territory].On the Home tab in the Font section, select the Bold button.
If the Properties pane isn't open, on the View tab, select the Properties check box.
Locate the WritingMode property in the Properties pane, and change it from Default to Rotate270.
Note
When the properties in the Properties pane are organized into categories, WritingMode is in the Localization category. Be sure you have selected the cell and not the text. WritingMode is a property of the text box, not of the text.
On the Home tab > Paragraph section, select Middle and Center to locate the text in the center of the cell both vertically and horizontally.
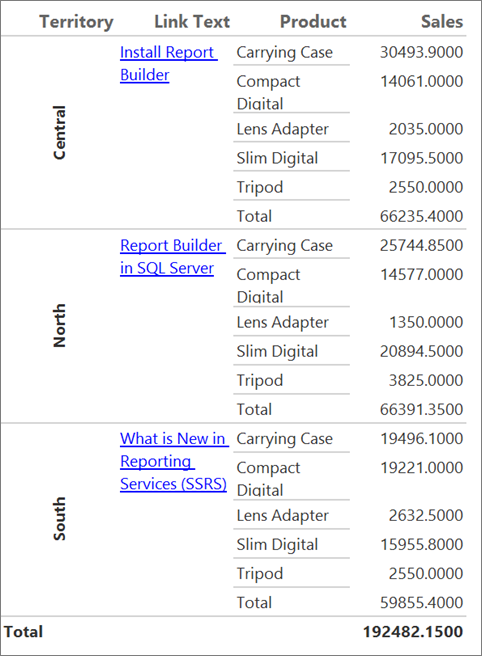
Select Run (!).
Now the text in the [Territory] cell runs vertically from the bottom to the top of the cells.
Format currency
Select Design to switch to design view.
Select the top table cell that contains
[Sum(Sales)], hold down the SHIFT key, and choose the bottom table cell that contains[Sum(Sales)].On the Home tab, go to Number group > Currency button.
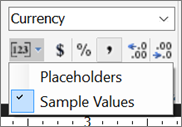
(Optional) If your regional setting is English (United States), the default sample text is [$12,345.00]. If you don't see an example currency value in the Numbers group, select Placeholder Styles > Sample Values.
(Optional) On the Home tab in the Number group, select the Decrease Decimals button twice to display dollar figures with no cents.
Select Run (!) to preview the report.
The report now displays formatted data and is easier to read.
Display text with HTML formatting
Select Design to switch to design view.
On the Insert tab, select Text Box, and then on the design surface, choose and drag to create a text box under the table, about 4 inches wide and 3 inches tall.
Copy this text and paste it into the text box:
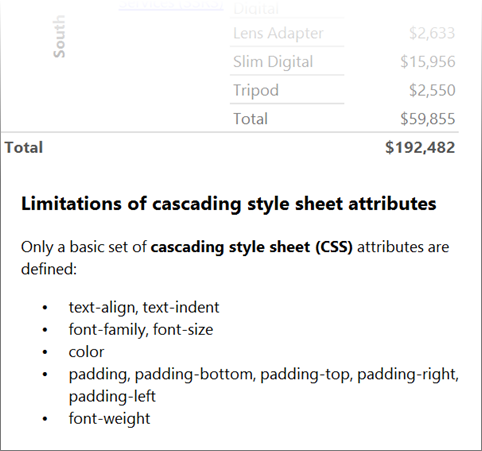
<h4>Limitations of cascading style sheet attributes</h4>
      <p>Only a basic set of <b>cascading style sheet (CSS)</b> attributes are defined:</p>
      <ul><li>
          text-align, text-indent
        </li><li>
          font-family, font-size
        </li><li>
          color
        </li><li>
          padding, padding-bottom, padding-top, padding-right, padding-left
        </li><li>
          font-weight
        </li></ul>
Drag the lower edge of the text box so all the text fits. You notice the design surface gets larger as you drag.
Select all of the text in the text box.
Right-click all of the selected text and choose Text Properties.
This property is of the text, not the text box, so in one text box you could have a mixture of plain text and text that uses HTML tags as styles.
On the General tab, under Markup type, select HTML - Interpret HTML tags as styles.
Select OK.
Select Run (!) to preview the report.
The text in the text box is displayed as a heading, paragraph, and bulleted list.
Save the report
You can save reports to a report server, SharePoint library, or your computer.
In this tutorial, save the report to a report server. If you don't have access to a report server, save the report to your computer.
Save the report on a report server
From the Report Builder button, select Save As.
Select Recent Sites and Servers.
Select or enter the name of the report server where you have permission to save reports.
The message "Connecting to report server" appears. When the connection is complete, you see the contents of the report folder that the report server administrator specified as the default location for reports.
In Name, replace the default name with a name of your choosing.
Select Save.
The report is saved to the report server. The name of the report server that you're connected to appears in the status bar at the bottom of the window.
Save the report on your computer
From the Report Builder button, select Save As.
Select Desktop, My Documents, or My computer, and then browse to the folder where you want to save the report.
In Name, replace the default name with a name of your choosing.
Select Save.
Related content
- Report Builder tutorials
- Format paginated report items (Report Builder)
- Microsoft Report Builder in SQL Server
- Try asking the Reporting Services forum