Note
Access to this page requires authorization. You can try signing in or changing directories.
Access to this page requires authorization. You can try changing directories.
The Query Performance Dashboard in the MSSQL extension for Visual Studio Code helps you investigate query performance without leaving your editor. It uses data from Query Store to identify resource-intensive queries, explore execution history and wait statistics, compare performance over time, and review execution plans.
Query Store captures query text, execution plans, and runtime statistics for a database. The dashboard presents this historical data so you can move from a database-wide overview to an individual query and its plans. The available history depends on the data that Query Store captures and retains.
Note
The Query Performance Dashboard is in public preview.
Prerequisites
- Connect to a database that supports Query Store.
- Enable Query Store in the database and allow it to capture workload data. For setup instructions, see Enable Query Store.
- Use an account with permission to read Query Store data in the target database.
If Query Store is off, enable it before investigating query performance. If Query Store is read-only, you can review existing data, but it doesn't capture new activity. An empty time frame can also mean that Query Store hasn't captured or retained data for that period.
Open the dashboard
- In the Connections view, expand your connection and right-click the database you want to investigate.
- Select Open Query Performance Dashboard (Preview).
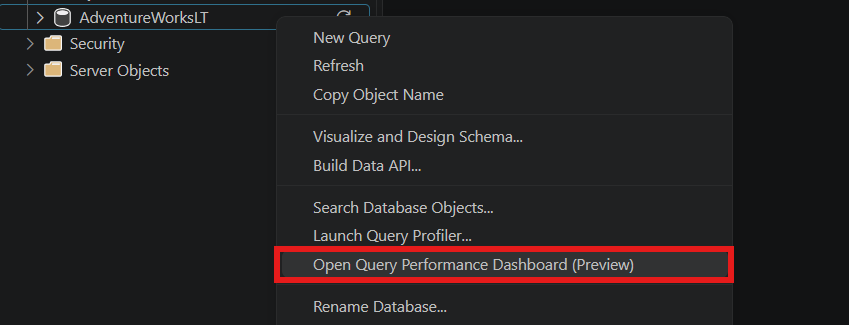
The dashboard opens for the selected database. Use the database selector at the top of the dashboard to switch databases.
Explore the query overview
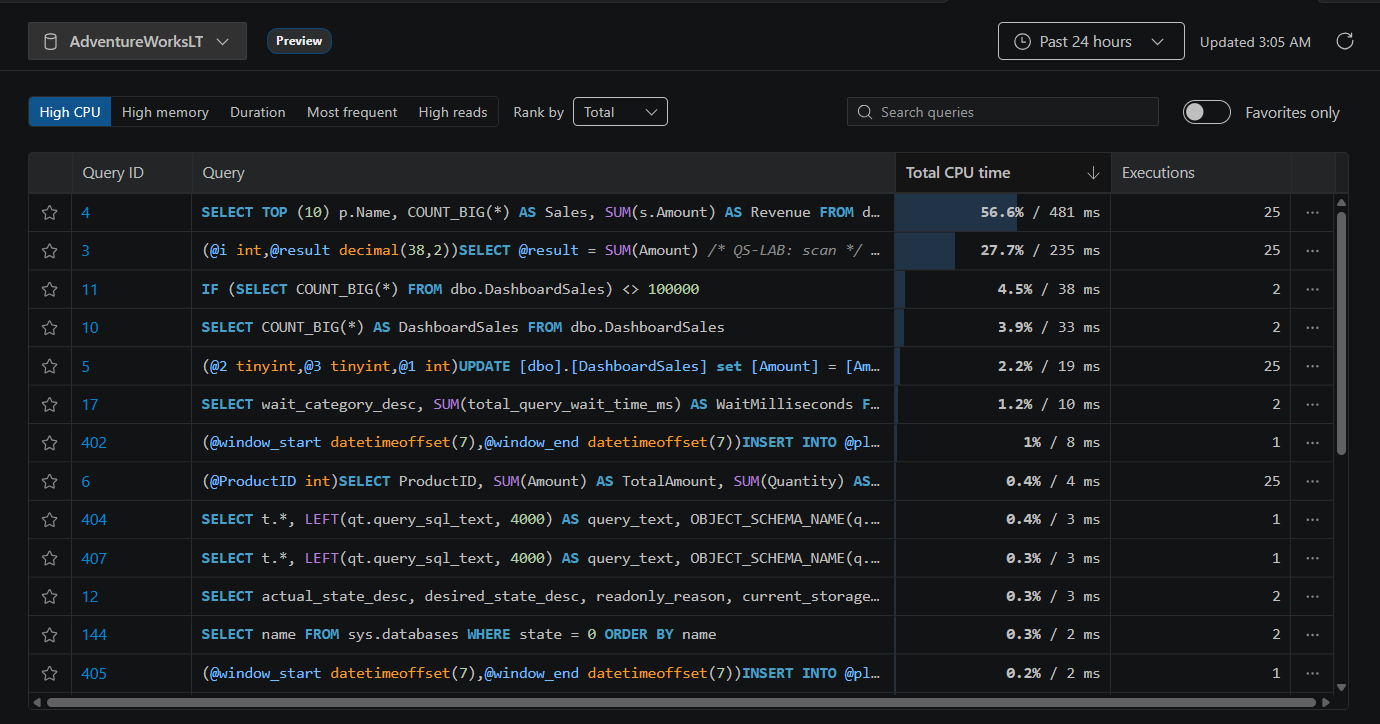
The overview lists queries for the selected database and time frame. Select a category to focus on a different aspect of the workload.
| Category | Use it to find |
|---|---|
| High CPU | Queries that consume the most CPU time. |
| High memory | Queries with the largest memory grants. |
| Duration | Queries with the longest execution times. |
| Most frequent | Queries with the highest execution counts. |
| High reads | Queries with the most logical reads. |
For resource and duration categories, use Rank by to choose Total, Average, Maximum, Minimum, or Standard deviation. For example, rank by Total to identify the largest overall CPU consumers, or by Average to find queries with a high CPU cost per execution. Most frequent ranks queries by execution count and doesn't use this selector.
Use the time-frame selector at the upper right to choose the past hour, 12 hours, 24 hours, seven days, or 30 days, or set a custom range. The default is Past 24 hours. Select Refresh to reload the data. Rankings and execution counts reflect the selected period, and the time frame stays selected as you move between the overview and query details.
To focus the list further, enter text in Search queries. Select the star beside a query to mark it as a favorite, and turn on Favorites only to show your favorites.
Select a Query ID to open the details for that query.
Investigate a query
The query detail page brings together the query text, summary statistics, and four tabs: Execution history, Waits, Compare, and Plans. Use these views to investigate when a query became expensive, what it waited for, and whether a different execution plan coincided with the change.
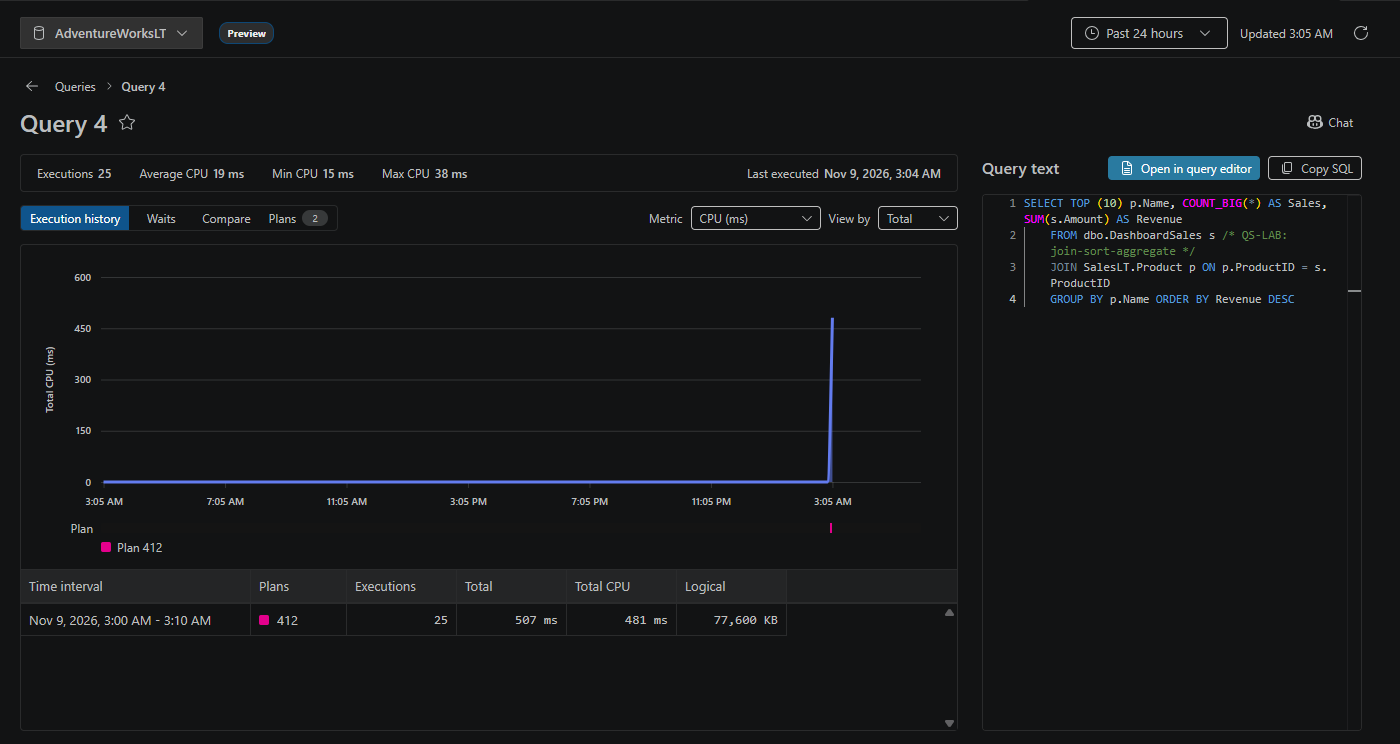
The summary shows execution count, average, minimum, and maximum values for the selected metric, and the last execution time. The query text remains available beside the tabs. Select Open in query editor to open the SQL in an editor, or Copy SQL to copy it.
Review execution history
Use Execution history to explore how the query performs over the selected time frame.
- Choose a Metric, such as duration, CPU time, logical reads, or memory grants.
- Use View by to choose Total, Average, Maximum, or Minimum.
- Review the chart for changes or spikes, and use the plan indicators to see which plans ran during those intervals.
- Review the interval table for execution counts, plan IDs, duration, CPU time, and logical reads.
For example, switch from total CPU time to average CPU time to distinguish an increase in execution frequency from an increase in the CPU cost of each execution.
Review waits
Select Waits to understand where the query spends time waiting. The view shows wait time over the selected period and breaks it down by wait category, with total wait time and average wait time per execution.
Use this view alongside execution history to investigate whether a slowdown involves resource consumption or waiting, such as waits for locks or I/O. Wait statistics are available only when the database supports Query Store wait statistics and wait-statistics capture is enabled.
Compare recent and baseline performance
Use the Compare tab to compare CPU time or memory grants between the selected period and an earlier baseline. For example, compare the past 24 hours with the preceding 30 days to investigate a change in a query's typical resource use.
- Set the dashboard time frame to Past 24 hours, or choose another period to investigate.
- Open a query and select Compare.
- Select CPU or Memory.
- Use View by to select Average per execution or Total per day. The first compares the cost of each execution; the second compares daily resource use across periods of different lengths.
- Select a baseline: Same length before, 7 days before, or 30 days before. The baseline ends where the selected recent period starts, so the two periods don't overlap.
- Review the recent value, baseline value, and percentage change. Use the per-plan table to see how individual plans contribute to the difference.
The comparison depends on Query Store data being available for both periods. Memory refers to query memory grants, not total database or server memory usage.
Review and compare query plans
Select Plans to review the query's execution plans captured in Query Store. The list includes plan IDs, execution counts, average duration and CPU time, last execution times, and plan-forcing status. Runtime statistics reflect the selected time frame.
Select a plan ID to open that execution plan. To compare different plans for the same query:
- Select the checkboxes beside two plans in the list.
- Select Compare plans to open the plan comparison view.
- Review the plans to investigate differences in how the query executes.
You can compare two plans at a time. Use execution history and the performance comparison together with the plan comparison to investigate whether a plan change coincides with higher CPU time, memory grants, or duration.
Continue the investigation in chat
Use Chat to continue investigating a query in GitHub Copilot Chat. You can find it in two places:
- In the overview, open the actions menu (...) at the right of a query row, and select Chat.
- On the query detail page, select Chat at the upper right, above the query text. This button remains available as you switch between Execution history, Waits, Compare, and Plans.

Selecting Chat opens GitHub Copilot Chat in agent mode and sends a prompt with the server, database, saved connection profile, query ID, and selected time range. The prompt explicitly references #mssql_query_store_analyze_query, which retrieves query statistics, execution history, waits, and summaries of the main plans for a brief performance assessment. It then asks what you want to investigate next and requires confirmation before applying changes.
Query Store diagnostic reads don't request confirmation or modify your database. Forcing or unforcing a plan is a separate operation that requires review and confirmation. For example prompts and the full workflow, see Investigate Query Store performance with GitHub Copilot. To set up Copilot, see GitHub Copilot for the MSSQL extension.
Feedback and support
If you have ideas, feedback, or want to engage with the community, join the discussion at https://aka.ms/vscode-mssql-discussions. To report a bug, visit https://aka.ms/vscode-mssql-bug. To request a new feature, go to https://aka.ms/vscode-mssql-feature-request.