How to create a dashboard with the State widget in the Web console
Important
This version of Operations Manager has reached the end of support. We recommend you to upgrade to Operations Manager 2022.
In System Center Operations Manager version 1801 and later, the Web console provides a monitoring interface for a management group that can be opened on any computer using any browser that has connectivity to the Web console server. The following steps describe how to create a dashboard in the new HTML5 web console with the Health State widget.
System Center Operations Manager Web console provides a monitoring interface for a management group that can be opened on any computer using any browser that has connectivity to the Web console server. The following steps describe how to create a dashboard in the new HTML5 web console with the Health State widget.
Add widget to dashboard
Open a web browser on any computer and enter
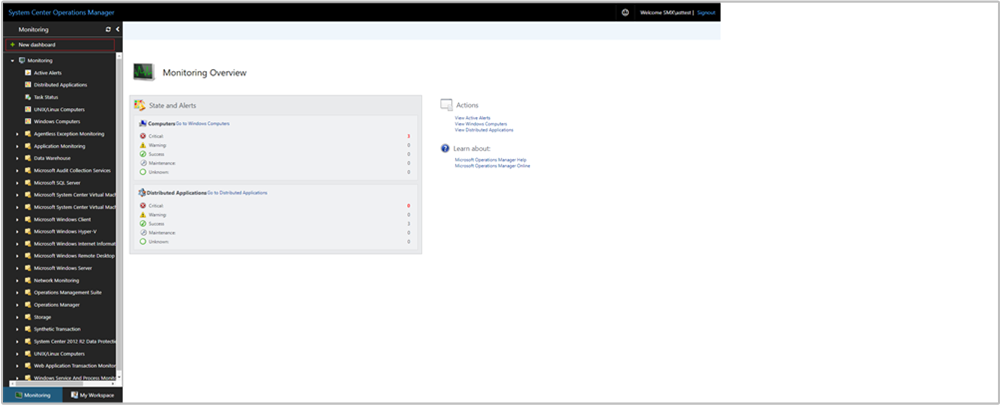
http://<web host>/OperationsManager, where web host is the name of the computer hosting the web console.From the left pane in the Web console, select + New dashboard.
On the Create New Dashboard page, provide a name and description for the dashboard you want to create.
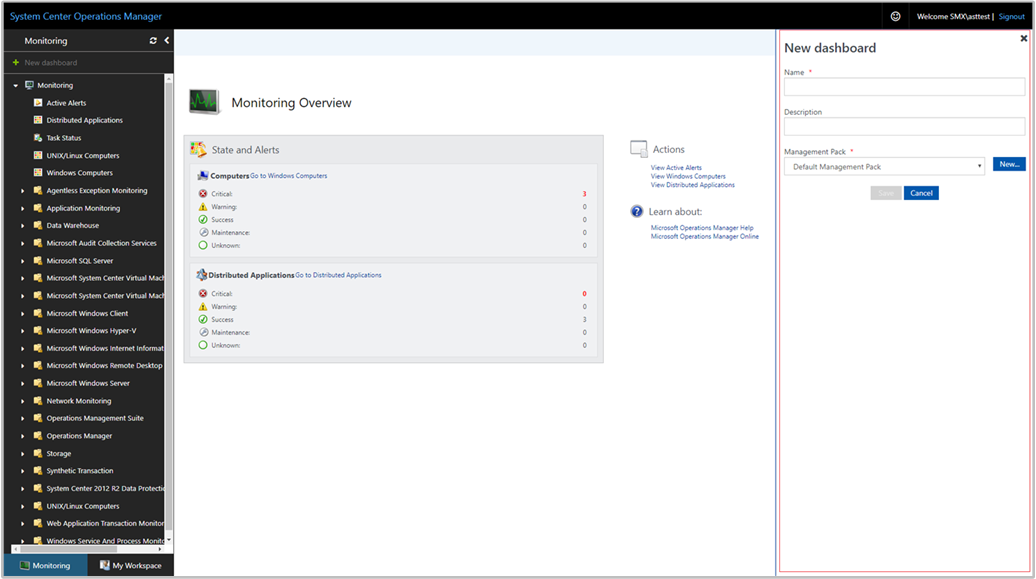
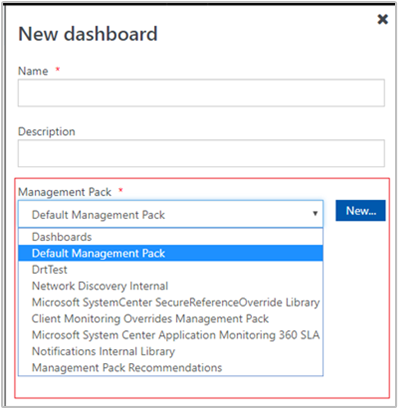
You can save the dashboard in an existing unsealed management pack by selecting the management pack from the Management Pack dropdown list or you can save the dashboard by creating a new management pack by selecting New next to the Management Pack dropdown list and provide a name, description, and optionally a version number.
When you've completed specifying where to save the new dashboard to, select OK.
Select Save after providing a name and description for the new dashboard.
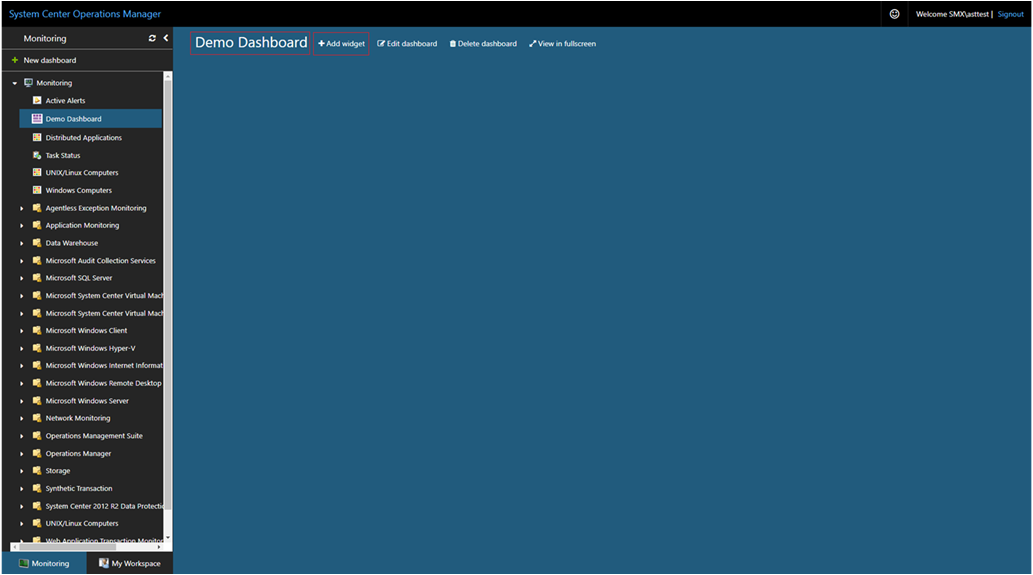
On the blank empty dashboard, you see the dashboard name, Add Widget, Edit Dashboard, Delete dashboard, and View in fullscreen options on the top of the page.
Select State Widget from the Select Widget dropdown list.
In the State widget pane, select scope for the widget by selecting either Groups or Class.
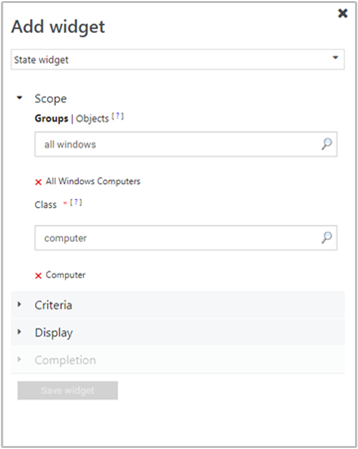
For either option selected, you can search by keyword in the list. As you begin typing, the list filters based on your input. You can select an individual group or class or multiple from the returned results.
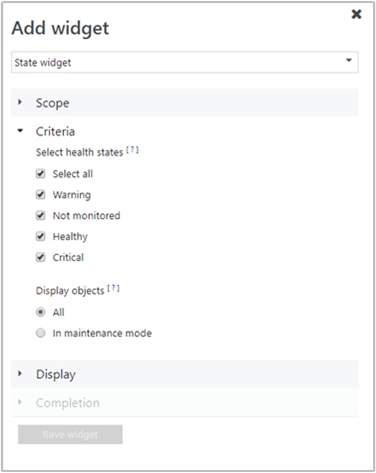
Set the criteria to identify the health state to display. To narrow the results, you can filter by selecting the following:
- By all health states or a specific state
- Display all objects or only those in maintenance mode
Data matching the defined criteria will only be displayed in the widget.
Select Display to choose the columns to be displayed in the dashboard. You can select or search for the columns from the dropdown list.
Complete the configuration by providing a Name, Description, and Widget refresh interval (default interval is 5 minutes) for the widget. Select Save Widget to save your new dashboard.


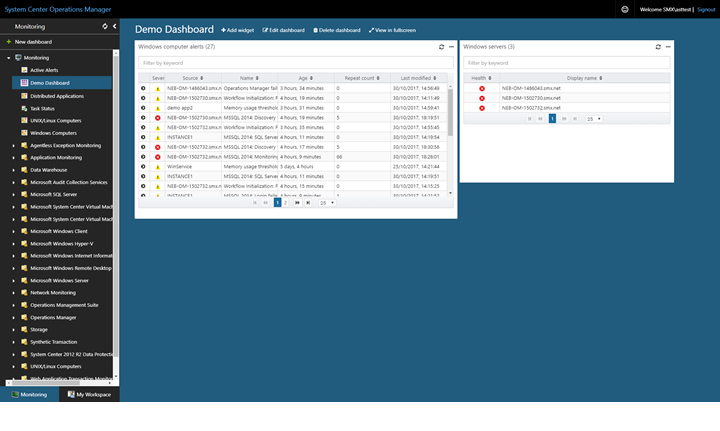
After the widget has been created, it displays health state of the objects based on the scope and criteria defined. You see the name of the state widget along with the number of objects in the header of the widget. Objects can also be filtered in the widget by searching for a keyword in the filter box.
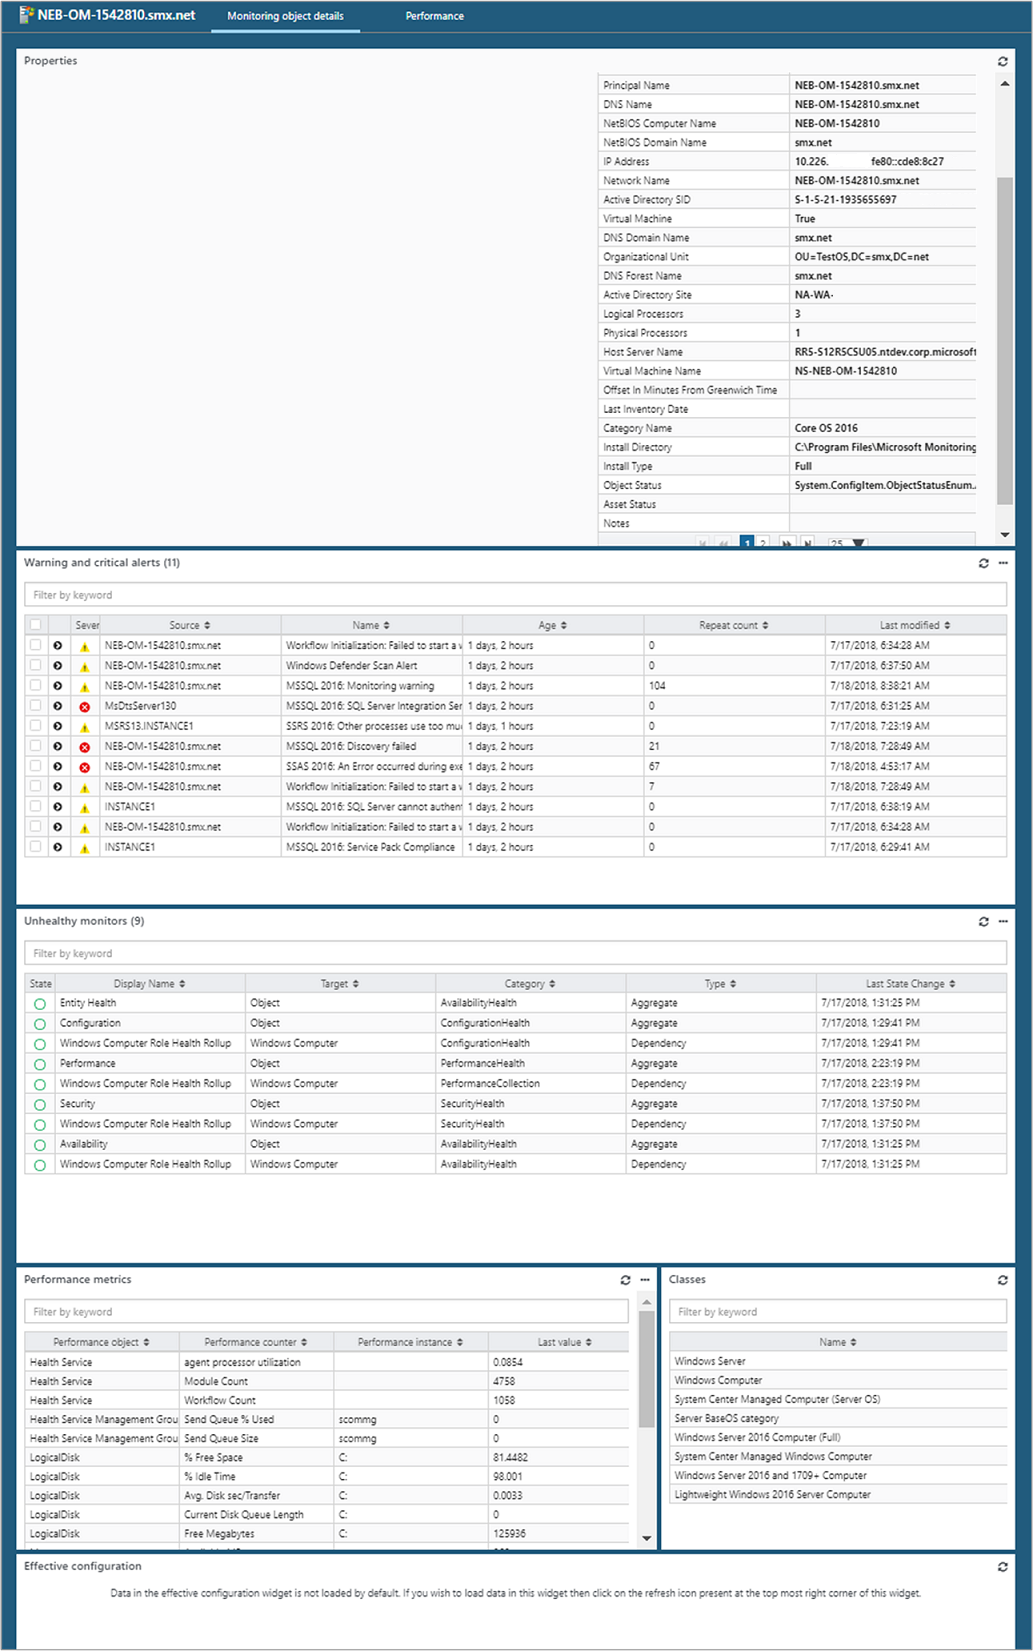
When you select an object in the widget, it presents the Monitoring Object details page and from here you can view:
- Discovered inventory reported for the object instance
- Alerts generated
- Performance metrics
- Classes
- Effective configuration of the rules and monitors running on the target device or system
To learn more about the effective configuration feature, see View configuration of a monitored object.
Actions on State widget
For one or more monitored objects selected in the widget, you can perform such actions as:
- Export the alerts to Excel for further analysis
- Modify how the alerts are presented by included or excluding columns or how to group alerts, customized to your personal needs
To perform these actions, hover your mouse over the widget and click on the ellipsis ... on the top right corner of the widget. This will display actions available for the widget.
- Select Export to Excel to export the alert data to an Excel file.
- Select Personalize to change your selection of columns to be displayed or to group alerts. Select Save personalization when you have completed making your changes.
Additional view options in State widget
Note
This feature is applicable for 2019 UR3 and later.
State widget now supports sort by option.
In earlier releases, this feature isn't available for State widget, and on all H5 dashboard personalization but is available on all views of operations console of Operations Manager 2019.
With Operations Manager 2019 UR3 and later, you can sort the results columns in the State widget, and also group the columns. For more information, see Support for Sort by option.
View options in State widget
State widget supports sort by option.
You can sort the results columns in the State widget, and also group the columns. For more information, see Support for Sort by option.
Next steps
To learn how to create a dashboard in the new web console with the Topology widget, see How create a dashboard with the Topology widget in the Web console.
Feedback
Coming soon: Throughout 2024 we will be phasing out GitHub Issues as the feedback mechanism for content and replacing it with a new feedback system. For more information see: https://aka.ms/ContentUserFeedback.
Submit and view feedback for