Using Health Explorer to investigate problems
Use Health Explorer to find out which monitor is reflecting a health state issue and review knowledge about the monitor and possible causes for actions related to it. In the Active Alerts view, select the alert to highlight it. The Health Explorer link under Alert Actions in the Tasks pane becomes active. Health Explorer is also accessible when selecting a monitored object from any health state view in the console.
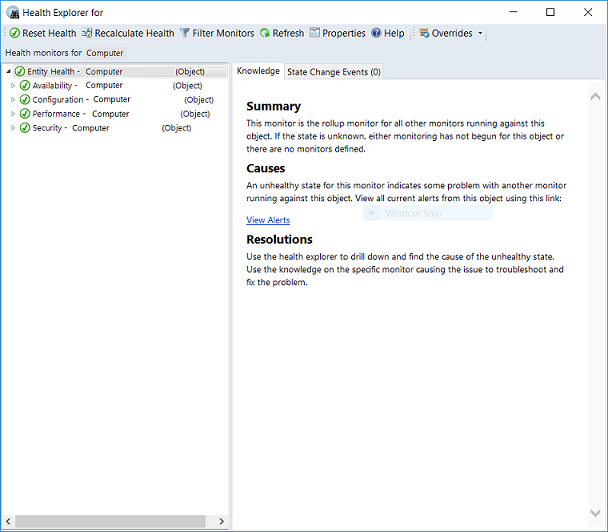
By default, when the Health Explorer window opens, all monitors in a failed state are expanded. If a monitor contains other monitors, as in the case of a roll-up monitor, Health Explorer shows all child monitors in a hierarchical layout, displaying monitoring data for all dependent services and applications. To view more information about any dependent monitor, you can right-click that monitor, and select Monitor Properties to open another Health Explorer window.
Monitor health states
The following illustration shows monitors in a healthy state:
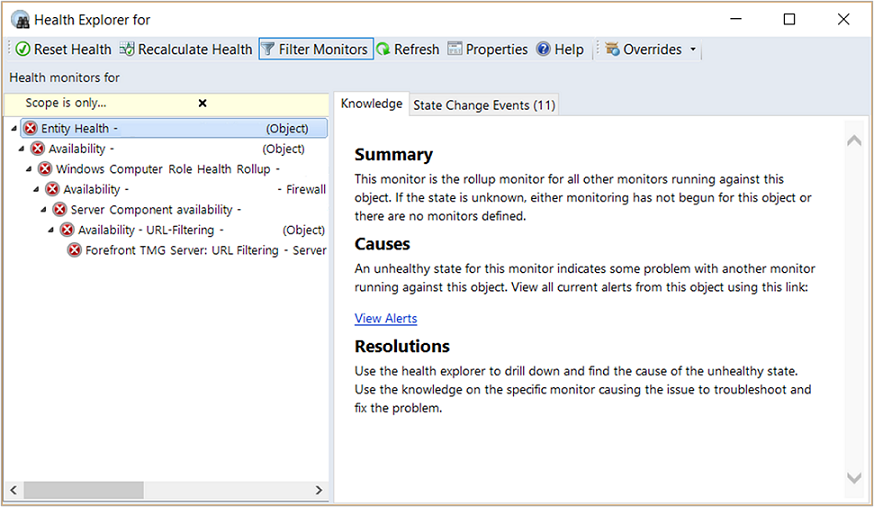
The following illustration shows some monitors in a critical state:
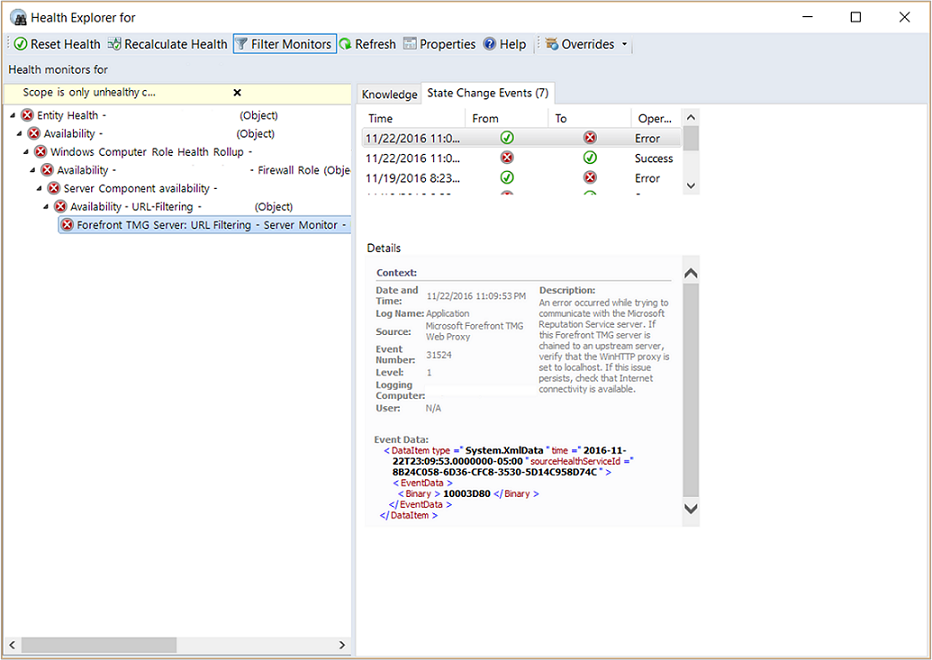
Select a monitor to view more information about the monitor in the Details pane. The State Change Events tab in the Details pane shows you when the state for the monitor changed, and the details give you information for the context of the state change:
Next steps
Before changing the number of missed heartbeats allowed, first review How Heartbeats Work in Operations Manager.
To learn more about how to investigate an agent heartbeat failure and ways to resolve them, review Resolving Heartbeat Alerts.
When an alert is generated, you can View Active Alerts and Details in the Operations and Web console to identify possible issues and help identify next steps towards resolving them.