Linux Log file monitoring in System Center Operations Manager

Important

This version of Operations Manager has reached the end of support. We recommend you to upgrade to Operations Manager 2022.

Note

System Center Operations Manager won't support the fluentD based log file monitoring upon the OMS agent retirement which is scheduled for August 2024.

System Center Operations Manager now has enhanced log file monitoring capabilities for Linux servers by using the newest version of the agent that uses Fluentd. This update provides the following improvements over previous log file monitoring:

  • Wild card characters in log file name and path.
  • New match patterns for customizable log search like simple match, exclusive match, correlated match, repeated correlation, and exclusive correlation.
  • Support for generic Fluentd plugins published by the Fluentd community.

Basic operation

The basic operation of log file monitoring in Linux includes the following steps:

  1. Record is written to a log on a Linux agent.
  2. Fluentd collects the record and creates an event on pattern match.
  3. Event is sent to OMED service on management server and logged to the System Center OMED Service Event Log on the management server. (The System Center OMED Service Event Log is only created when an Event has been successfully sent from a Fluentd Agent)
  4. Rules and monitors in a custom management pack collect events and create alerts in Operations Manager.

Overview of configuration

The following steps are required to enable log file monitoring on Linux agents. Each of these steps is described in detail in the following sections.

  1. Import the latest Linux management pack.
  2. Install the latest version of the Linux agent on each Linux computer to be monitored.
  3. Create Fluentd configuration file to collect logs.
  4. Copy configuration file to Linux agents.
  5. Create rules and monitors using the sample management pack to collect events from the log and create alerts.

Install the latest version of the Linux agent

The latest version of the Linux agent supports Fluentd, which is required for enhanced log file monitoring. You can get details and the installation process for the new agent at Install agent on UNIX and Linux from command line.

Configure Linux Log File monitoring

The Linux Management pack bundle has the latest Operations Manager agent (with Fluentd). To configure Linux log file monitoring, users should perform the following:

  1. Import the latest Linux Management pack using the standard process for installing a management pack.
  2. Install the new Linux agent on the Linux servers, this can be done through discovery wizard or manually.
  3. Enable the OMED service on each management server in the resource pool managing the Linux agents.

The OMED service collects events from Fluentd and converts them to Operations Manager events. Users should import a custom management pack, which can generate alerts based on the events received from the Linux servers.

You enable the OMED service either from the Operations console or manually on the management server or gateway server.

From Operations console

  1. From the Operations Console, go to Monitoring > Operations Manager > Management Server > Management Servers State.
  2. Select the management server in the Management Servers state pane.
  3. In the Tasks pane, select Health Service Tasks > Enable System Center OMED Server.

Manually

  1. Select Start, in the Start Search box, enter services.msc , and then press Enter.
  2. In the details pane, right-click the service System Center Operations Manager External DataSource Service, and select Properties.
  3. On the General tab, in Startup type , select Automatic, and select OK.
  4. In the details pane, right-click the service and select Start.

Create FluentD configuration file

You configure Fluentd operation with a configuration file. For log monitoring, you need to create a configuration file that includes such information as source log file name and path and filters to define which data to collect.

The master Fluentd configuration file omsagent.conf is located in /etc/opt/microsoft/omsagent/scom/conf/. You can add log file monitoring configuration directly to this file, but you should create a separate configuration file to better manage the different settings. You then use an @include directive in the master file to include your custom file.

For example, if you created logmonitoring.conf in /etc/opt/microsoft/omsagent/scom/conf/omsagent.d, you would add one of the following lines to fluent.conf:

  #Include all configuration files
  @include omsagent.d/*.conf

or

  #include single configuration file
  @include omsagent.d/logmonitoring.conf

You can get details on Fluentd configuration files at Fluentd Configuration file syntax. The following sections describe settings in different directives of the configuration file unique to log file monitoring. Each includes sample settings that you can paste into a configuration file and modify for your requirements.

A complete sample configuration file for log monitoring is available for you to review and evaluate before creating your own.

Source

The Source directive defines the source of the data you're collecting. This is where you define the details of your log file. Fluentd picks up each record written to the source and submits an event for it into Fluentd's routing engine. You need to specify a tag here in this directive. The tag is a string that is used as the directions for Fluentd’s internal routing engine to correlate different directives.

This example shows syslog records collected and tagged for processing by Operations Manager.

  <source>

      # Specifies input plugin. Tail is a fluentd input plugin - http://docs.fluentd.org/v0.12/articles/in_tail
      type tail

      # Specify the log file path. Supports wild cards.
      path /var/log/syslog

      # Recommended so that Fluentd will record the position it last read into this file.
      pos_file /home/user1/fluent-test/demo_syslog.log.pos

      # Used to correlate the directives.
      tag scom.log.syslog

      format /(?<message>.*)/

  </source>

Match

The match directive defines how to process events collected from the source with matching tags. Only events with a tag matching the pattern will be sent to the output destination. When multiple patterns are listed inside one match tag, events can match any of the listed patterns. The type parameter that specifies which plugin to use for these events.

This example processes events with tags matching scom.log.** and scom.alert (** matches zero or more tag parts). It specifies the out_scom plugin, which allows the events to be collected by the Operations Manager management pack.

  <match scom.log.** scom.event>

      # Output plugin to use
      type out_scom

      log_level trace
      num_threads 5

      # Size of the buffer chunk. If the top chunk exceeds this limit or the time limit flush_interval, a new empty chunk is pushed to the top of the  
      queue and bottom chunk is written out.
      buffer_chunk_limit 5m
      flush_interval 15s

      # Specifies the buffer plugin to use.
      buffer_type file

      # Specifies the file path for buffer. Fluentd must have write access to this directory.
      buffer_path /var/opt/microsoft/omsagent/scom/state/out_scom_common*.buffer

      # If queue length exceeds the specified limit, events are rejected.
      buffer_queue_limit 10

      # Control the buffer behavior when the queue becomes full: exception, block, drop_oldest_chunk
      buffer_queue_full_action drop_oldest_chunk

      # Number of times Fluentd will attempt to write the chunk if it fails.
      retry_limit 10

      # If the bottom chunk fails to be written out, it will remain in the queue and Fluentd will retry after waiting retry_wait seconds
      retry_wait 30s

      # The retry wait time doubles each time until max_retry_wait.
      max_retry_wait 9m

  </match>

Note

To disable Server Auth on the Linux machines that are using Fluentd communication, add a parameter enable_server_auth false to the SCOM out plugin for Fluentd, such as the following:

  <match scom.log.** scom.event>
  type out_scom

  max_retry_wait 9m
  enable_server_auth false
  </match>

Filter

The filter directive has the same syntax as match but allows for more complex filtering of which data to process. Collected events must match the criteria of all the filters to be added to the output.

There are six filter plugins for log file monitoring described here. Use one or more of these filters to define the events that you want to collect from your log file.

Simple match: filter_scom_simple_match

Takes up to 20 input patterns. Sends an event to Operations Manager whenever any pattern is matched.

  <filter tag>
      type filter_scom_simple_match
      regexp1 <key> <pattern>
      event_id1 <event ID>
      regexp2 <key> <pattern>
      event_id2 <event ID>
      .
      .
      .
      regexp20 <key> <pattern>
      event_id20 <event ID>
  </filter>

Exclusive match: filter_scom_excl_match

Takes two input patterns. Sends an event to Operations Manager when a single record matches pattern 1 but doesn't match pattern 2.

  <filter tag>
      type filter_scom_excl_match
      regexp1 <key> <pattern1>
      regexp2 <key> <pattern2>
      event_id <event ID>
  </filter>

Repeated correlation: filter_scom_repeated_cor

Takes three inputs: a pattern, a time interval, and many occurrences. When a match is found for the first pattern, a timer starts. An event is sent to Operations Manager if the pattern is matched the specified number of times before the timer ends.

  <filter tag>
      type filter_scom_repeated_cor
      regexp <key> <pattern>
      event_id <event ID>
      time_interval <interval in seconds>
      num_occurences <number of occurrences>
  </filter>

Correlated match: filter_scom_cor_match

Takes three inputs: two patterns and a time interval. When a match is found for the first pattern, a timer starts. An event is sent to Operations Manager if there's a match for the second pattern before the timer ends.

  <filter tag>
      type filter_scom_cor_match
      regexp1 <key> <pattern1>
      regexp2 <key> <pattern2>
      event_id <event ID>
      time_interval <interval in seconds>
  </filter>

Exclusive correlation: filter_scom_excl_correlation

Takes three inputs: two patterns and a time interval. When a match is found for the first pattern, a timer starts. An event is sent to Operations Manager if there's no match for the second pattern before the timer ends.

  <filter tag>
      type filter_scom_excl_correlation
      regexp1 <key> <pattern1>
      regexp2 <key> <pattern2>
      event_id <event ID>
      time_interval <interval in seconds>
  </filter>

Operations Manager converter: filter_scom_converter

Sends an event to Operations Manager for all the records it receives. Sends the specified event ID and description as part of the event.

  <filter tag>
      type filter_scom_converter
      event_id <event ID>
      event_desc <event description>
  </filter>

Copy configuration file to agent

The fluentd configuration file must be copied to /etc/opt/microsoft/omsagent/scom/conf/omsagent.d on all Linux computers you want to monitor. You must also add an @include directive in the master configuration file as described above.

Create rules and monitors

The Linux MP doesn't provide modules to collect events from FluentD. The Linux MP is bundled with the Linux agent. It's the fluentd module in the Linux agent and the OMED service on the management and gateway server that provides the capabilities for enhanced log file monitoring.

You need to create your own management pack with custom rules and monitors that use the module Microsoft.Linux.OMED.EventDataSource, which collects the events from Fluentd.

The following table lists the parameters of Microsoft.Linux.OMED.EventDataSource.

Parameter Type Description
ComputerName String Required. Specifies the name of the Linux computer for which events to be read. The ComputerName parameter is most commonly passed to the module by using the $Target notation, although it can be specified as any string. This module attempts to read events generated by the given Linux computer.
ManagedEntityId String Required. Specifies the managed entity ID of monitored entity. The ManagedEntityId parameter is most commonly passed to module by using $Target\Id$.
EventNumber Integer Optional. Indicates the event number of the event to retrieve. If this option is omitted, the module returns all the events generated for that computer and managed entity.

Overview of configuration

Log file monitoring requires the following steps. The detailed information is provided in the following sections:

  1. Import the latest System Center Operations Manager 2019 Linux management pack.
  2. Install the latest version of the Linux agent on each Linux computer to be monitored.
  3. Install latest OMSAgent on each Linux computer to be monitored.
  4. Create Fluentd configuration file to collect logs.
  5. Copy configuration file to Linux agents.
  6. Create rules and monitors using the sample management pack to collect events from the log and create alerts.
  1. Import the latest System Center Operations Manager 2022 Linux management pack.
  2. Install the latest version of the Linux agent on each Linux computer to be monitored.
  3. Install latest OMSAgent on each Linux computer to be monitored.
  4. Create Fluentd configuration file to collect logs.
  5. Copy configuration file to Linux agents.
  6. Create rules and monitors using the sample management pack to collect events from the log and create alerts.

Install the log monitoring management pack

Install the Microsoft.Linux.Log.Monitoring management pack to enable Linux log file monitoring.

Note

If you have the OMS agent configured and you try to uninstall UNIX and LINUX agent from the console, then OMS component won't be uninstalled from the agent.

Configure Linux log file monitoring

To configure Linux log file monitoring, perform the following steps:

  1. Import the latest System Center Operations Manager 2019 Linux management pack using the standard process for installing a management pack.

  2. Install the new Linux agent on the Linux servers manually or by [using Discovery wizard](/system-center/System Center Operations Manager/manage-deploy-crossplat-agent-console).

  3. Install the latest OMSAgent on each Linux computer that you want to monitor. Use the following commands:

    # Download latest OMS Agent from GitHub
    wget https://raw.githubusercontent.com/Microsoft/OMS-Agent-for-Linux/master/installer/scripts/onboard_agent.sh
    
    # Run onboarding script
    sh onboard_agent.sh
    

    Perform the following steps on the Linux agent:

  1. Import the latest System Center Operations Manager 2022 Linux management pack using the standard process for installing a management pack.

  2. Install the new Linux agent on the Linux servers manually or by [using Discovery wizard](/system-center/System Center Operations Manager/manage-deploy-crossplat-agent-console).

  3. Install the latest OMSAgent on each Linux computer that you want to monitor. Use the following commands:

    # Download latest OMS Agent from GitHub
    wget https://raw.githubusercontent.com/Microsoft/OMS-Agent-for-Linux/master/installer/scripts/onboard_agent.sh
    
    # Run onboarding script
    sh onboard_agent.sh
    

    Perform the following steps on the Linux agent:

  1. Create the folders in the following paths with the below commands:

    # Create omsagent.d folder
    mkdir -p /etc/opt/microsoft/omsagent/scom/conf/omsagent.d
    
    # Create certs folder
    mkdir /etc/opt/microsoft/omsagent/scom/certs
    
    # Create log folder
    mkdir -p /var/opt/microsoft/omsagent/scom/log
    
    # Create run folder
    mkdir /var/opt/microsoft/omsagent/scom/run
    
    # Create state folder
    mkdir /var/opt/microsoft/omsagent/scom/state
    
    # Create tmp folder
    mkdir /var/opt/microsoft/omsagent/scom/tmp
    
    # Create fluent-logging folder (used for log file position file, this location is flexible)
    mkdir -p /home/omsagent/fluent-logging
    
  2. Set ownership on each of the above folders to omsagent:omiusers:

    # Change owner of System Center Operations Manager folder
    chown omsagent:omiusers /etc/opt/microsoft/omsagent/scom
    
    # Change owner of log folder
    chown omsagent:omiusers /var/opt/microsoft/omsagent/scom/log
    
    # Change owner of run folder
    chown omsagent:omiusers /var/opt/microsoft/omsagent/scom/run
    
    # Change owner of state folder
    chown omsagent:omiusers /var/opt/microsoft/omsagent/scom/state
    
    # Change owner of tmp folder
    chown omsagent:omiusers /var/opt/microsoft/omsagent/scom/tmp
    
    # Change owner of fluent-logging folder (used for log file position file, this location is flexible)
    chown omsagent:omiusers /home/omsagent/fluent-logging
    

    Screenshot of log file monitoring.

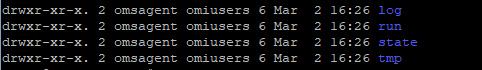
  3. Create omsagent and omsconfig files:

    # Create omsadmin.conf file
    touch /etc/opt/microsoft/omsagent/scom/conf/omsadmin.conf
    
    # Create omsagent.conf file
    touch /etc/opt/microsoft/omsagent/scom/conf/omsagent.conf
    
  4. Set ownership on each of the above files to omsagent:omiusers:

    # Change owner of omsadmin.conf file
    chown omsagent:omiusers /etc/opt/microsoft/omsagent/scom/conf/omsadmin.conf
    
    # Change owner of omsagent.conf file
    chown omsagent:omiusers /etc/opt/microsoft/omsagent/scom/conf/omsagent.conf
    
  5. Edit the file /etc/opt/microsoft/omsagent/scom/conf/omsadmin.conf, and add the following information after changing the highlighted information.

    WORKSPACE_ID=scom
    System Center Operations Manager_ENDPOINT=https://<mark>\<MSFQDN\></mark>:8886
    MONITORING_ID={274F8D7B-DBCA-8FC3-1451-8DCD55092156}
    
  6. Restart the OMSAgent:

    /opt/microsoft/omsagent/bin/service_control restart
    
  7. Verify the status in the omsagent log:

    tail -100 /var/opt/microsoft/omsagent/scom/log/omsagent.log
    

Enable the OMED service

Enable the OMED service on each management server in the resource pool, managing the Linux agents.

The OMED service collects events from Fluentd and converts them to Operations Manager events. You import a custom management pack, which can generate alerts based on the events received from the Linux servers.

You can enable the OMED service either from the Operations console or manually on the management server or gateway server.

  1. From the Operations console, go to Monitoring>Operations Manager>Management Server>Management Servers State.
  2. Select the management server in the Management Servers state.
  3. From Tasks, select Health Service Tasks>Enable System Center OMED Server.

Add OMED Firewall Rule

In order to enable to OMED Firewall Rule you have two options, either add the port (TCP/8886) automatically via PowerShell or manually.

Follow these steps to automatically add rule with PowerShell:

The following command allows you to automatically add the firewall rule:

Set-NetFirewallRule -DisplayName "System Center Operations Manager External DataSource Service" -Direction Inbound -Action Allow -Protocol TCP -LocalPort 8886

Assign a Client Certificate for OMSAgent

You have two options when assigning the client certificate for OMSAgent.

  1. Link to the signed certificate from the OMI Agent.
  2. Generate a client certificate manually for the OMS Agent.

Select the required tab for steps to link to the signed certificate from the OMI Agent or generate a client certificate manually from the OMS Agent:

  1. Set ownership on the omi.pem and omikey.pem file to omsagent:omiusers:

    # Change owner of System Center Operations Manager-cert.pem file
    chown omsagent:omiusers /etc/opt/microsoft/omsagent/scom/certs/scom-cert.pem
    
    # Change owner of System Center Operations Manager-key.pem file
    chown omsagent:omiusers /etc/opt/microsoft/omsagent/scom/certs/scom-key.pem
    
  2. Run the following command on your Linux machine to set the OMS Agent Client Certificate to the OMI Certificate (Operations Manager Linux Agent Certificate):

    # Link file omi.pem to System Center Operations Manager-cert.pem
    ln -s /etc/opt/omi/ssl/omi.pem /etc/opt/microsoft/omsagent/scom/certs/scom-cert.pem
    
    # Link file omikey.pem to System Center Operations Manager-key.pem
    ln -s /etc/opt/omi/ssl/omikey.pem /etc/opt/microsoft/omsagent/scom/certs/scom-key.pem
    

Create Fluentd configuration file

You configure Fluentd operation using a configuration file. To utilize log monitoring, you must create a configuration file. The configuration file includes information such as source log file name, path, and filters to define the data to collect.

The master Fluentd configuration file omsagent.conf is located in /etc/opt/microsoft/omsagent/scom/conf/. You can add log file monitoring configuration directly to this file, but should create a separate configuration file to better manage the different settings. You then use an @include directive in the master file to include your custom file.

For example, if you created logmonitoring.conf in /etc/opt/microsoft/omsagent/scom/conf/omsagent.d, you would add one of the following lines to the omsagent.d file:

# Include all configuration files
@include omsagent.d/*.conf

or

# Include single configuration file
@include omsagent.d/logmonitoring.conf

For more information on Fluentd configuration files, see Fluentd Configuration file syntax.

The following sections describe settings in different directives of the configuration file that are unique to log file monitoring. Each includes sample settings that you can paste into a configuration file and modify for your requirements.

A complete sample configuration file for log monitoring is available for you to review and evaluate before creating your own.

Source

The Source directive defines the source of the data you're collecting which is where you define the details of your log file. Fluentd picks up each record written to the source and submits an event for it into Fluentd's routing engine. Specify a tag here in this directive. The tag is a string that is used as the directions for Fluentd's internal routing engine to correlate different directives.

The following example shows syslog records collected and tagged for processing by Operations Manager.

<source>

    # Specifies input plugin. Tail is a fluentd input plugin - http://docs.fluentd.org/v0.12/articles/in\_tail
    type tail

    # Specify the log file path. Supports wild cards.
    path /var/log/syslog

    # Recommended so that Fluentd will record the position it last read into this file.
    pos_file /home/user1/fluent-test/demo_syslog.log.pos

    # Used to correlate the directives.
    tag System Center Operations Manager.log.syslog

    format /(?<message>.*)/

</source>

Filter

The filter directive has the same syntax as Match but allows more complex filtering of which data to process. Collected events must match the criteria of all the filters to be added to the output.

There are six filter plugins for log file monitoring described here. Use one or more of these filters to define the events that you want to collect from your log file.

  • Simple match: filter_System Center Operations Manager_simple_match
  • Exclusive match: filter_System Center Operations Manager_excl_match
  • Repeated correlation: filter_System Center Operations Manager_repeated_cor
  • Correlated match: filter_System Center Operations Manager_cor_match
  • Exclusive correlation: filter_System Center Operations Manager_excl_correlation
  • Operations Manager converter: filter_System Center Operations Manager_converter

Select the required tab to copy the code for the respective filter plugin:

Takes up to 20 input patterns. Sends an event to Operations Manager whenever any pattern is matched.

<filter tag>

    type filter_System Center Operations Manager_simple_match
    regexp1 <key> <pattern>
    event_id1 <event ID>
    regexp2 <key> <pattern>
    event_id2 <event ID>
    .
    .
    .
    regexp20 <key> <pattern>
    event_id20 <event ID>
</filter>

Match

The match directive defines how to process events collected from the source with matching tags. Only events with a tag matching the pattern are sent to the output destination. When multiple patterns are listed inside one match tag, events can match any of the listed patterns. The type parameter specifies the type of plugin to use for these events.

This example processes events with tags matching System Center Operations Manager.log. ** and System Center Operations Manager.alert (** matches zero or more tag parts). It specifies the out_System Center Operations Manager plugin, which allows the events to be collected by the Operations Manager management pack.

<match System Center Operations Manager.log.** System Center Operations Manager.event>

    # Output plugin to use
     type out_System Center Operations Manager

    log_level trace
    num_threads 5

    # Size of the buffer chunk. If the top chunk exceeds this limit or the time limit flush_interval, a new empty chunk is pushed to the top of the
    queue and bottom chunk is written out.
    buffer_chunk_limit 5m
    flush_interval 15s

    # Specifies the buffer plugin to use.
    buffer_type file

    # Specifies the file path for buffer. Fluentd must have write access to this directory.
    buffer_path /var/opt/microsoft/omsagent/scom/state/out_System Center Operations Manager_common*.buffer

    # If queue length exceeds the specified limit, events are rejected.
    buffer_queue_limit 10

    # Control the buffer behavior when the queue becomes full: exception, block, drop_oldest_chunk
    buffer_queue_full_action drop_oldest_chunk

    # Number of times Fluentd will attempt to write the chunk if it fails.
    retry_limit 10

    # If the bottom chunk fails to be written out, it will remain in the queue and Fluentd will retry after waiting retry_wait seconds
    retry_wait 30s

    # The retry wait time doubles each time until max_retry_wait.
    max_retry_wait 9m

</match>

Note

To disable Server Authentication on the Linux computers that are using Fluentd communication, add a parameter enable_server_auth false to the Operations Manager plugin for Fluentd, such as the following:

<match System Center Operations Manager.log.** System Center Operations Manager.event>
type out_System Center Operations Manager

max_retry_wait 9m
enable_server_auth false

</match>

Copy configuration file to agent

The Fluentd configuration file must be copied to /etc/opt/microsoft/omsagent/scom/conf/omsagent.d on all Linux computers you want to monitor. You must also add an @include directive in the master configuration file as described above.

Restart omsagent

You can run the following command to restart the omsagent:

/opt/microsoft/omsagent/bin/service_control restart

Check status of System Center Operations Manager Workspace

Run the following command to check the System Center Operations Manager Workspace on the OMSAgent:

sh /opt/microsoft/omsagent/bin/omsadmin.sh -l

Note

On the Management Server running the OMED service, ensure the firewall on port 8886 is open and that the intermediate certificate authorities cert store only contains intermediate certificate authorities.

Event Log for System Center Operations Manager External DataSource Service

The System Center OMED Service event log is created only when there's an event sent successfully to the System Center Operations Manager External DataSource Service (OMED) Service.

Create rules and monitors

The Linux management pack doesn't provide modules to collect events from FluentD, the Linux management pack is bundled with the Linux agent. It's the fluentd module in the Linux agent and the OMED service on the management and gateway server that provides the capabilities for enhanced log file monitoring.

You need to create your own management pack with custom rules and monitors that use the module Microsoft.Linux.OMED.EventDataSource to collect the events from Fluentd. Be aware, the computer name in the Event sent via the System Center OMED Service event log has to match the name of the machine in your UNIX/Linux Computers view. If the computer name doesn't match you won't receive any alert.

The following table lists the parameters of Microsoft.Linux.OMED.EventDataSource.

Parameter Type Description
ComputerName String Required. Specifies the name of the Linux computer for which events are to be read. The ComputerName parameter is most commonly passed to the module by using the $Target notation, although it can be specified as any string. This module attempts to read events generated by the given Linux computer.
ManagedEntityId String Required. Specifies the managed entity ID of monitored entity. The ManagedEntityId parameter is most commonly passed to module by using $Target\Id$.
EventNumber Integer Optional. Indicates the event number of the event to retrieve. If this option is omitted, the module returns all the events generated for that computer and managed entity

Next steps