Monitoring the Health of the Management Group
Important
This version of Operations Manager has reached the end of support. We recommend you to upgrade to Operations Manager 2022.
System Center Operations Manager introduces a new dashboard view that provides a comprehensive picture of the health of your management group. The dashboard tries to answer the question, "do I need to do anything?"
The Management Group Health view under the Operations Manager folder, allows you to see at a glance the health state of all management group functions, such as resource pools, and the management group infrastructure, such as management servers. It also shows you recent agent health state including gray agents, agent configuration for agents pending management, and agent versions.
You can display Management Group Health on a SharePoint site by integrating with Operations Manager, giving all authorized users a useful summary of management group status. For more information, see Using SharePoint to view Operations Manager data.
Management Group Health automatically refreshes every 15 minutes by default. To manually refresh the view, right-click the view and select Refresh. It might take some time before the dashboard starts to show data. The agent data is recalculated every 15 minutes, and not when you refresh the dashboard.
This article describes the specific information that you see in each cell of the Management Group Health dashboard view.
Management Group Functions
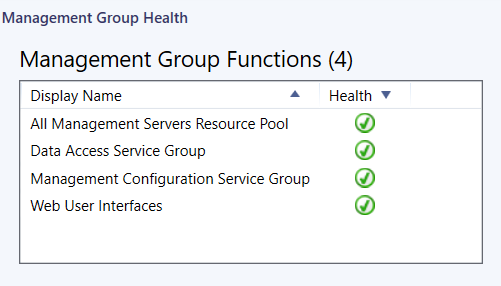
Management Group Functions shows you the health state of any of the following functions that are installed in your management group:
Agentless exception monitoring
Audit collection services
System Center Data Access service group
System Center Management service group
Network discovery
Resource pools
Web user interfaces (web console and reporting web site)
You can open Health Explorer, alert view, diagram view, event view, performance view, and state view for any of the functions listed. To open a different view, right-click the display name for the function, and select Health Explorer or Navigation.
Management Group Infrastructure
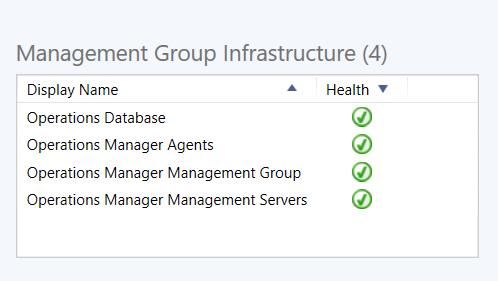
Management Group Infrastructure shows you the health state of any of the following infrastructure features that are installed in your management group:
Operational database
Data warehouse database
Management group
Management servers
Gateway servers
Agents
You can open Health Explorer, alert view, diagram view, event view, performance view, and state view for any of the features listed. To open a different view, right-click the display name for the feature, and select Health Explorer or Navigation.
Active Alerts
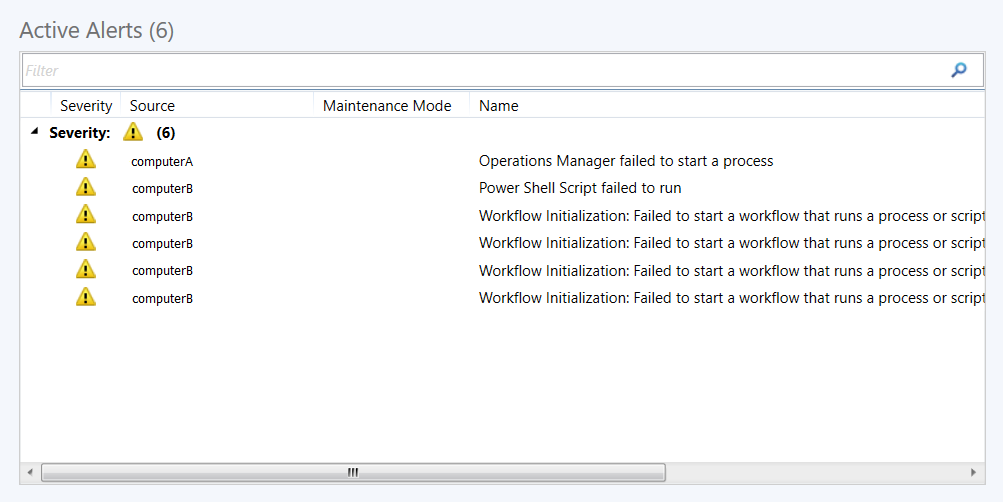
Active Alerts displays all alerts generated by management group components installed in your management group.
Agent Configuration
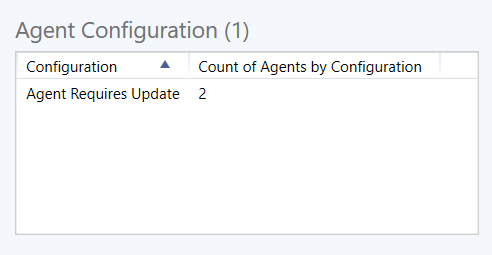
In Agent Configuration, you can see how the status of agents in the Pending Management folder in the Administration workspace. Agents can be pending management for the following reasons:
Manual agent install
Installation in progress
Agent update in progress
Repair in progress
Agent license limit exceeded
Failed agent installation
Agent requires update
Repair failed
Agent Versions
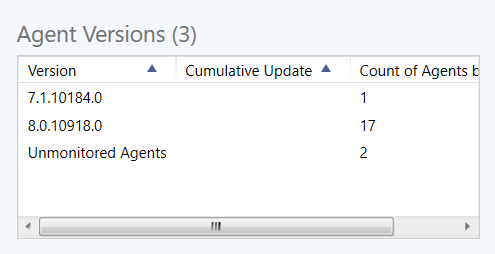
Agent Versions lists the number of agents running each agent version number, including cumulative updates.
Next steps
To understand how to clear the Operations console and agent health service cache, see How to clear the cache.
To understand how it can help you review alerts that have been generated by rules and monitors that are still active, review Viewing Active Alerts and Details.
Feedback
Coming soon: Throughout 2024 we will be phasing out GitHub Issues as the feedback mechanism for content and replacing it with a new feedback system. For more information see: https://aka.ms/ContentUserFeedback.
Submit and view feedback for