Manage telemetry settings in Operations Manager
Important
This version of Operations Manager has reached the end of support. We recommend you to upgrade to Operations Manager 2022.
This article provides information about how to manage the telemetry (Diagnostics and utility data) settings in System Center - Operations Manager.
By default, Operations Manager sends diagnostic and connectivity data to Microsoft. Microsoft uses this data to provide and improve the quality, security, and integrity of Microsoft products and services.
Administrators can turn off this feature at any point of time. Learn more about data collected by Operations Manager.
Turn on/off telemetry from console
In the Operations Manager console, select Settings in the Administration pane.
Under Type: General, double-click Privacy.
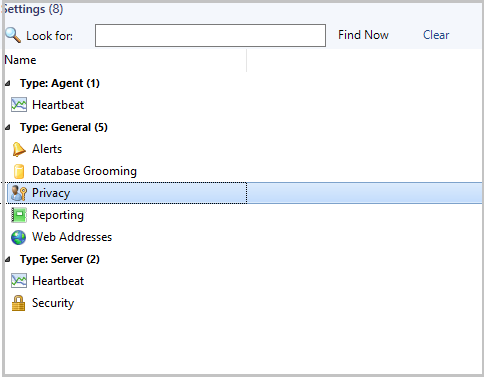
Diagnostic and Usage Data Settings options page appears.
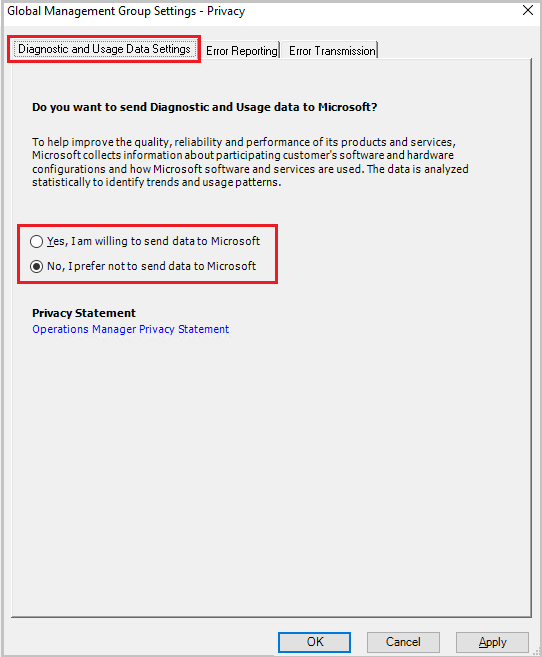
Select the diagnostic and usage data sharing preference from the options displayed, and select OK.
Note
We recommend you to read the Privacy Statement before you select the option.
- To turn on telemetry, select Yes, I am willing to send data to Microsoft.
- To turn off telemetry, select No, I prefer not to send data to Microsoft.
Telemetry data collected
The following table details the telemetry data that is collected by Operations Manager:
| Data related To | Data collected |
|---|---|
| Setup | Version of installed System Center - Operations Manager Version of the installed System Center - Operations Manager update rollup on different System Center - Operations Manager core components System Center - Operations Manager management group identifier (To weed out duplicates) Unique machine identifier Operating system on which different System Center - Operations Manager core components are launched Language of the System Center - Operations Manager installation CPU and memory values of different System Center - Operations Manager servers Number of System Center - Operations Manager web servers installed Is reporting server installed Is ACS installed Number of gateways in the System Center - Operations Manager environment Number of management servers in the System Center - Operations Manager environment Is Operational Insights account set up |
| Device monitoring | Number of Unix/Linux computers monitored Number of Windows computers monitored Number of network devices monitored Unix/Linux flavors monitored Network devices being monitored - their type, model number, and certification status Number of applications for which APM is active Type of workloads for which APM is enabled Number of distributed applications Number of computers on which ACS is implemented Maximum number of concurrent Web console sessions Number of new SSRS reports present Number of uncanned SSRS reports present Frequency of canned reports use Frequency of each PowerShell command use Features used in the administration console Complete Heatmap Report Status |
| Management packs | Number of management packs in the System Center - Operations Manager environment Number of non-Microsoft signed packs Management packs installed/version/manufacturer (Microsoft and Non-Microsoft) Table names and row counts in the operational database Table names and row counts in the data warehouse database Details of partner products installed Details of the Microsoft MP import failures and error involved Details of the Top used management packs deployed with Operations Manager |
| SCOM Console | Time taken for the windows console to launch Time taken for each of the monitoring screens to launch Time taken for each of the administration screens to launch Number of times network vicinity dashboard is launched Number of times the data warehouse jobs are failing Number of times the web console is being launched Number of times the Maintenance mode task and SMM SDK calls are made for create and edit to determine adoption of new feature |
| Updates and recommendations | Number of times the Updates and Recommendations link clicked/refreshed Number of times the online catalog was down while loading Updates and Recommendations view Time taken to load the Updates and Recommendations view Number of workloads in Updates and Recommendations view has Updates available status Number of workloads in Updates and Recommendations view have Not installedstatus Number of workloads in Updates and Recommendations view has Partially installed status Number of workloads shown in Updates and Recommendation Number of times Get MP link is clicked in Updates and Recommendations view Number of times Get All MPs link is clicked in Updates and Recommendations view Number of times View Guide link is clicked in Updates and Recommendations view Workload selected in Get MP call in Updates and Recommendations view Workloads selected in Get All MPs call in Updates and Recommendations view Workload install status in Get MP call in Updates and Recommendations view Workloads install status in Get All MPs call in Updates and Recommendations view Time taken to install workload in Get MP call in Updates and Recommendationsview Time taken to install workloads in Get All MPs call in Updates and Recommendations view Is the installation fresh or upgrade TotalSetuptimeInMinutes Is setup silent Is error reporting enabled Is the Microsoft update true or false Is the setup 64 bit SetupDefaultInstallPath Install result - success or failure |
| Database | Whether the management server installation is fresh or upgrade Whether the database (DB) installation is fresh or upgrade Whether the data warehouse (DW) installation is fresh or upgrade Default DB Name DB Size in MB DB Port Is DB Local DW Port Is DW local Is the SDK service using the local system account Is the agent using the local system account |
| Console Settings | Web console default website Web console authorization mode Web console SSL enabled Count of maintenance schedules Count of active alerts User role Console version If users are enabling daily health report If users are enabling computer discovery If users are discovering entire domain, or the selected one If users are enabling Auto-Select for updates Telemetry on/off notifications Click count on Tune Management Pack View Click count, total days, minimum alert count, and total result set Click count, MP name, alert name, and alert count Click count of View or edit the settings of this monitor Click count of View or override sources Click count, source MP name and override MP name Nano servers count (not applicable for Operations Manager 1801) Alert view click count Health explorer click count on alert view action menu Open command window click count on alert view action menu Start maintenance mode click count on alert view action menu End maintenance mode click count on alert view action menu Edit maintenance mode click count on alert view action menu Time spent on alert view Total number of items displayed on alert view Performance view click count Time spent on performance view State view click count Time spent on state view Total number of items displayed on state view Overrides being used If notification channels & subscriptions are set up Type of notification channels configured |
In addition to the data in the above table, Operations Manager 2016 UR10 also collects the information about the platform the setup is hosted on as part of the data collected under Setup.
Data collected through UTC
- SQL configuration of the System Center - Operations Manager environment (version/SP version/SQL Always ON/Cluster)
- Microsoft alerts that are marked as not useful and the reason
- Number of widgets, views, and dashboards created in Monitoring pane
- Number of dashboards in My Workspace
- Time taken to load the Scheduled Maintenance summary screen
- Average number of entities that are set to maintenance mode through Maintenance mode task and Scheduled Maintenance mode screen
- System Center ID the System Center - Operations Manager environment resides in
- Selected features
HTML5 dashboards data collected through App Insights
- All API exceptions
- User feedback
- Edited widget
- Authored widget
- launched widget
- Action clicked
- Personalized widget
- Instances when action View in Full Screen is clicked
- Dashboard edits
- Instances of drill-down page launch
- Instances of task pane launch
- Instances of My Workspace launch
- Usage of Windows Authentication
- Usage of Alternate Credentials
- Instances of Add to MyWorkspace action
- Count of alerts per widget
- Count of performance legends per widget
- Count of rows per state widget
- Count of icons in topology widget
- Widget count in a dashboard
Next steps
Feedback
Coming soon: Throughout 2024 we will be phasing out GitHub Issues as the feedback mechanism for content and replacing it with a new feedback system. For more information see: https://aka.ms/ContentUserFeedback.
Submit and view feedback for