Note
Access to this page requires authorization. You can try signing in or changing directories.
Access to this page requires authorization. You can try changing directories.
With System Center Operations Manager 2019 and later, you can access SQL Server dashboards using a web browser.
To open web dashboards, perform the following steps:
Navigate to http://localhost/OperationsManager using a web browser.
Open the Monitoring view, navigate to Monitoring > Microsoft SQL Server, and select Summary.
Ensure that you've installed the Web console component.
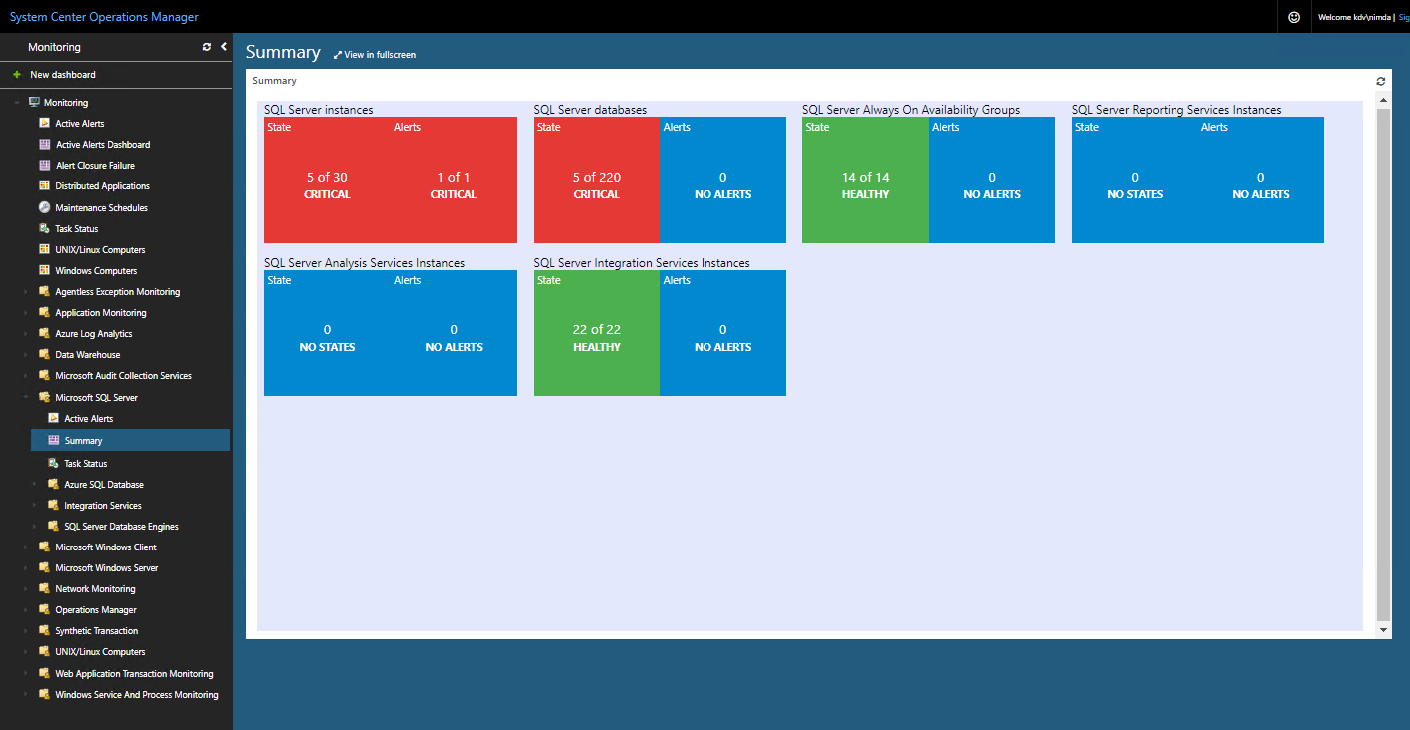
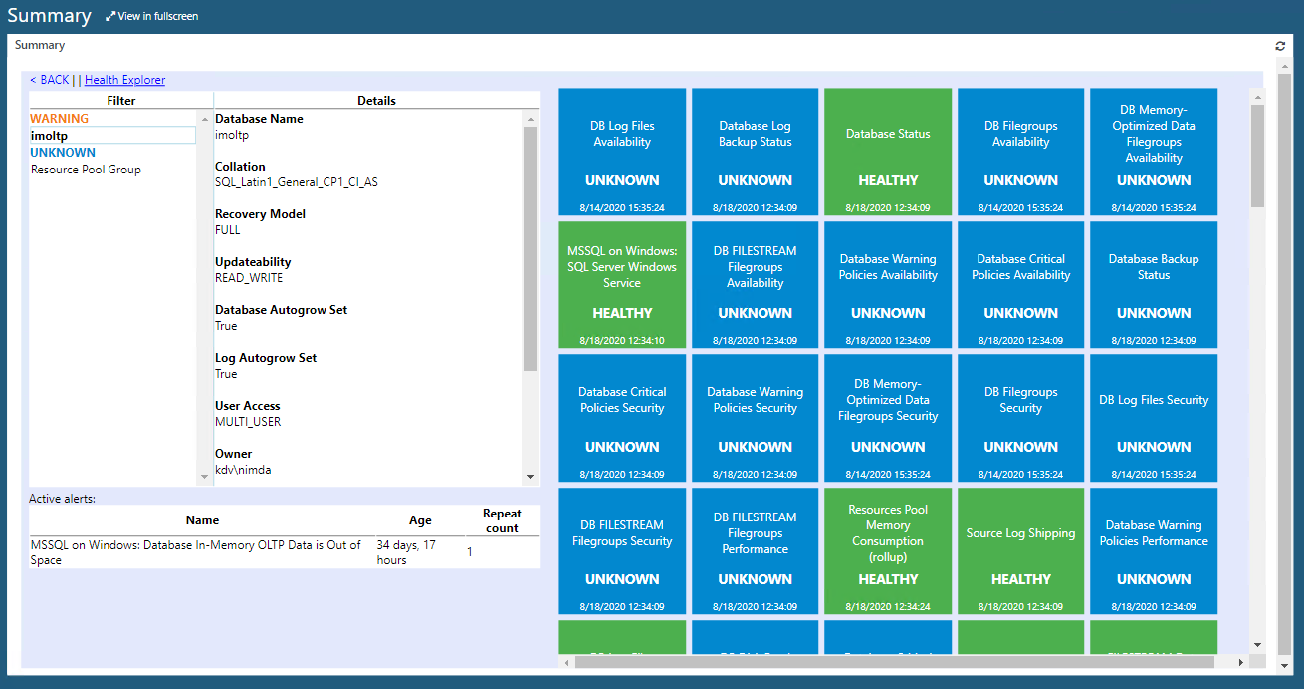
On the Summary page, select a tile to drill down and review detailed information about the state and alerts.
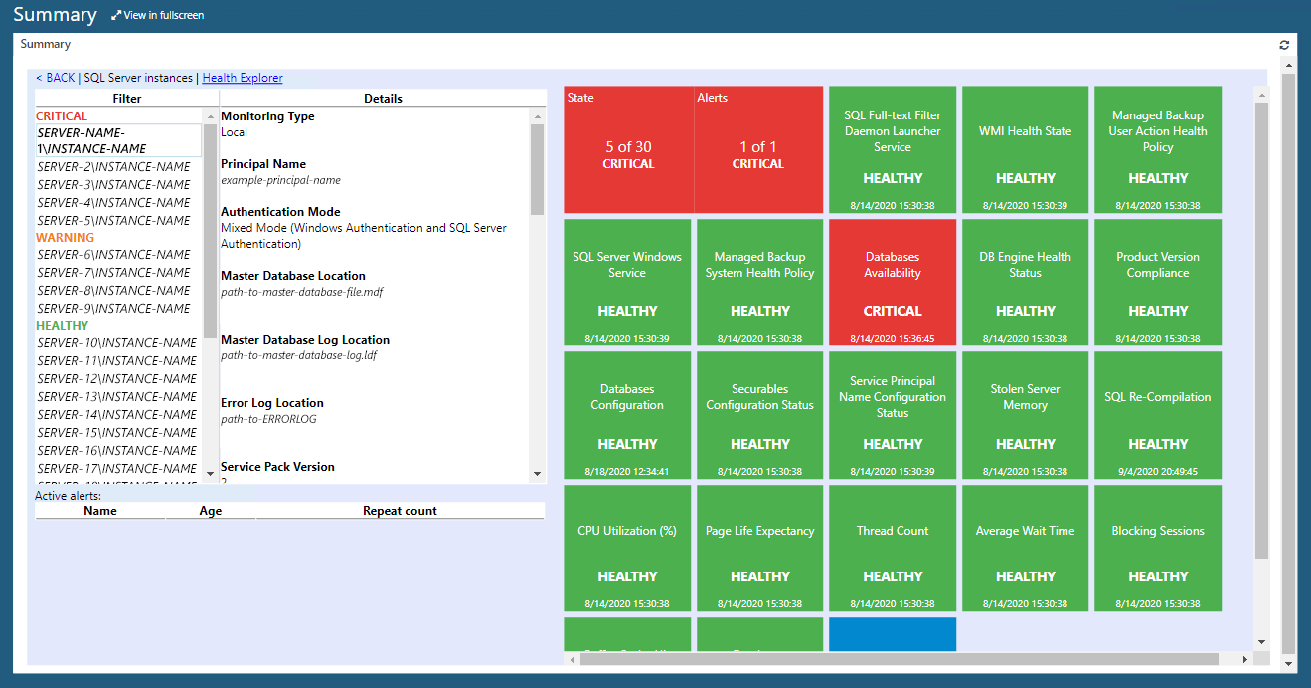
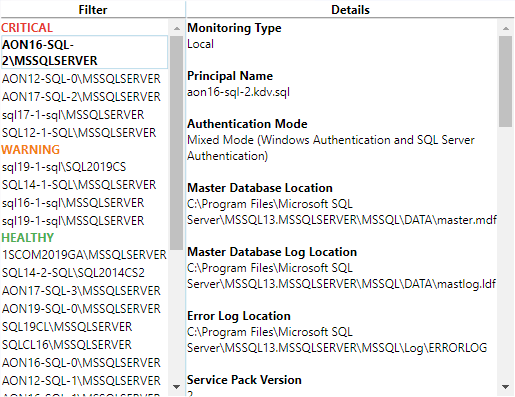
The Filter column in the left pane shows objects that might be in the Critical, Warning, or Healthy state. You can select an object to review its details, such as Monitoring Type, Principal Name, Authentication Mode, and so on, in the Details column.
The right pane consists of tiles that show the health state of various components that belong to the object that you select in the Filter column.
In the right pane, you can select the first tile in the top-left corner that shows State and Alerts to drill down into the health hierarchy even further.

To get back to the previous view, you can select Back. You can also launch Health Explorer.