Note
Access to this page requires authorization. You can try signing in or changing directories.
Access to this page requires authorization. You can try changing directories.
Earth’s oceans are vast and remain mostly unexplored. The marine ecosystems that make up our oceans contain amazing populations of creatures. The existence of these populations depends on complex interactions within food webs and the health of the environments they inhabit. Humans can play a major role in preserving marine ecosystems, but we must understand the impact of our actions.
Meet Kiki and her family
Connect with the J pod population, a close-knit family of 24 endangered Southern Resident orca whales living in the Salish Sea, and specifically Kiki—a six-year-old female who carries the fate of the pod on her shoulders. Explore data related to Kiki and her family that may lead to insights that protect her family, their ecosystem and ultimately us!
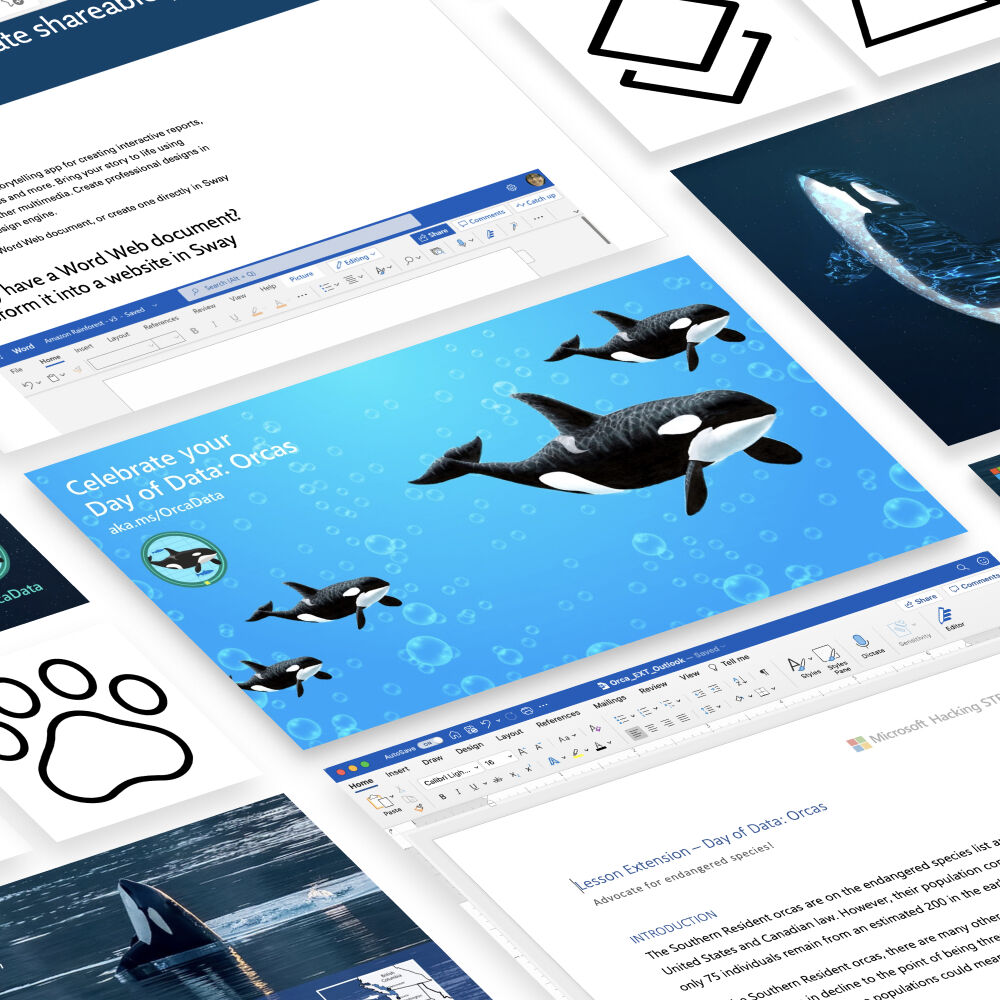
Immerse your students in a fun and interactive data science project as you learn about Kiki and her family in the J pod. Choose from two 50-minute activities that are suited for remote learning, created for teachers by teachers! Your students can swim with Kiki using HoloLens and explore data in a self-paced Excel workbook.
View the student overview video
Lesson 1 - Use data to research
Paddle your way into Kiki's world through a self-paced, online Excel activity that introduces beginning concepts for data-driven research using linked data types.
Age: 11-14 years old
Length: 50 minutes
Lesson highlights:
- Access information in Excel using data types and data cards.
- Compare and contrast taxonomic data to explore differences and similarities of organisms.
- Use data cards to access geographic data related to orca sighting locations.
Learning standards:
- NGSS MS-LS4-2. Apply scientific ideas to construct an explanation for the anatomical similarities and differences among modern organisms and between modern and fossil organisms to infer evolutionary relationships.
- ISTE 5b. Students collect data or identify relevant data sets, use digital tools to analyze them, and represent data in various ways to facilitate problem-solving and decision-making.
Resources:

Lesson 2 - Use data to investigate
Make a splash using data to investigate with a self-paced, online Excel activity that introduces beginning concepts for investigating a phenomenon using data.
Age: 11-14 years old
Length: 50 minutes
Lesson highlights:
- Investigate data to describe feeding relationships in an ecosystem.
- Explore multiple sources of data to explain how toxins can influence the health of populations in an ecosystem.
- Analyze multiple acoustic data to provide evidence for the effects of sound pollution on a population.
Learning standards:
- NGSS MS-LS2-1. Analyze and interpret data to provide evidence for the effects of resource availability on organisms and populations of organisms in an ecosystem.
- NGSS MS-LS2-4. Construct an argument supported by empirical evidence that changes to physical or biological components of an ecosystem affect populations.
- ISTE 5b. Students collect data or identify relevant data sets, use digital tools to analyze them, and represent data in various ways to facilitate problem-solving and decision-making.
Resources:
- View Lesson 2 video overview
- Open Lesson 2 Excel workbook and lesson plan
- Open Lesson 2 PDF lesson plan

The lesson plans are built using these principles
- Relevance. Data Science is one of the fastest growing professions (Bureau of Labor Statistics), every industry needs data analytics – including business in all sectors, healthcare, education, and every form of social programming. Inspiring the advance of NextGen’s data analytics skills is to stimulate reasoning, discourse, and decision-making, ultimately creating a smarter world for us all.
- Equity for All. Multimodal, dynamic, scaffolded instructions support learners at multiple readiness levels and from diverse backgrounds.
- Accessibility. Designed to open doors to student participation in the data science revolution, these lessons are supported on any internet-enabled device. Use a larger screen (laptop or desktop) for the best experience.
- Aligned to Standards. All activities are aligned to key Next Generation Science Standards (NGSS) and International Society for Technology in Education (ISTE) standards.

Continue your learning!
Mix-and-match these orca-themed lesson supplements to create a curriculum tailored to your classroom.
Advocate for endangered species
Many animals around the world are either threatened or endangered, just like the Southern Resident orcas. Choose a threatened or endangered animal in your area and write a persuasive letter to your government or an organization who can help. View the letter lesson plan.
Salish Sea food chains
A food chain tracks one pathway within a food web and shows how energy flows from producer all the way to apex predator. Explore a food chain in the Salish Sea to understand the impact it might have on the declining population of the Southern Resident orcas. View the food chain lesson plan.
Investigate data: noise pollution
In “Lesson 2: Use data to investigate,” you explored reasons why the orca population may be declining. How do we know if underwater noise pollution impacts the behavior of orcas? Use Excel to analyze and interpret real data from a scientific study. View the noise pollution lesson plan.
Learn more about data types in Excel
Do you want to dive deeper into Excel and learn about other subjects using data and data types?
- Create a data type: Create your own data type from a data set by using Power Query.
- Stocks and geography: Use built-in data types like stocks and geography.

Want more?
You can integrate other hands-on STEM projects into your classroom! Try projects such as building a robotic hand, making a battery out of a lemon, or measuring water quality. Visit aka.ms/HackingSTEM to learn more.