Explore built-in analytics and reporting capabilities
Before you configure anything, Dynamics 365 Contact Center ships with a range of dashboards and reports that cover the most common operational needs. Supervisors and service managers can access these directly from Copilot Service workspace without requiring Power BI authoring skills.
The out-of-the-box reports fall into two categories: historical and real-time.
Historical reports
Historical reports aggregate data over time and are useful for identifying trends, comparing periods, and evaluating long-term performance against targets.
| Report | What it covers |
|---|---|
| Customer Service historical analytics | Cases, service representatives, and topic performance. Includes a summary view and detailed breakdowns for each area. |
| Omnichannel historical analytics | Support operations across all channels with KPIs and AI-generated insights. |
| Proactive Outbound | Performance insights for proactive outbound engagements. Must be separately enabled on the Omnichannel historical analytics settings page under Operations > Insights. |
| Bot-Intent | Intent-level bot performance analytics. Must be separately enabled on the Omnichannel historical analytics settings page under Operations > Insights. |
| Knowledge analytics | How service representatives and customers use knowledge articles during issue resolution, including article effectiveness and search term analysis. |
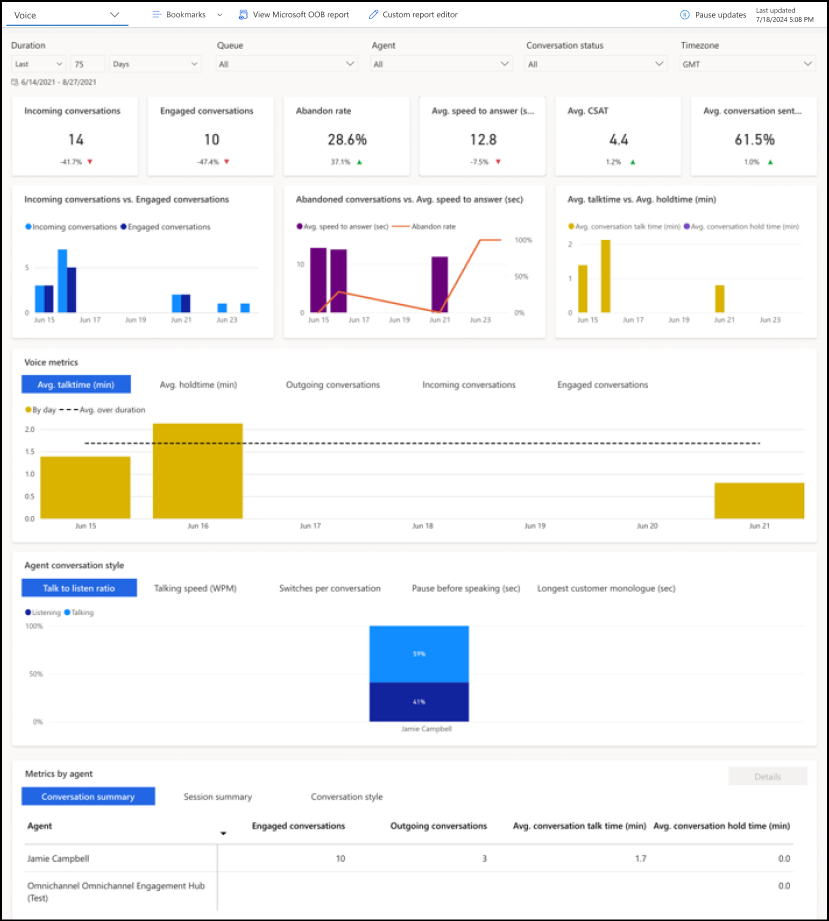
Let's take a look at one example of a historical analytics report: The Voice dashboard. This report is available out-of-the-box.
Real-time reports
Real-time reports reflect the current state of contact center operations and update in near-real time. Supervisors use these to monitor active queues, spot capacity issues, and take action on live conversations.
Omnichannel real-time analytics includes the following reports:
| Report | What it covers |
|---|---|
| Summary | KPIs across interaction volume, service levels, and available capacity in real time. |
| Voice | Conversation overview for the voice channel. |
| Agents | Health and KPIs for service representatives, based on conversation data. Also surfaces idle service representatives to help supervisors rebalance workloads. |
| Ongoing conversation | Active, open, wrap-up, and waiting conversations. Supervisors can monitor, assign, transfer, or close conversations from this view. |
| Backlog conversation | Open, active, and waiting conversations from the last 30 days, including persistent chats longer than 24 hours. |
| Bot | Key metrics for Copilot agents—in-progress and completed AI agent conversation volumes. |
| Intent group | Contact center data organized by intent, intent groups, and line of business. |
| User group | Data filtered by user group to quickly identify trends and assess team performance. |
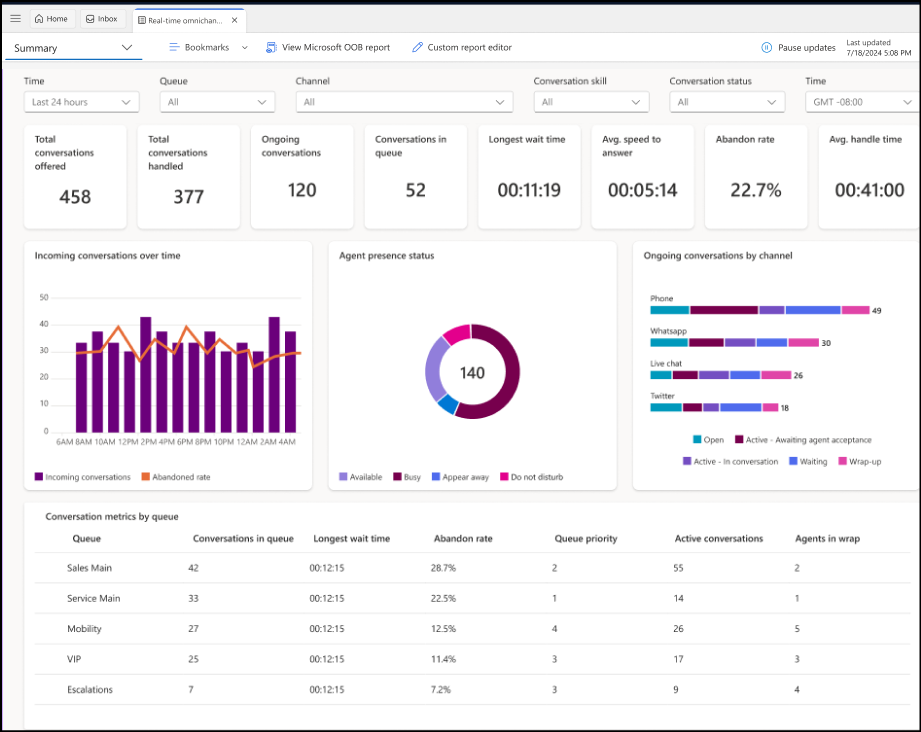
The Summary report in Omnichannel real-time analytics is one example of the real-time analytics reports available out-of-the-box.
Real-time analytics for record routing includes the following reports:
| Report | What it covers |
|---|---|
| Summary | Organization-wide overview in real time. |
| Queue | Case and record work item overview segmented by queue (entity record type queues only). |
| Agent | Health and KPIs for service representatives. |
| Ongoing work items | Cases and records in an active or open state. |
| Backlog work items | Case and record work items modified within the selected time range. |
| Intent group | Work items organized by intent, intent groups, and line of business. |
| User group | Data filtered by user group to spot trends and evaluate team performance. |
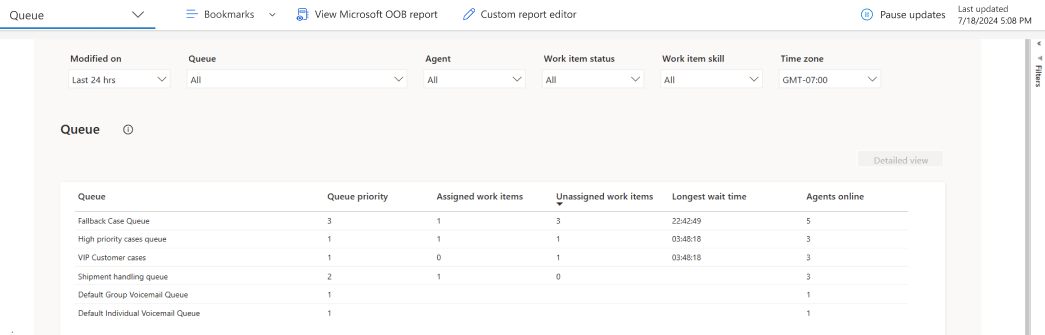
One example is the queue report, which shows case and record work items segmented by queue in real time.
All reports are enabled and configured in Copilot Service admin center under Operations > Insights. Omnichannel real-time analytics are on by default for the following roles: System Administrator, Omnichannel Administrator, Omnichannel Supervisor, Analytics Reports author, and CSR manager. Each report type can be toggled off if needed. Supervisors access reports from Service in the Copilot Service workspace site map.
Filter by time window and business unit
Real-time analytics default to showing data for the last two hours. Supervisors can adjust the time range to 1, 2, 4, 6, or 8 hours, today, or the full 24-hour period, giving a sharper view of current contact center activity without unrelated earlier data. A business unit filter is also available, allowing supervisors to isolate metrics for a specific business unit or compare across units. This filter applies to Omnichannel real-time analytics, Real-time analytics for record routing, Omnichannel historical analytics, and Customer Service historical analytics. The Agents report also surfaces idle service representatives in real time, helping supervisors identify underused capacity and rebalance workloads quickly.
Embed reports in Copilot Service workspace
By default, the dashboards are accessible through the standard navigation in Copilot Service workspace. They're embedded directly in the application, so supervisors don't need to leave the workspace to view them.
Retain the report state across session tabs
When supervisors switch between session tabs in Copilot Service workspace, reports normally retain their current filter and view state. However, if you've customized the Copilot Service workspace app, you need to manually configure the report view to preserve state. For each report you want to retain state for:
- On the Copilot Service workspace app tile, select the three dots (More Options), then select Open in App Designer.
- In Pages, from Navigation, select the report view (for example, Omnichannel real-time analytics view).
- Go to Settings > Display options.
- From the Content type dropdown, select Table.
- From the Table dropdown, select the matching table (for example, Omnichannel Realtime analytics).
- Select Save and Publish.
After completing these steps for a report, its state persists when the supervisor reopens it.
Personalize and customize the visual display
Out-of-the-box reports support several levels of personalization that don't require Power BI authoring access:
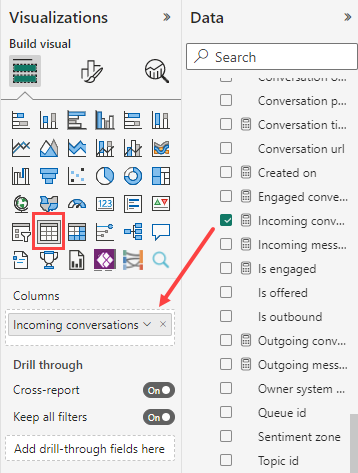
Embedded Power BI editor: Supervisors can use the embedded editor to modify the visual display of a dashboard. Options include resizing or repositioning visuals, changing chart types, and adjusting visual-level filters. (For example, you can show Incoming conversations over time as a table instead of the default bar chart.) Changes made through the embedded editor are saved to the report.
Report filters and groups: Save time by applying and saving one or more filters to a report group so they're applied automatically every time the report opens.
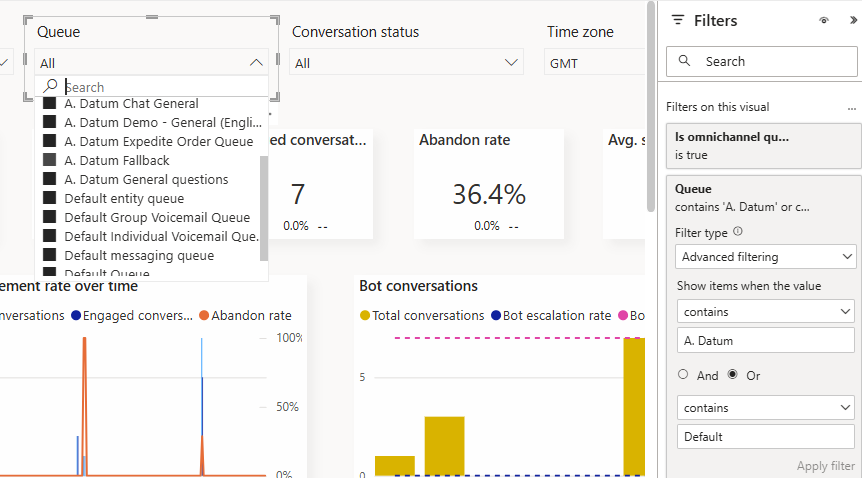
Bookmarks: Bookmarks save the current filter state of a report. Users can create, name, and return to saved bookmarks to view specific data slices without reapplying filters manually. To save bookmarks, users need Create, Read, Write, and Delete privileges on the Report Bookmark custom entity in their security role.
Tip
Encourage supervisors to create bookmarks for their most common views—for example, a bookmark filtered to their team's queues and the current week. This turns a generic dashboard into a daily operational tool without any customization work from an administrator.