Monitor conversation health with Azure Application Insights
Dashboards and reports answer the question "how is the contact center performing?" Conversation diagnostics in Azure Application Insights answers a different question: "what exactly happened in this conversation?" Every routing decision, handoff, and state change during a conversation's lifecycle is logged as a structured event. Operations teams can query these events to diagnose failures, investigate unexpected routing outcomes, and monitor system health without waiting for a support ticket.
The integration works by connecting your Dynamics 365 Contact Center environment to an Azure Application Insights instance. Conversation lifecycle events flow from Dynamics 365 into the Application Insights Traces table, where you can query them with Kusto Query Language (KQL), export them, and combine them with other data to build custom monitoring dashboards.
Note
The conversation diagnostics integration captures routing and lifecycle events, not the conversation content itself. It complements the Omnichannel transcripts and recording features but doesn't replace them.
Prerequisites
Before setting up conversation diagnostics:
- Your Dynamics 365 environment must be a Managed Environment in Power Platform.
- You need a Power Apps, Power Automate, or Dynamics 365 license with premium use rights.
- To create the data export connection, you need Contributor or higher access on the Azure subscription and resource group. To query the data, at least Read access to the Application Insights instance is required.
- To perform tasks like exporting data, you need to be a Power Platform administrator or System Administrator.
- Azure Application Insights charges for ingested data volume. Review Azure Monitor pricing against your expected routing volume before enabling the integration.
Set up the connection with Azure Application Insights
You configure the data export connection in Power Platform admin center, not in Copilot Service admin center. You can only create one data export configuration per Dynamics 365 environment.
- Sign in to Power Platform admin center.
- In the navigation pane, select Manage, then select Data export.
- On the Data export page, select the App Insights tab, then select New data export.
- On the New data exports to Azure Application Insights page:
- Enter a name in Name of the export package.
- Select Dynamics Customer Service.
- Select Next.
- Select the environment you want to export data from. The environment must be a Managed Environment.
- Select Next.
- Specify the Subscription, Resource group, and Application Insights instance where the data should be sent.
- Select Next, review the configuration, then select Create.
The data export appears on the Data export page. After creation, conversation lifecycle events begin flowing to your Application Insights instance.
Query conversation data in Application Insights
Once data is flowing, conversation lifecycle events appear in the Traces table of your Application Insights instance.
To view the events for a specific conversation:
- Sign in to the Azure portal and open your Application Insights instance.
- Select Logs in the Monitoring section.
- Run the following sample query, replacing the placeholder with your conversation ID:
The subscenario field identifies the specific event within the conversation lifecycle—classification, route-to-queue, assignment, handoff, and similar stages. Filtering by subscenario lets you isolate exactly where a routing failure or delay occurred.
Use the built-in Diagnose dashboard
For teams that don't want to write KQL, Dynamics 365 Contact Center includes a built-in Diagnose dashboard that surfaces Application Insights data directly in Copilot Service workspace, no query authoring required.
Supervisors and contact center operators access the Diagnose dashboard from the Omnichannel Realtime analytics or Real-time analytics for record routing view. On the command bar, select Diagnose to open a dedicated debug session.
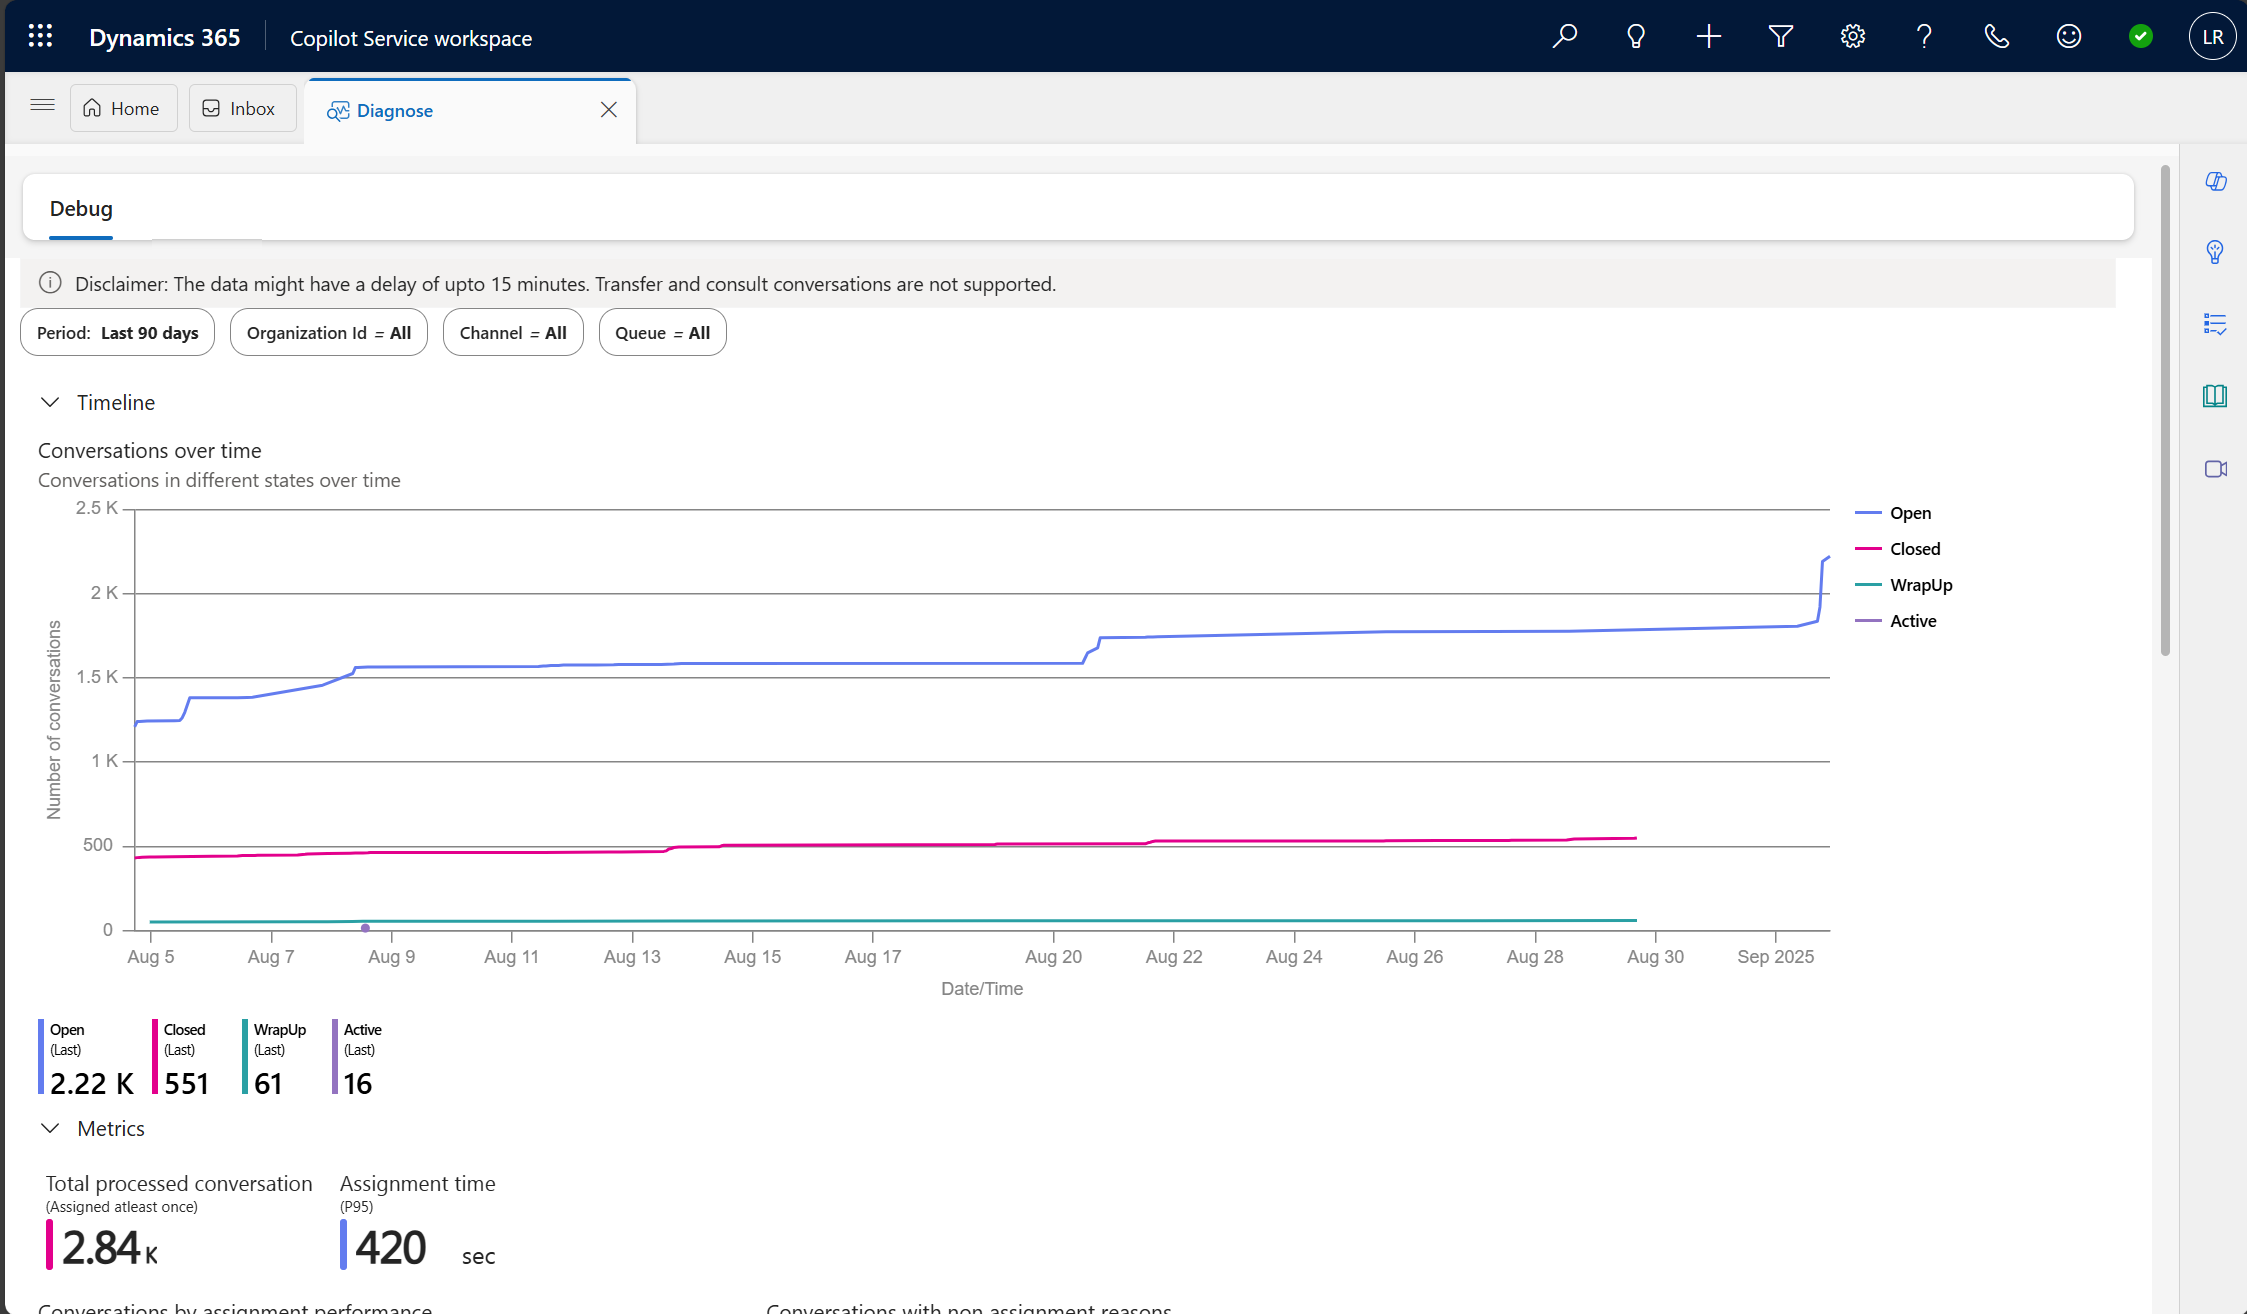
Key capabilities include:
- Conversation trend analysis: Visualize conversation volumes and states over the last 24 hours or a custom time range, filtered by channel and queue.
- Assignment performance: View time to first assignment (P95) and the distribution of conversations by number of assignment events.
- Non-assignment reasons: See why conversations weren't assigned—for example, no eligible service representative found, or the representative rejected the conversation.
- Conversation timeline: Inspect the full lifecycle of a specific conversation, including every routing, assignment, and handoff event in chronological order.
- Service representative details: View a representative's configured skills, capacity profiles, and presence alongside all conversations handled during a time window, with direct comparison against a conversation's requirements.
- Raw event access: Drill into individual Application Insights events for each conversation stage, including the full custom dimensions output.
Note
The Diagnose dashboard supports out-of-the-box assignment methods only. Diagnostics for transfer and consult conversations aren't supported. Data in the dashboard can have a delay of up to 15 minutes.
Enabling the Diagnose dashboard requires a few steps beyond the basic Application Insights data export connection. You need to update the Application Insights instance ID in a Dataverse environment variable and register an app with federated identity credentials. Learn more at Enable Diagnose dashboard.
Build custom dashboards from conversation data
For scenarios that go beyond the built-in Diagnose dashboard, you can combine Application Insights conversation data with other sources to build custom monitoring solutions. The Export option in Application Insights lets you export log data to combine with datasets from other tables, creating unified operational dashboards that span Dynamics 365 routing events, infrastructure telemetry, and any other Azure Monitor data sources.