Exercise - Perform Linear Regression with Scikit Learn
Another popular Python library that is widely used in the research community is scikit-learn, which excels at building machine-learning models to help extract information from data. In this exercise, you will use scikit-learn (which was already imported in Unit 2) to compute a trend line for the NASA climate data.
Place the cursor in the empty cell at the bottom of the notebook. Change the cell type to Markdown and enter "Perform linear regression with scikit-learn" as the text.
Add a Code cell and paste in the following code.
# Pick the Linear Regression model and instantiate it
model = LinearRegression(fit_intercept=True)

# Fit/build the model
model.fit(yearsBase[:, np.newaxis], meanBase)
mean_predicted = model.predict(yearsBase[:, np.newaxis])

# Generate a plot like the one in the previous exercise
plt.scatter(yearsBase, meanBase)
plt.plot(yearsBase, mean_predicted)
plt.title('scatter plot of mean temp difference vs year')
plt.xlabel('years', fontsize=12)
plt.ylabel('mean temp difference', fontsize=12)
plt.show()

print(' y = {0} * x + {1}'.format(model.coef_[0], model.intercept_))
Now run the cell to display a scatter plot with a regression line.
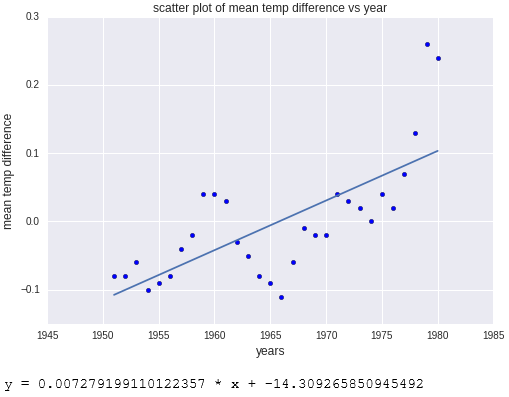
Scatter plot with regression line computed by sckikit-learn
The output is almost identical to the output in the previous exercise. The difference is that scikit-learn did more of the work for you. Specifically, you didn't have to code a line function as you did with NumPy; scikit-learn's LinearRegression function did it for you. scikit-learn supports many different types of regression, which comes in handy when building sophisticated machine-learning models.