Configure predictive sales forecasting
Sales forecasting works best when you have more than one perspective on the pipeline. Seller estimates reflect what the team believes it will close. But a second, independent view based on historical patterns and pipeline analysis gives managers a way to validate those estimates and identify gaps before they become problems.
Predictive forecasting provides that second perspective. When enabled, the Sales Premium license unlocks an AI model that analyzes your historical closed opportunities and current pipeline to generate an independent revenue projection. This prediction sits alongside seller estimates in the forecast grid, giving managers two data points to compare: what the team believes it will close, and what the data suggests it will actually close.
How the AI model works
The predictive model learns from your organization's own history. It analyzes patterns across closed opportunities like win rates, time-to-close, deal characteristics, and pipeline composition. The model then applies those patterns to your open opportunities to produce a projection. Because the model trains on your data, its accuracy improves as your historical record grows.
The model's output appears as a Prediction column in the forecast grid. Predictions are available at every level of the hierarchy: individual sellers, managers, and the overall organization. Each person sees a projection relevant to their scope.
Prerequisites for the predictive model
Before the AI model can generate useful predictions, it needs enough historical data to learn from. Your organization must have:
- More than 10 closed opportunities with values filled in for: Actual Value, Actual Close Date, Estimated Value, and Estimated Close Date
- Open opportunities with Estimated Value and Estimated Close Date populated
- Data that reflects real usage (for example, opportunity created dates that predate their close dates)
- Forecast filters that don't significantly reduce the volume of available historical data
The more complete and consistent your historical data is, the more accurate the model's projections are. Activating predictive opportunity scoring alongside predictive forecasting can also help optimize model accuracy.
Enable the Prediction column
To verify that predictive forecasting is available in your environment, go to Change area > App settings > Forecast configuration. When you configure or edit a forecast, add the Prediction column to the forecast layout. Once the column is added and the forecast is activated, prediction values appear in the grid for each level of the hierarchy.

Note
The Prediction column only appears if your organization meets the data prerequisites. If you enable the column but the prerequisites aren't met, the column displays but values don't populate until sufficient data is available.
Predictions are recalculated automatically every seven days. You can hover over the information icon on the column header to see the date of the last recalculation. Manual recalculation isn't available.
Read the prediction details pane
Select any value in the Prediction column to open the prediction details pane for that seller, manager, or organization level. The pane breaks down the total prediction into three components:
- Closed won: Total actual revenue from opportunities already closed as won during the current forecast period.
- Predicted from open: Estimated revenue from open opportunities the model predicts will close during the period.
- Predicted from new: Estimated revenue from new opportunities the model predicts will emerge and close during the period.
Together these three values add up to the Total prediction shown in the grid.
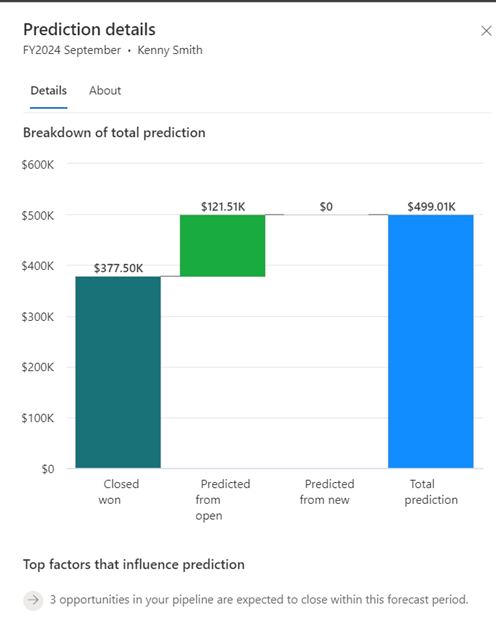
The pane also displays up to five top factors that most influenced the prediction. Each factor is marked with a directional icon: green for a positive influence, red for a negative one, and gray for neutral. These factors help managers understand whether a prediction is driven by strong pipeline health, concerning signals, or a mix of both.
Note
Prediction factors must be enabled by an admin or forecast manager to appear in the details pane. Turn on Enable prediction factors in the forecast's advanced settings.
Understand prediction factors
Predictions are more useful when you understand what's driving them. Turn on Enable prediction factors in your forecast's advanced settings to let users see the reasoning behind each predicted value.
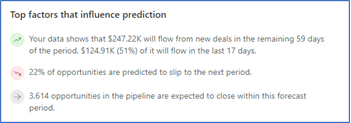
With prediction factors enabled, select any value in the Prediction column to open a details panel. The panel shows the specific factors that most influenced the prediction for that part of the hierarchy (for example, a lower-than-historical win rate for deals in a particular stage, or an above-average number of opportunities with no recent activity).
Predictive forecasting and standard forecasting compared
Predictive forecasting and standard forecasting serve different but complementary purposes, and Dynamics 365 Sales supports both simultaneously.
| Standard forecasting | Predictive forecasting | |
|---|---|---|
| Data source | Seller-entered estimates | Historical closed opportunities + open pipeline |
| Reflects | Team intent and commitment | AI-modeled probability |
| Updated by | Sellers and managers | Automatically by the AI model |
| Best for | Tracking commitments and rollups | Validating estimates and spotting gaps |
When sales teams use them together, they give managers both a view of what the team has committed to and an independent, data-driven projection to compare against it. In the next unit, you build the standard forecast configuration that brings both views into the same grid.