Explore dashboards and reporting tools
Dashboards and reporting tools give you the real-time operational visibility that sellers and managers need every day. These reporting tools show sellers what's open, what's at risk, what closed this week, without having to build a report or export data every time.
Dashboards
Dynamics 365 Sales includes several built-in system dashboards that consolidate common sales KPIs into a single interactive view. These dashboards display charts, lists, and filters covering topics like open opportunities, recent activity, lead conversion, and deals by stage. From Sales Hub, select any dashboard from the dropdown at the top of the screen to switch views. System dashboards are available to all users and require no configuration.
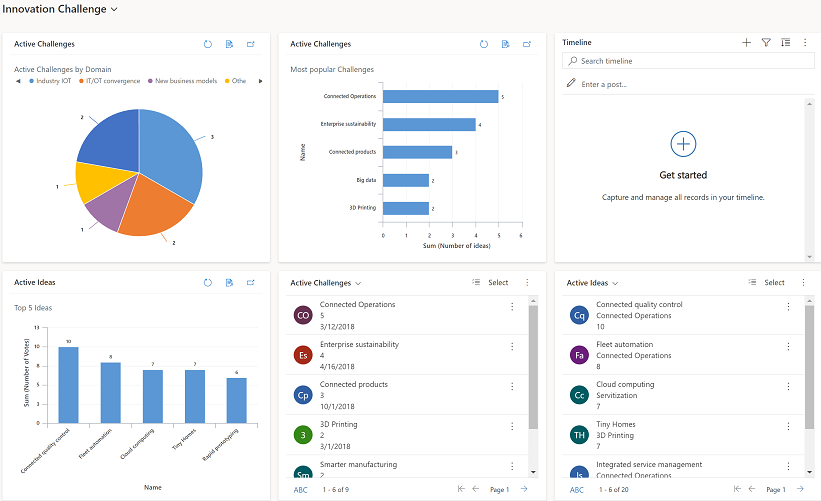
For more personalized visibility, create a personal dashboard that combines the components most relevant to your role. Personal dashboards support the same components as system dashboards—charts, lists, and external web resources—but are visible only to you. To create one, navigate to the dashboards area, select New, and add the charts and views you want to display. Set any dashboard as your default to make it the first thing you see when you open Sales Hub.
Charts
Charts in Dynamics 365 Sales connect directly to the record lists they visualize. Open a list of opportunities, accounts, or leads, then select Show chart to display a chart panel alongside the list. The chart updates dynamically based on the active view and any filters you apply.
Charts support drill-through: select any bar, segment, or data point to filter the list to only the records in that category. For example, selecting the "Proposal/Price Quote" segment in a pipeline-by-stage chart instantly filters the list to show only opportunities in that stage.
Dynamics 365 Sales includes predefined charts for all major record types. Administrators and users can create custom charts and share them with specific users or the entire organization.
Lists and views
Lists and views are the most direct way to work with large sets of records. Every record type—opportunities, leads, accounts, contacts, activities—includes predefined system views with common filters already applied. The My Open Opportunities view, for example, shows only open opportunities owned by the current user, making it a fast starting point for daily pipeline reviews.
Sort and filter within any list view to refine what you see. Users can also create personal views with custom filters and column configurations, saved for repeated use. Administrators can create public views that are shared with all users in the organization.
Advanced Find
For complex analysis involving multiple record types or nonstandard filter conditions, Advanced Find provides a flexible query builder. You can combine filters across related records—for example, opportunities linked to accounts in a specific industry with a close date in the next 90 days and no activity in the last 30 days.
Save the results of an Advanced Find query as a personal view, or export them to Excel for further analysis.
Tip
Save frequently used Advanced Find queries as personal views so you can reuse them without rebuilding the query each time.
Excel export and templates
When you need analysis beyond what dashboards and charts provide, export data to Excel directly from any list view. Dynamics 365 Sales supports three export options:
- Static worksheet: A one-time snapshot of the current records exported to a standard Excel file.
- Dynamic worksheet: A live-connected spreadsheet that refreshes from Dynamics 365 when you open it.
- Dynamic PivotTable: A dynamic Excel PivotTable connected to your Dynamics 365 data, designed for exploratory analysis and custom aggregations.
You can also build and share Excel templates: custom Excel workbooks with preconfigured layouts, PivotTables, and charts that users can download from within the application. To create a template, export data from a list, customize the workbook in Excel, then upload it back to Dynamics 365 via Excel Templates > Upload Template. The template becomes available to all users from the same menu.
Power BI
For organizations that need richer interactive reporting, Dynamics 365 Sales integrates with Microsoft Power BI. Administrators can embed Power BI dashboards directly in the Sales Hub interface, making reports accessible to users without requiring them to switch applications.
Power BI uses your Dynamics 365 data as a source, so reports are built on the same data that drives your forecasts and dashboards. Users with appropriate Power BI licenses can view embedded reports, interact with filters and slicers, and drill into details, all from within Sales Hub.
With real-time visibility from dashboards and reporting tools in place, the final piece of your analytics setup is connecting that performance data to targets. In the next unit, you configure sales goals that give your team clear, measurable benchmarks to track progress against.