Power BI and Power Platform
You can use Power BI with the other components of Microsoft Power Platform.
You can:
Consume Power BI content in PowerBI.com.
Consume Power BI content from Power BI mobile and Power BI data alerts.
Embed Power BI content in Power Apps and Microsoft Teams.
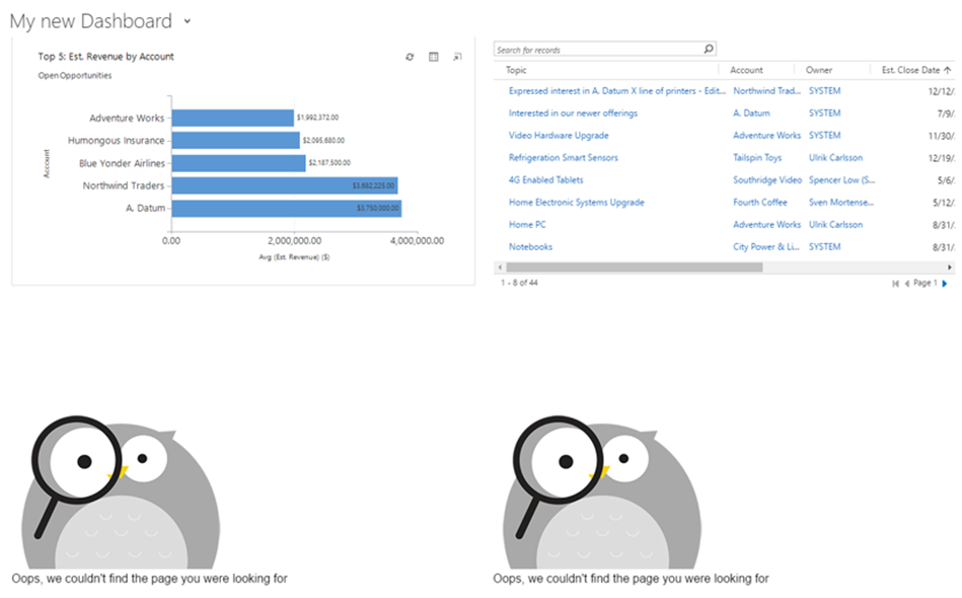
To embed Power BI in a model-driven app, an administrator must first enable Power BI visualization embedding for the environment. You can add an entire Power BI dashboard to a model-driven app, or you can add a tile from a Power BI dashboard to a Dataverse dashboard. To add a Power BI dashboard or tile, select the workspace, dashboard, and tile.
You must share the Power BI dashboard with the users of the model-driven app. If you don't share the Power BI dashboard, the user sees errors, as shown in the following screenshot.
Note
You can add Power BI dashboards and tiles to system dashboards and user dashboards.
To embed a Power BI tile in a canvas app, add the Power BI control to the screen and then select the workspace, dashboard, and tile, as shown in the following screenshot.
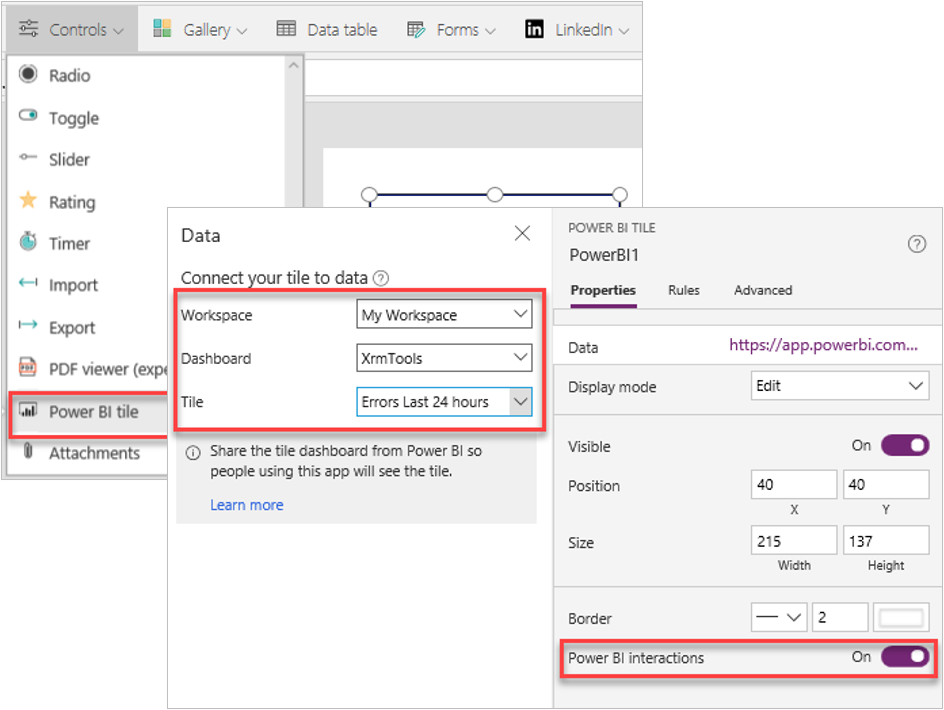
You must share the Power BI dashboard that the tile is from with the users of the canvas app. If you don't share the Power BI dashboard, users see an error.
We don't recommend that you load more than three Power BI tiles at the same time within an app. The LoadPowerBIContent property controls the loading of Power BI content. When this property is set to true, the Power BI content is loaded and shown. When the property is set to false, the Power BI content is unloaded, which releases memory and optimizes performance.
You can pass a parameter of type string to the Power BI tile from the canvas app by modifying the TileURL property and appending.
&$filter=<TableName>/<ColumnName> eq '<Value>'
This action allows you to filter the tile by a value in the canvas app.
You can embed a canvas app within a Power BI report. The canvas app can interact with the other visuals in the report. You can add a Power Apps visual to the report. The canvas app uses the PowerBIIntegration object to integrate the canvas app with Power BI.
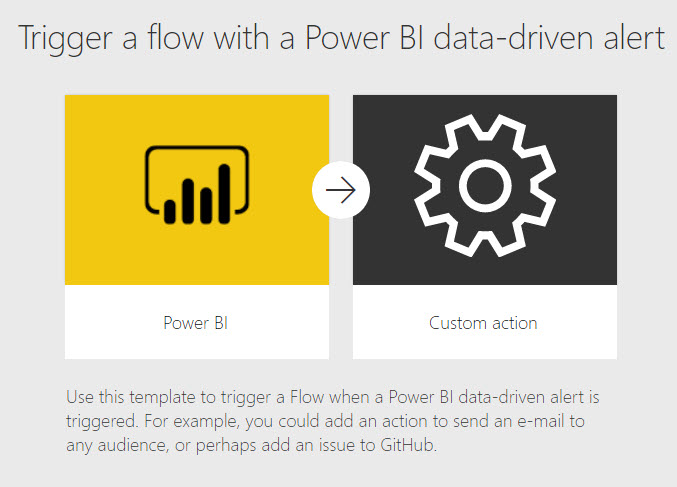
Alerts and Power Automate
Power BI alerts can trigger Power Automate cloud flows. Power BI alerts are rules that trigger an alert when a value exceeds a threshold value. You must first create the Power BI alert, then link a Power Automate cloud flow to the Power BI alert.
Power Automate visual
The Power Automate visual allows a report author to add a button to a Power BI report that can trigger a Power Automate cloud flow.