Common data challenges and Power Query transformations
A common example of exported data that needs cleanup would be files that summarize data that includes empty or blank rows.
Blank or empty rows
When you bring this type of dataset into Power Query, the values for these blank or empty cells display as nulls.

If you hover over the status bar below your column header, the Column Profiling status bar shows information related to the column's data. In the following example, the column contains 45 empty values, indicating that 90 percent of the records contain blank values for the Region column. The user can fill up or down on a column (or multiple columns at the same time), depending on where the subtotals are showing up.

If taking this action on multiple columns, you first select the column headers that you want to update by pressing the Ctrl key while left-clicking each column that you want. With your columns selected, right-click the headers to see the column menu editing options. Select Fill and then choose whether to apply the value down or up. Selecting the Down option is equivalent to finding a non-blank value and then copying it into every blank cell until a new value is found; selecting the Up option is the reverse.

Note
The Fill > Up/Down options rely on the order of the data. Some database import functions stream data asynchronously, meaning that the order of the data might not be consistent.
Crosstab formatting
Tables with crosstab formats (for example, region or product row headers and date period column headers) are common for spreadsheets and reports. Visually, crosstab formats organize the data in a way that's easier for most people to understand and absorb the information. While this format might be beneficial for users, it's not ideal for data modeling. Power Query has tools for unpivoting data to transpose it from a short and wide table to long and narrow. Long and narrow datasets are more favorable for creating measures for a data model.
The Unpivot functionality introduces a key concept within Power Query functions about how to select the columns on which to perform an operation, whether it's on the selected columns only or on unselected columns. It's up to the author to determine which method is appropriate to the dataset and situation. After you import your dataset, select the columns with row headers. Go to the Transform tab on the ribbon, select the dropdown list for Unpivot columns, then select Unpivot other columns. This process generates an attribute and a value column that you can rename by double-clicking the column header.

Clean and format data
The home menu has UI buttons that include the common data cleaning techniques, as shown in the following screenshot.

The following image is an example of the Split Column function (which is similar to Text to Columns in Excel).
To split columns, follow these steps:
Select the column that you want to split.
Select the Split Column dropdown list.
Select By Delimiter > Custom, and then enter a forward slash (/).
Select OK.

Enrich your data
Power Query allows you to add supplemental fields to enable deeper analysis. The Add Column menu includes various ways to enhance your current dataset. When you use the button operations on the Add Column menu, the results of the operation are added as a new column in the data Preview area of the Power Query editor window.
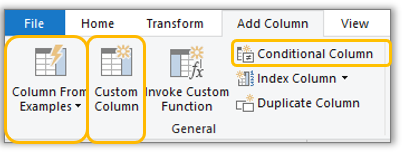
With the Column From Examples feature, you can add new columns to your data model by providing one or more example values for the new columns. You can create the new column examples from a selection or provide input based on all existing columns in the table.
Practical reasons for choosing this feature are that it's:
User-friendly: You only need to enter a few examples of what the result should be, and Power Query does the rest of the work for you.
Quick: Even if you know how to write the transformations, entering a few examples is faster than developing and testing the logic for your text manipulations.
The Add Conditional Column feature allows you to define the IF-THEN-ELSE conditions to display values for a given column based on a series of logical checks with a user-friendly wizard, no parenthesis management required.

With the Custom Column feature, you can directly write an M expression to create a new column. This option is beneficial for more complex additions that go beyond text manipulation in a Column From Examples or a simple Conditional Column. With this feature, you can take advantage of M functions that aren't accessible from the ribbon, take advantage of rich intelligence, and let your creativity flow.

Note
Each button selection in Power Query editor creates an M expression as a step in the Applied Step in the Query Settings pane. M is the formula language of Power Query editor. While it's not required to learn the M formula language to use Power Query, it can be powerful and helpful to learn.