Use debugging to identify issues
Use debugging to identify issues
A faster function is useful only if it returns the correct result. When an optimized function returns the wrong output, reading the code doesn't always show why. The debugger in Visual Studio Code pauses a running program so that you can inspect its state and step through it one line at a time.
Understand a function that returns the wrong result
Suppose a developer replaces the slow nested-loop find_duplicates function from the code-efficiency unit with a faster one that uses a set. The new function should return each number that appears more than once. For the following list, it should return [4, 7], but it returns something else:
# Find the numbers that appear more than once
def find_duplicates_fast(numbers):
    seen = set()
    duplicates = []
    for number in numbers[1:]:
        if number in seen:
            duplicates.append(number)
        seen.add(number)
    return duplicates


data = [4, 7, 4, 9, 7]
result = find_duplicates_fast(data)
print(result)
[7]
The number 4 appears twice, but the function doesn't report it. The debugger can show why.
Pause the program with a breakpoint
A breakpoint pauses the program before it runs a specific line. A good place for a breakpoint is the first line that you want to inspect, such as the first line inside a loop. For this function, that's line 6, if number in seen:.
You set a breakpoint by selecting the editor margin to the left of a line number, or by placing the cursor on the line and pressing F9. A red circle in the margin marks the breakpoint. Selecting the circle again, or pressing F9 again, removes it.
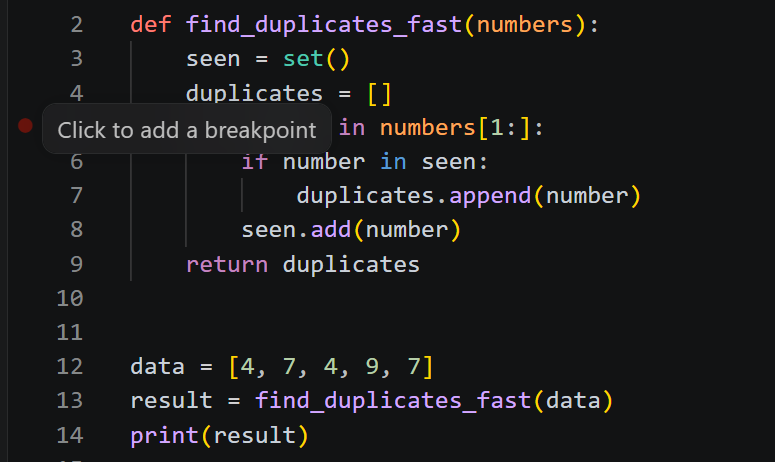
The circle in the margin shows the breakpoint's state:

| Appearance | Meaning |
|---|---|
| Filled red circle | An enabled breakpoint. |
| Filled gray circle | A disabled breakpoint. |
| Hollow gray circle | The debugger can't stop on that line, for example because the line has no executable code. |
The Breakpoints section of the Run and Debug view lists every breakpoint. It's also where you enable, disable, edit, or remove them.
Run the program in the debugger
To start a debugging session, you use the arrow next to the Run button at the upper right of the editor and choose Python Debugger: Debug Python File. You can also press F5. If VS Code asks for a debug configuration, Python File runs the file that's open in the editor.
The program runs until it reaches the breakpoint and then pauses. The highlighted line is the next line to run, and it hasn't run yet. At that point, the Run and Debug view shows the program's state, and the Debug toolbar appears.
Control execution with the debug toolbar
The Debug toolbar controls a paused program. It appears at the top of the editor while a debugging session is active.
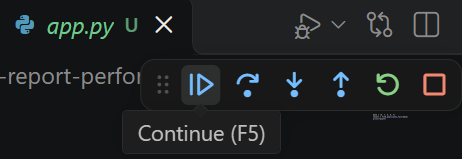
From left to right, the buttons are Continue, Step Over, Step Into, Step Out, Restart, and Stop. Each one also has a keyboard shortcut:
| Action | Shortcut | What it does |
|---|---|---|
| Continue | F5 | Runs until the next breakpoint, or to the end of the program. |
| Step Over | F10 | Runs the current line without entering any function that the line calls. |
| Step Into | F11 | Enters the function that the current line calls. |
| Step Out | Shift+F11 | Finishes the current function and pauses in the code that called it. |
| Restart | Ctrl+Shift+F5 | Stops the program and starts it again. |
| Stop | Shift+F5 | Ends the debugging session. |
Stepping is how you follow the program's logic. Each Step Over runs one line and pauses again, so you can check the program's state after every line.
Inspect variable values
While the program is paused, you can inspect its state in four places.
Variables and watch
The Variables section of the Run and Debug view lists the variables that exist at the current line. The Locals group contains the variables of the current function, and the Globals group contains the variables of the module. Lists, sets, and other collections have an arrow that expands to show their items.
The Watch section evaluates expressions that you add with the + button. VS Code evaluates them again every time the program pauses.
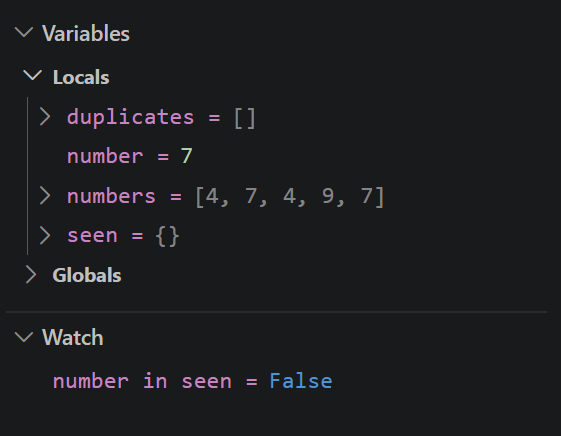
In the screenshot, the program is paused at the breakpoint for the first time:
numberis7, but the first item innumbersis4.seenandduplicatesare empty.- The watch expression
number in seenisFalse.
The first value the loop uses is 7, which means that the loop skipped the first item in the list.
Hover and debug console
Hovering over a variable in the editor shows its current value in a tooltip.
The Debug Console evaluates any expression that you enter at its prompt. It's available from the panel at the bottom of the window, next to the Terminal tab. The console is useful for checking a guess without changing the code.
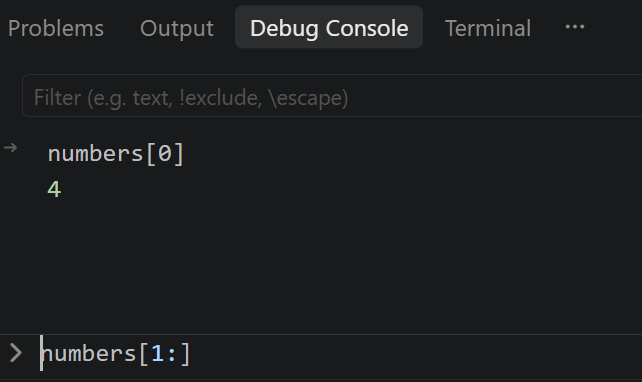
For example, entering numbers[0] in the Debug Console returns 4, which confirms the first item. The expression numbers[1:] should return [7, 4, 9, 7].
See how stepping reveals the cause
Stepping advances a paused program one line at a time. If a developer steps through the loop and watches the Variables section, the values show what happens to each item:
- First item:
numberis7. After line 8 runs,seenis{7}. - Second item:
numberis4, andseenis still{7}.
The list starts with 4, but the loop's first item is 7. The first 4 was never processed, so seen doesn't contain it. When the second 4 arrives, the check 4 in seen is false, and the function doesn't report a duplicate.
The cause is numbers[1:] on line 5, which starts at the second item.
Confirm the fix
With the cause identified, the developer ends the debugging session with Stop (Shift+F5) and changes line 5 to loop over all the items:
for number in numbers:
The program now returns the correct result:
[4, 7]
Pause only when it matters
Stepping through a loop with thousands of items takes too long. Other breakpoint types pause or report only when it's useful:
- Conditional breakpoint: Pauses only when an expression is true, such as
number in seen. You add one by right-clicking the margin and selecting Add Conditional Breakpoint. The same menu lets you enter a hit count instead, which pauses after the line runs a specified number of times. - Logpoint: Writes a message to the Debug Console each time the line runs, without pausing the program. You add one by right-clicking the margin and selecting Add Logpoint. The message can include variables in braces, such as
number={number}, seen={seen}.
For the function with the bug, that logpoint writes these messages:
number=7, seen=set()
number=4, seen={7}
number=9, seen={4, 7}
number=7, seen={9, 4, 7}
The messages show that the first 4 is missing from the loop. The conditional breakpoint number in seen pauses only once, for the final 7. With the fix, it also pauses for the second 4.
Read the call stack
The Call Stack section of the Run and Debug view shows the chain of function calls that led to the current line. In this example, the module called find_duplicates_fast. Selecting a function in the call stack shows that function's variables. This helps when a function is called from many places and you need to know which call caused the problem.
Follow the debugging workflow
The debugging workflow follows the same steps each time:
- Reproduce the problem. Use a small input that returns a wrong result.
- Form a guess. Decide which part of the code might cause it.
- Set a breakpoint. Place it just before the suspected problem.
- Inspect and step. Compare the variable values with what you expect.
- Fix and verify. Change the code, and then run it again to confirm the result.
When you optimize code, compare the output of the new version with the output of the original before you trust its timing. A function that's fast but wrong doesn't improve the program.