Exercise: Deconstruct a Playwright Test
Let's now dive deeper into the Playwright Test Specification and Configuration. Open the project we created in the previous section in your favorite code editor (we recommend Visual Studio Code, which is what we're using in this module) and explore the files that Playwright installed.
Understanding test configuration
Let's start by learning about Playwright test configuration.
- The
playwright.config.tsfile defines the default Test Runner configuration. - The TestConfig API describes the available configuration properties for customization.
- The Playwright Test CLI lets you override the config properties or file location at runtime.
Let's see what the default configuration file provided by Playwright (on first setup) looks like. The following playwright.config.ts snippet is simplified for clarity:
import { defineConfig, devices } from '@playwright/test';

export default defineConfig({
  testDir: './tests',
  fullyParallel: true,
  forbidOnly: !!process.env.CI,
  retries: process.env.CI ? 2 : 0,
  workers: process.env.CI ? 1 : undefined,
  reporter: 'html',

  use: {
    trace: 'on-first-retry',
  },

  projects: [
    {
      name: 'chromium',
      use: { ...devices['Desktop Chrome'] },
    },

    {
      name: 'firefox',
      use: { ...devices['Desktop Firefox'] },
    },

    {
      name: 'webkit',
      use: { ...devices['Desktop Safari'] },
    },
  ],
});
We can refer to the Basic Configuration documentation to understand what this code does:
testDir: Top-level directory to scan recursively for test files.fullyParallel: Decide if all tests in all files should run in parallel.forbidOnly: Exit with error iftest.onlyis used (for example, useful on CI).retries: Max number of retries per test (useful for web-first assertions).workers: Max number of concurrent worker processes (for parallelizing tests).reporter: Select from available reporter options (built-in and custom).use: Set global options for all tests (can be overridden at project or test scope).projects: Run tests in multiple configurations (browsers, emulators, options).
Run the demo todo app tests
The tests-examples folder contains tests for a demo todo app. First, copy that spec file (demo-todo-app.spec.ts) and paste it into your tests folder.
Run your tests:
npx playwright test
This time, Playwright will run tests from both spec files in our tests folder.
Running 78 tests using 5 workers
  78 passed (15.4s)

To open last HTML report run:
  npx playwright show-report
Wow, that's several tests. To see what happened, let's open the HTML report.
npx playwright show-report
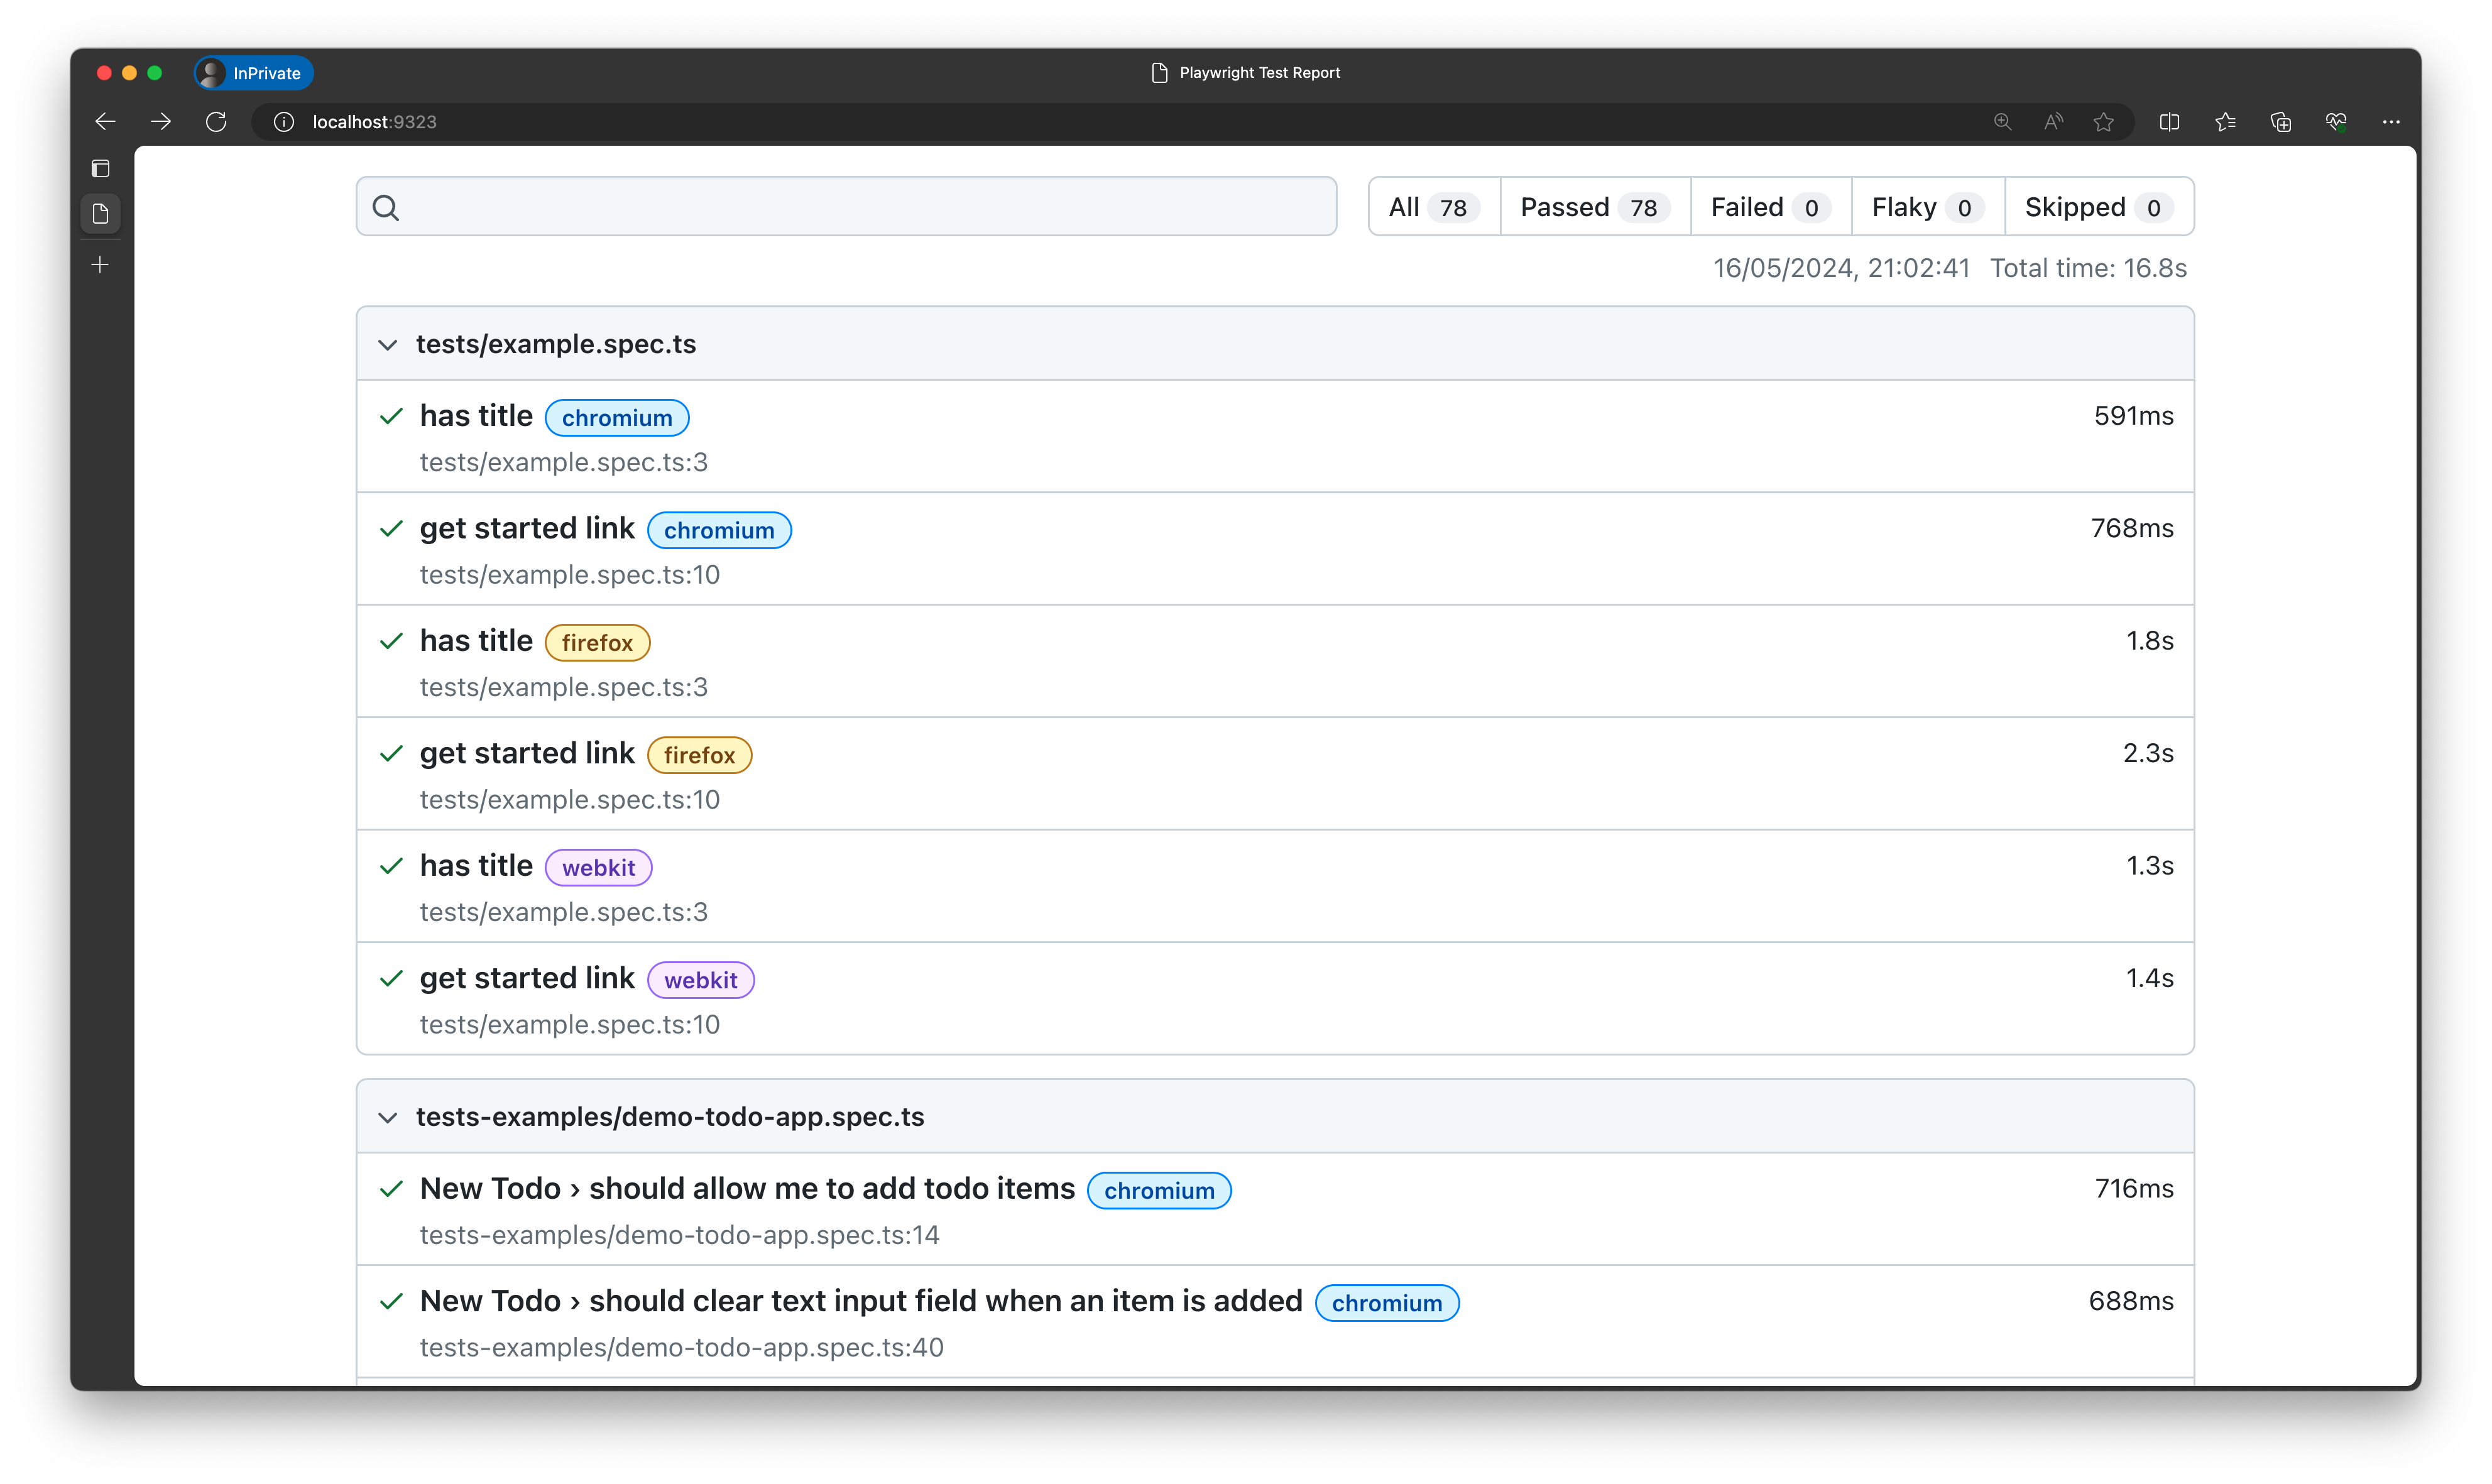
The report tells us that all tests were run on the three different browser engines: Chromium, Firefox, and Webkit.
You can remove the demo-todo-app.spec.ts file from your tests folder.
Configure projects
A project is a group of tests that run with the same configuration and can be used to run tests on different browsers and devices. In the last section, we learned how to run a test on the Chromium browser by adding the -- project option after the test command in the CLI.
Projects are defined in the projects array in the configuration file. By default, Playwright comes with three projects already defined: chromium, firefox, and webkit. This is why our tests ran on all three browsers.
Each project has a name property and a use property. The use option defines what the project should use. For example, the Desktop Chrome device for the chromium project.
  projects: [
    {
      name: 'chromium',
      use: { ...devices['Desktop Chrome'] },
    },
  ],
In the playwright.config.ts file in your learn-playwright directory, comment out the other projects and leave only the chromium project, then run the tests.
npx playwright test
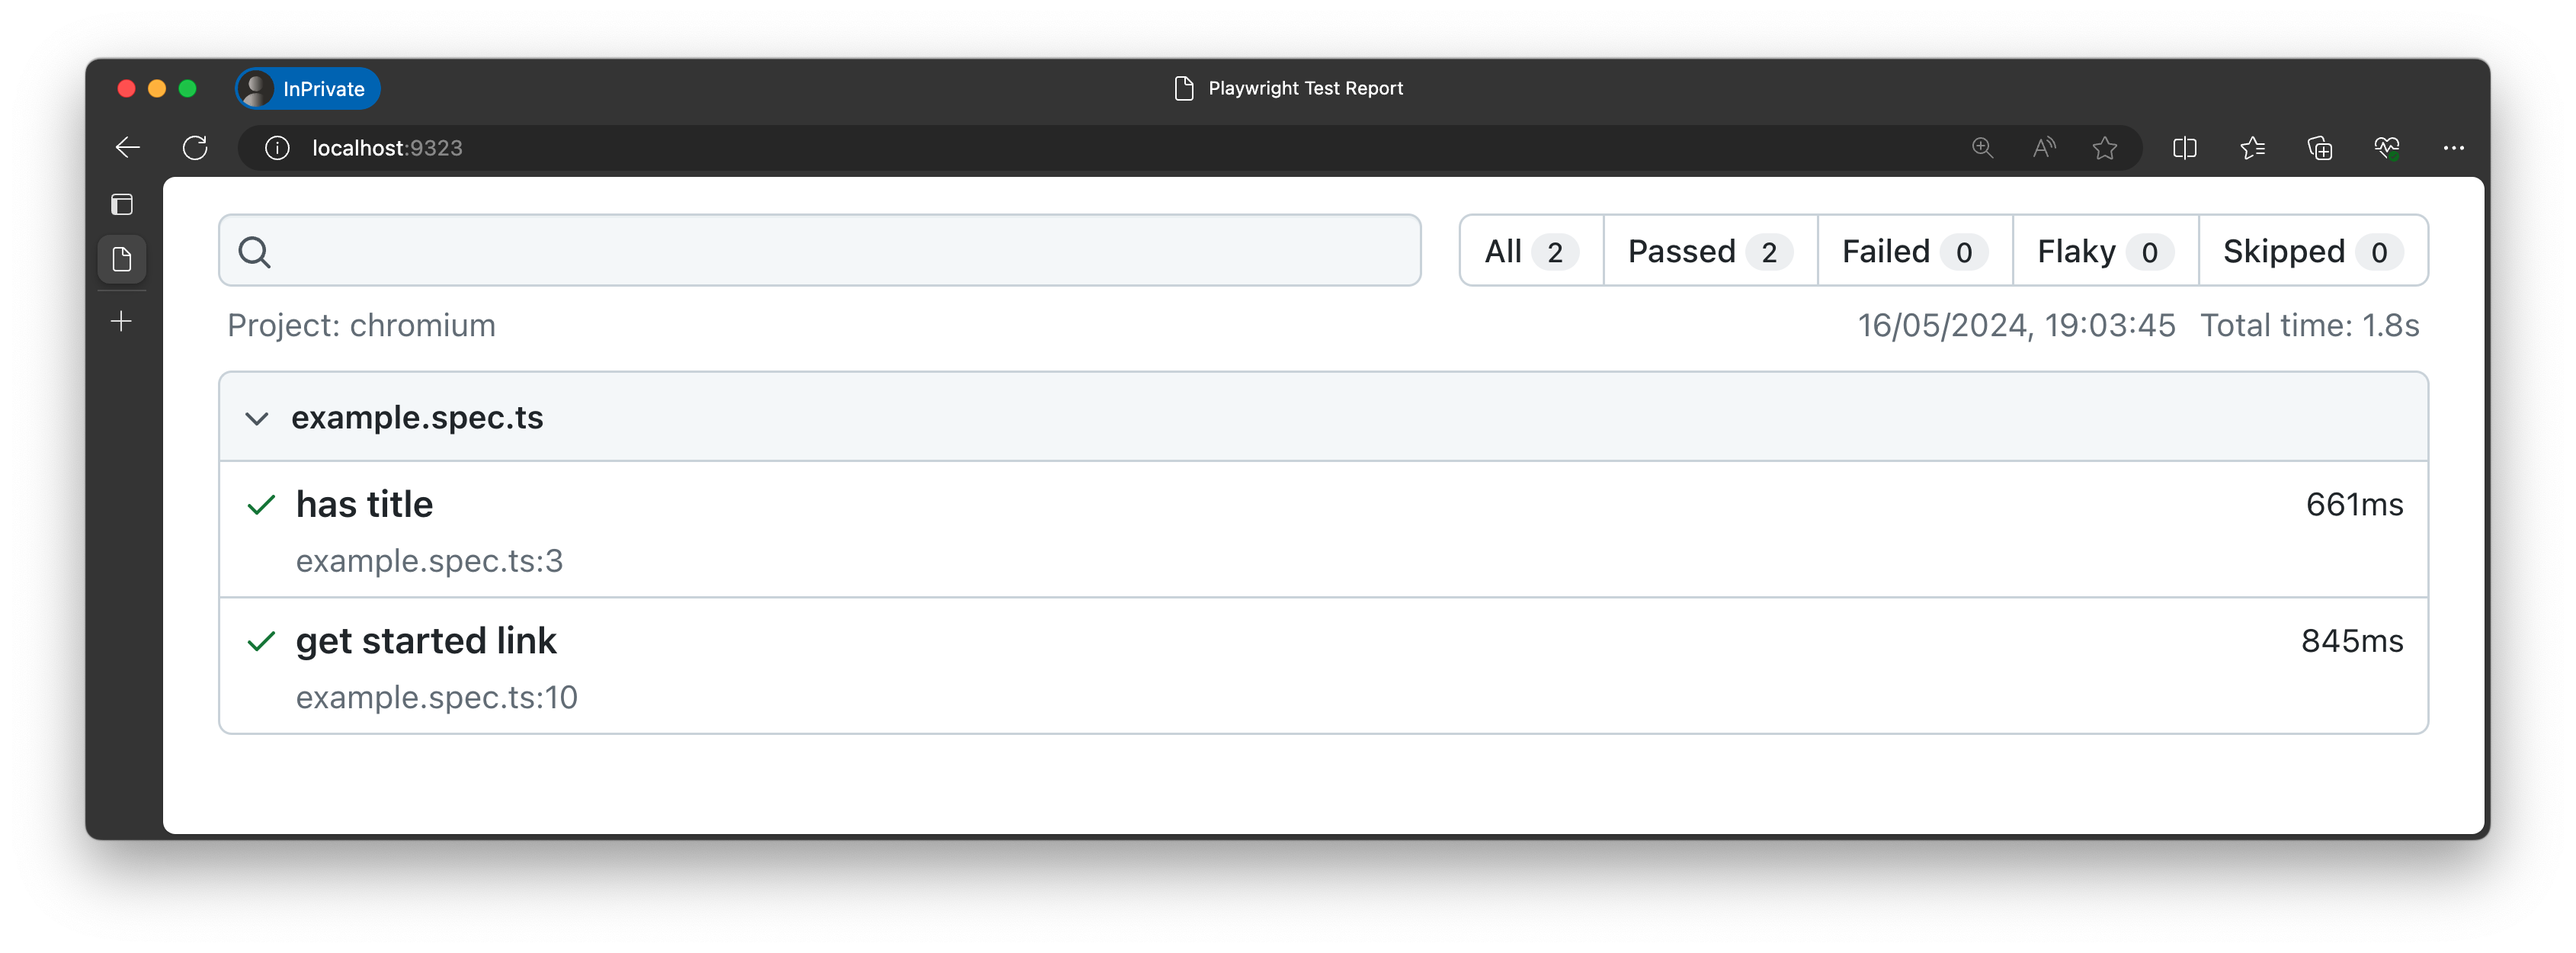
Excellent! We can see that we now have the two test cases running on a single browser project, giving us two test executions.
Running 2 tests using 2 workers
  2 passed (1.2s)

To open last HTML report run:
  npx playwright show-report
Let's run the show-report command and note how the report now only shows us the two tests on the one browser.
Explore Emulation
Playwright supports Emulation for mobile testing. You can select device profiles from the supported emulation profiles and add it as a new project in the configuration file.
You might notice that the default configuration file (playwright.config.ts) has a commented-out section for testing against mobile viewports. Let's uncomment out the project for Mobile Safari.
  projects: [
    {
      name: 'chromium',
      use: { ...devices['Desktop Chrome'] },
    },

    {
      name: 'Mobile Safari',
      use: { ...devices['iPhone 12 Pro'] },
    },
  ],
Here's what the profile description for the iPhone 12 Pro looks like:
  "iPhone 12 Pro": {
    "userAgent": "Mozilla/5.0 (iPhone; CPU iPhone OS 14_4 like macOS X)* *AppleWebKit/605.1.15 (KHTML, like Gecko) Version/17.0 Mobile/15E148 Safari/604.1",
    "screen": {
      "width": 390,
      "height": 844
    },

    "viewport": {
      "width": 390,
      "height": 664
    },

    "deviceScaleFactor": 3,
    "isMobile": true,
    "hasTouch": true,
    "defaultBrowserType": "webkit"
  },
Let's run our tests again.
npx playwright test
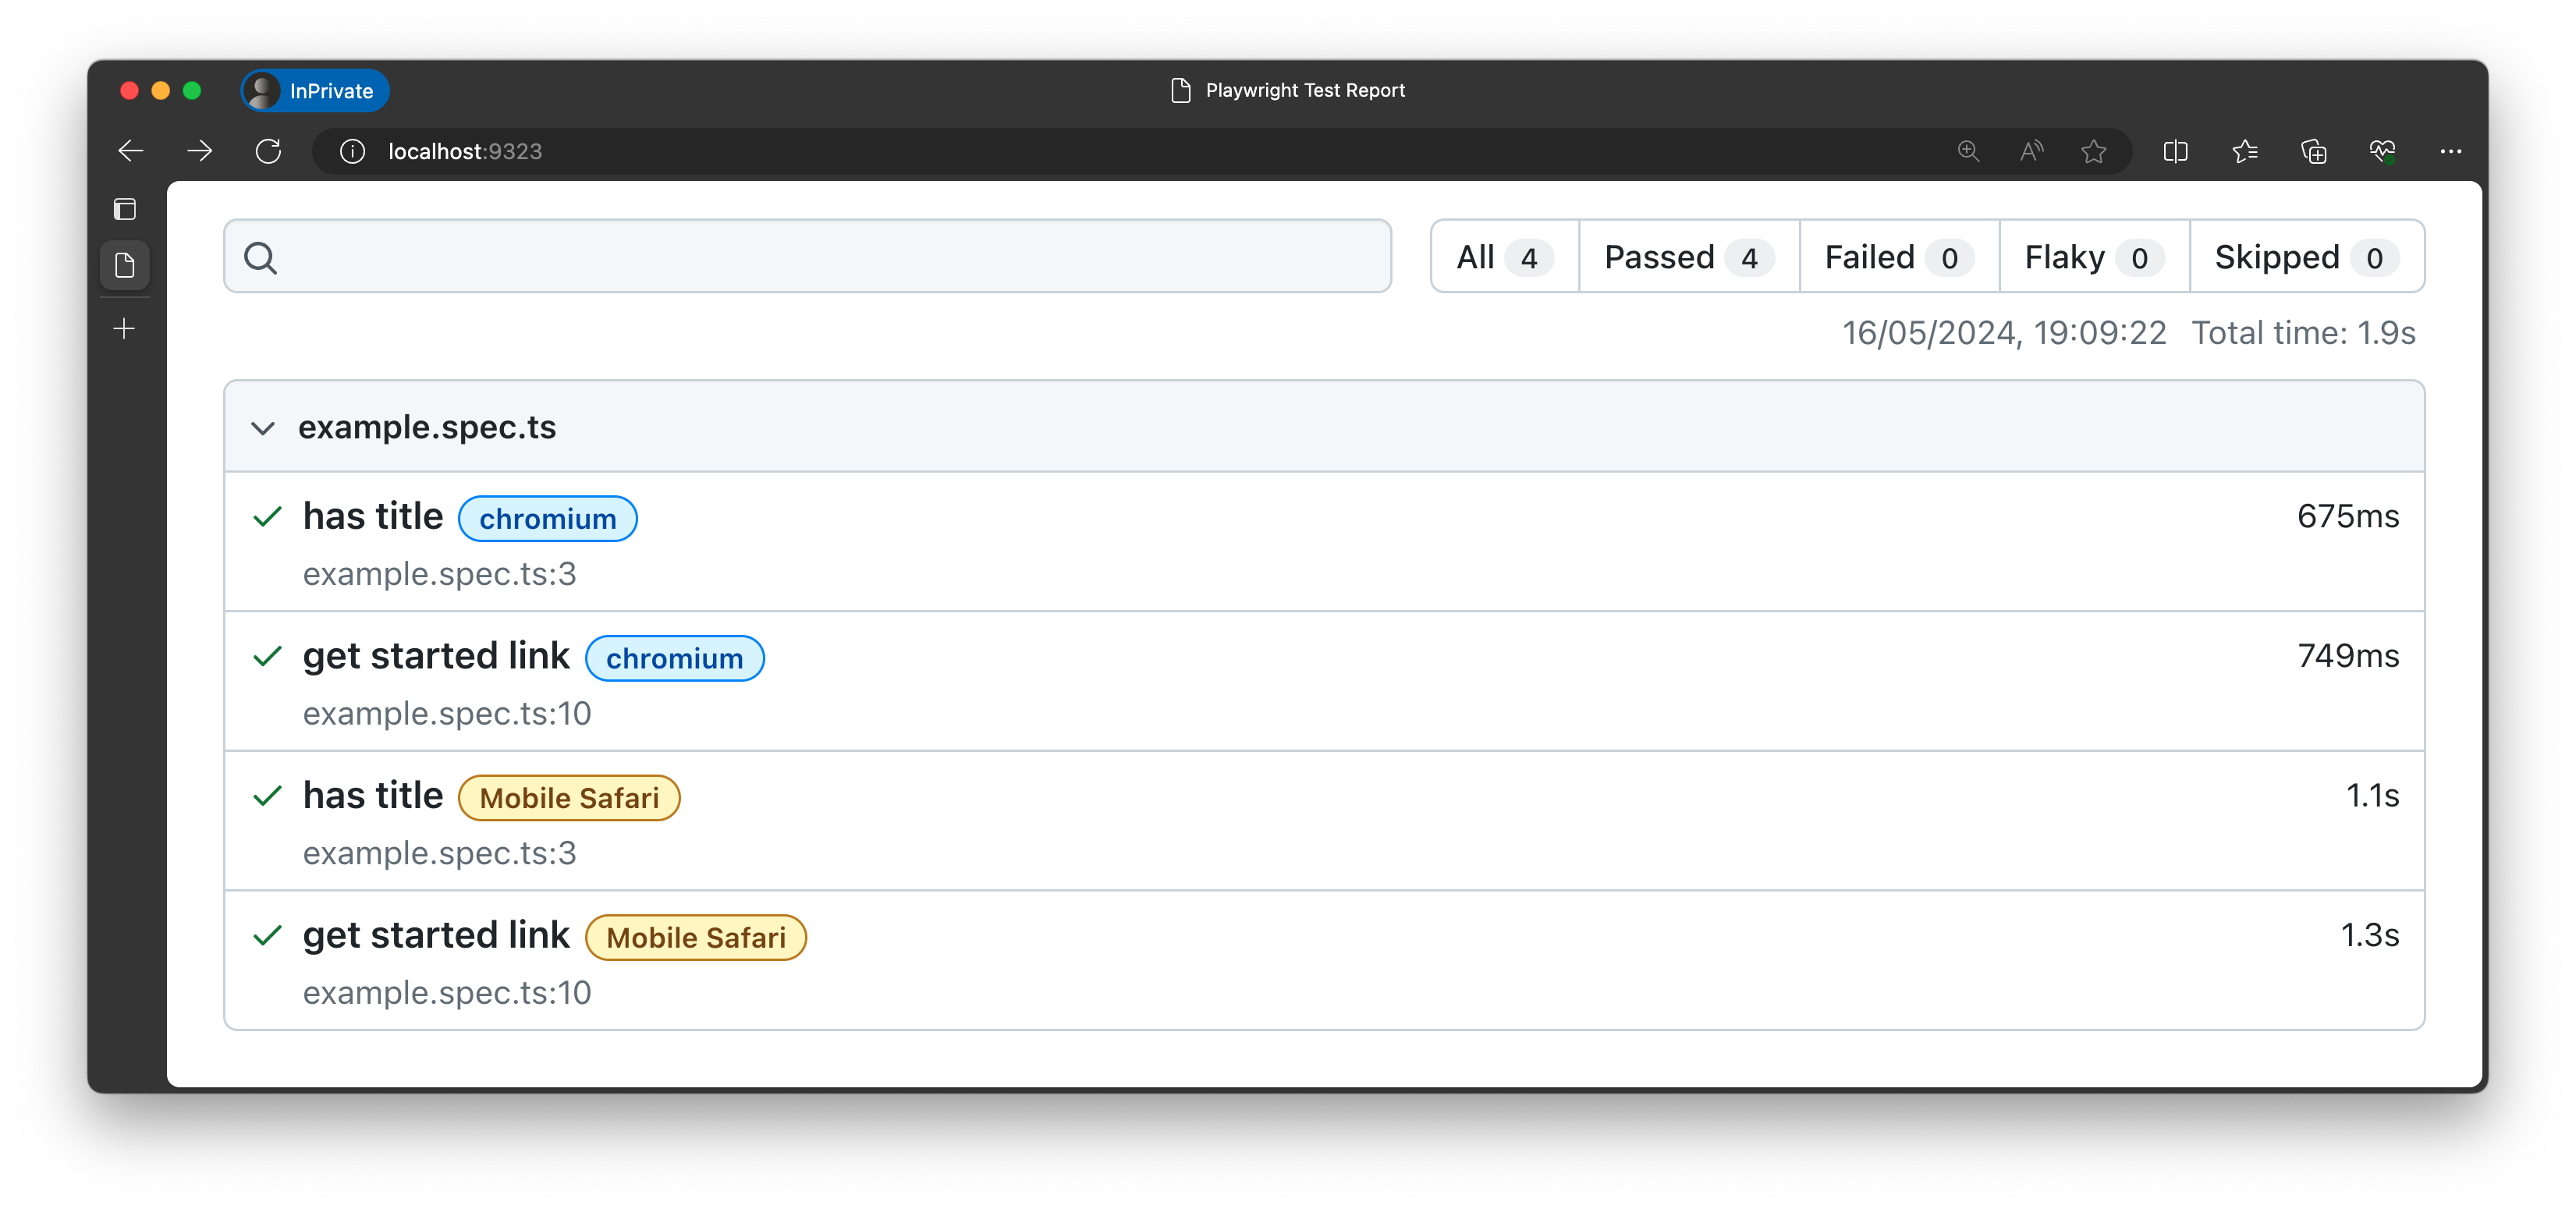
The code runs our two tests on the chromium and Mobile Safari projects. We can see that we now have two test executions.
Running 4 tests using 4 workers
  4 passed
To see what happened, lets's open the report:
npx playwright show-report
This serves the report on a local server and opens the browser to that URL.
Serving HTML report at http://localhost:9323. Press Ctrl+C to quit.
Note how the same two test cases are executed, now with the chromium browser and the Mobile Safari device emulator. We can see that the emulator takes a little longer to run each test compared to the browser engines.
We can override the default profile properties via the Playwright configuration file (global) or within a Test Specification file (local override) - but to try that out, we first need to understand the use directive.
Before we do that, let's reset our playwright.config.ts file to run tests on the chromium, firefox, and webkit projects. You can keep the Mobile Safari project active for now.
Explore use options
Playwright has a use property to configure the Test Runner for the following features:
- Basic: Set
baseURL(maps to "/" route) andstorageState(for example, load auth). - Emulation: Emulates a real device; for example, mobile or tablet.
- Network: Configure connections; for example, provide credentials for HTTP auth.
- Recording: Capture traces to help with debugging, or screenshots or video.
You can set these options globally in the config file (for all tests) or locally for a specific test or group of tests only.
To turn on traces and take a screenshot for our projects, let's use the Recording feature. It allows us to get a visual and system level understanding of what happens in test execution. Update the top-level use object in your playwright.config.ts as follows:
export default defineConfig({
  testDir: './tests',
  ..
  use: {
    trace: 'on',
    screenshot: 'on',
  },
  ..
});
Let's run the test again.
npx playwright test
Note how the total time taken to run the tests increased drastically. Turning on traces and recording media are time-intensive actions and should be used with discretion - typically to help debug issues.
Running 4 tests using 3 workers
  4 passed
To see what happened, let's open the HTML report.
npx playwright show-report
Serving HTML report at http://localhost:9323. Press Ctrl+C to quit.
Select a line to view that test in detail.
Turning on options like recording are expensive, so use with discretion; for example, for debugging on CI.
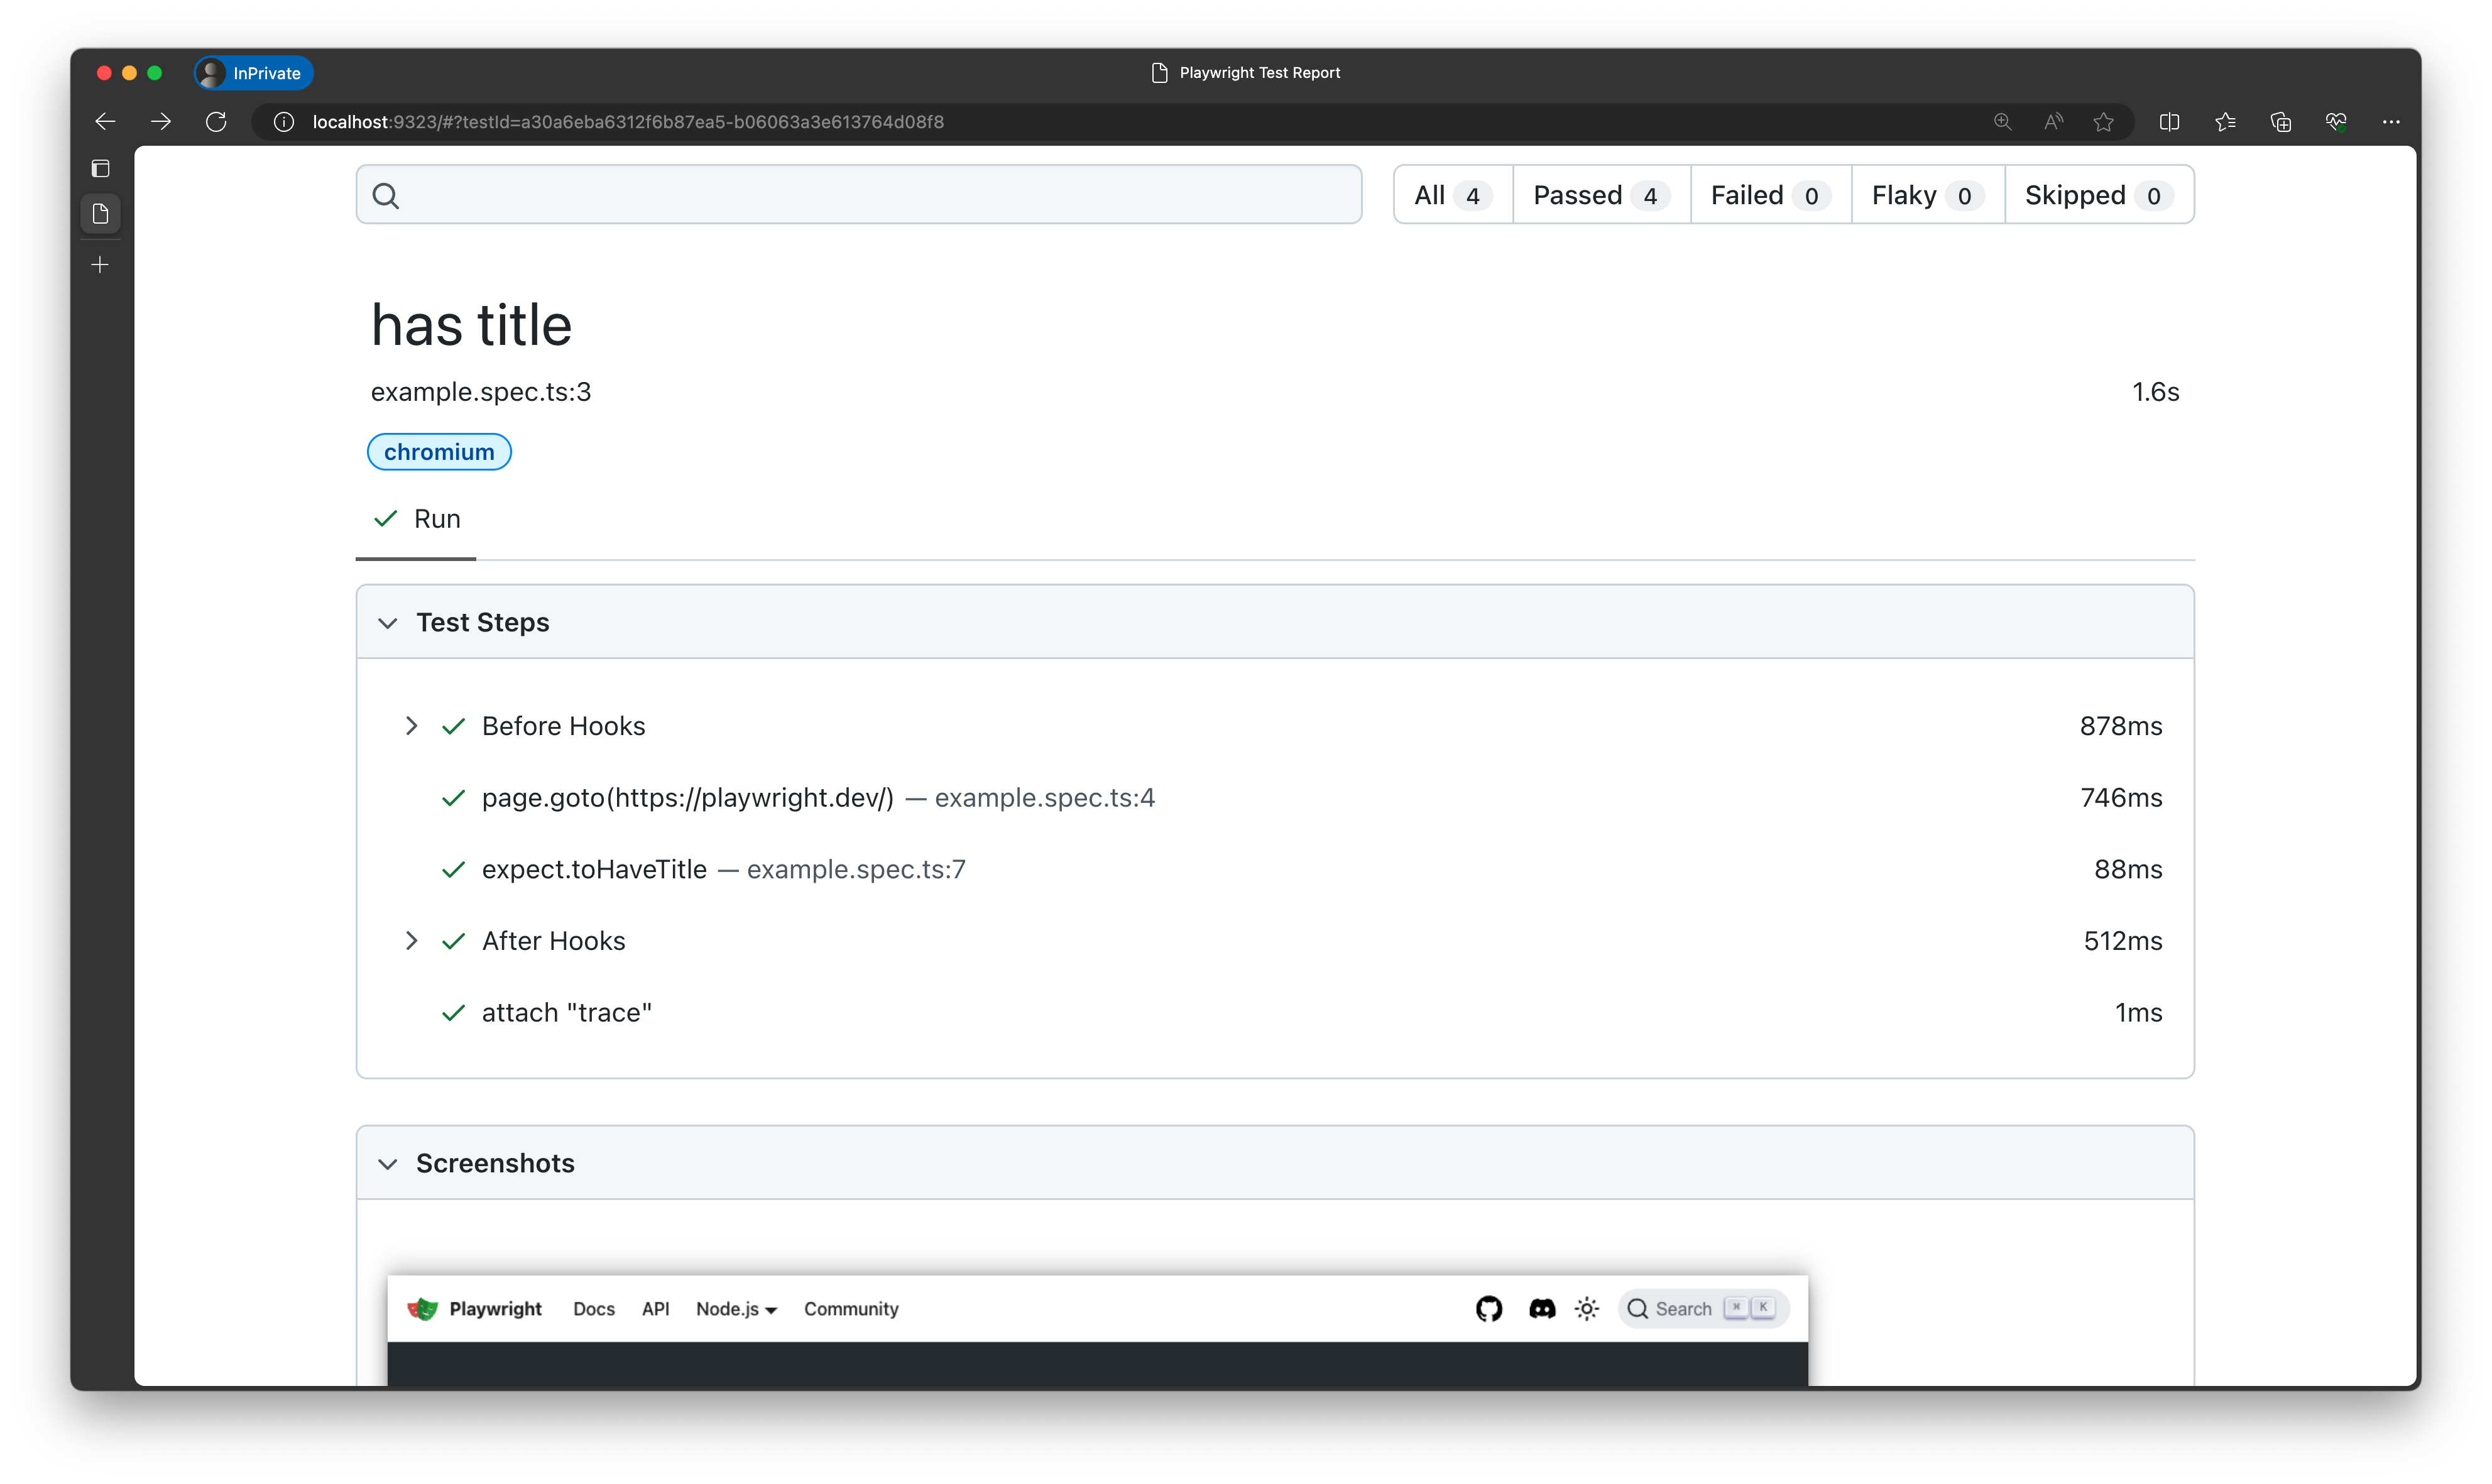
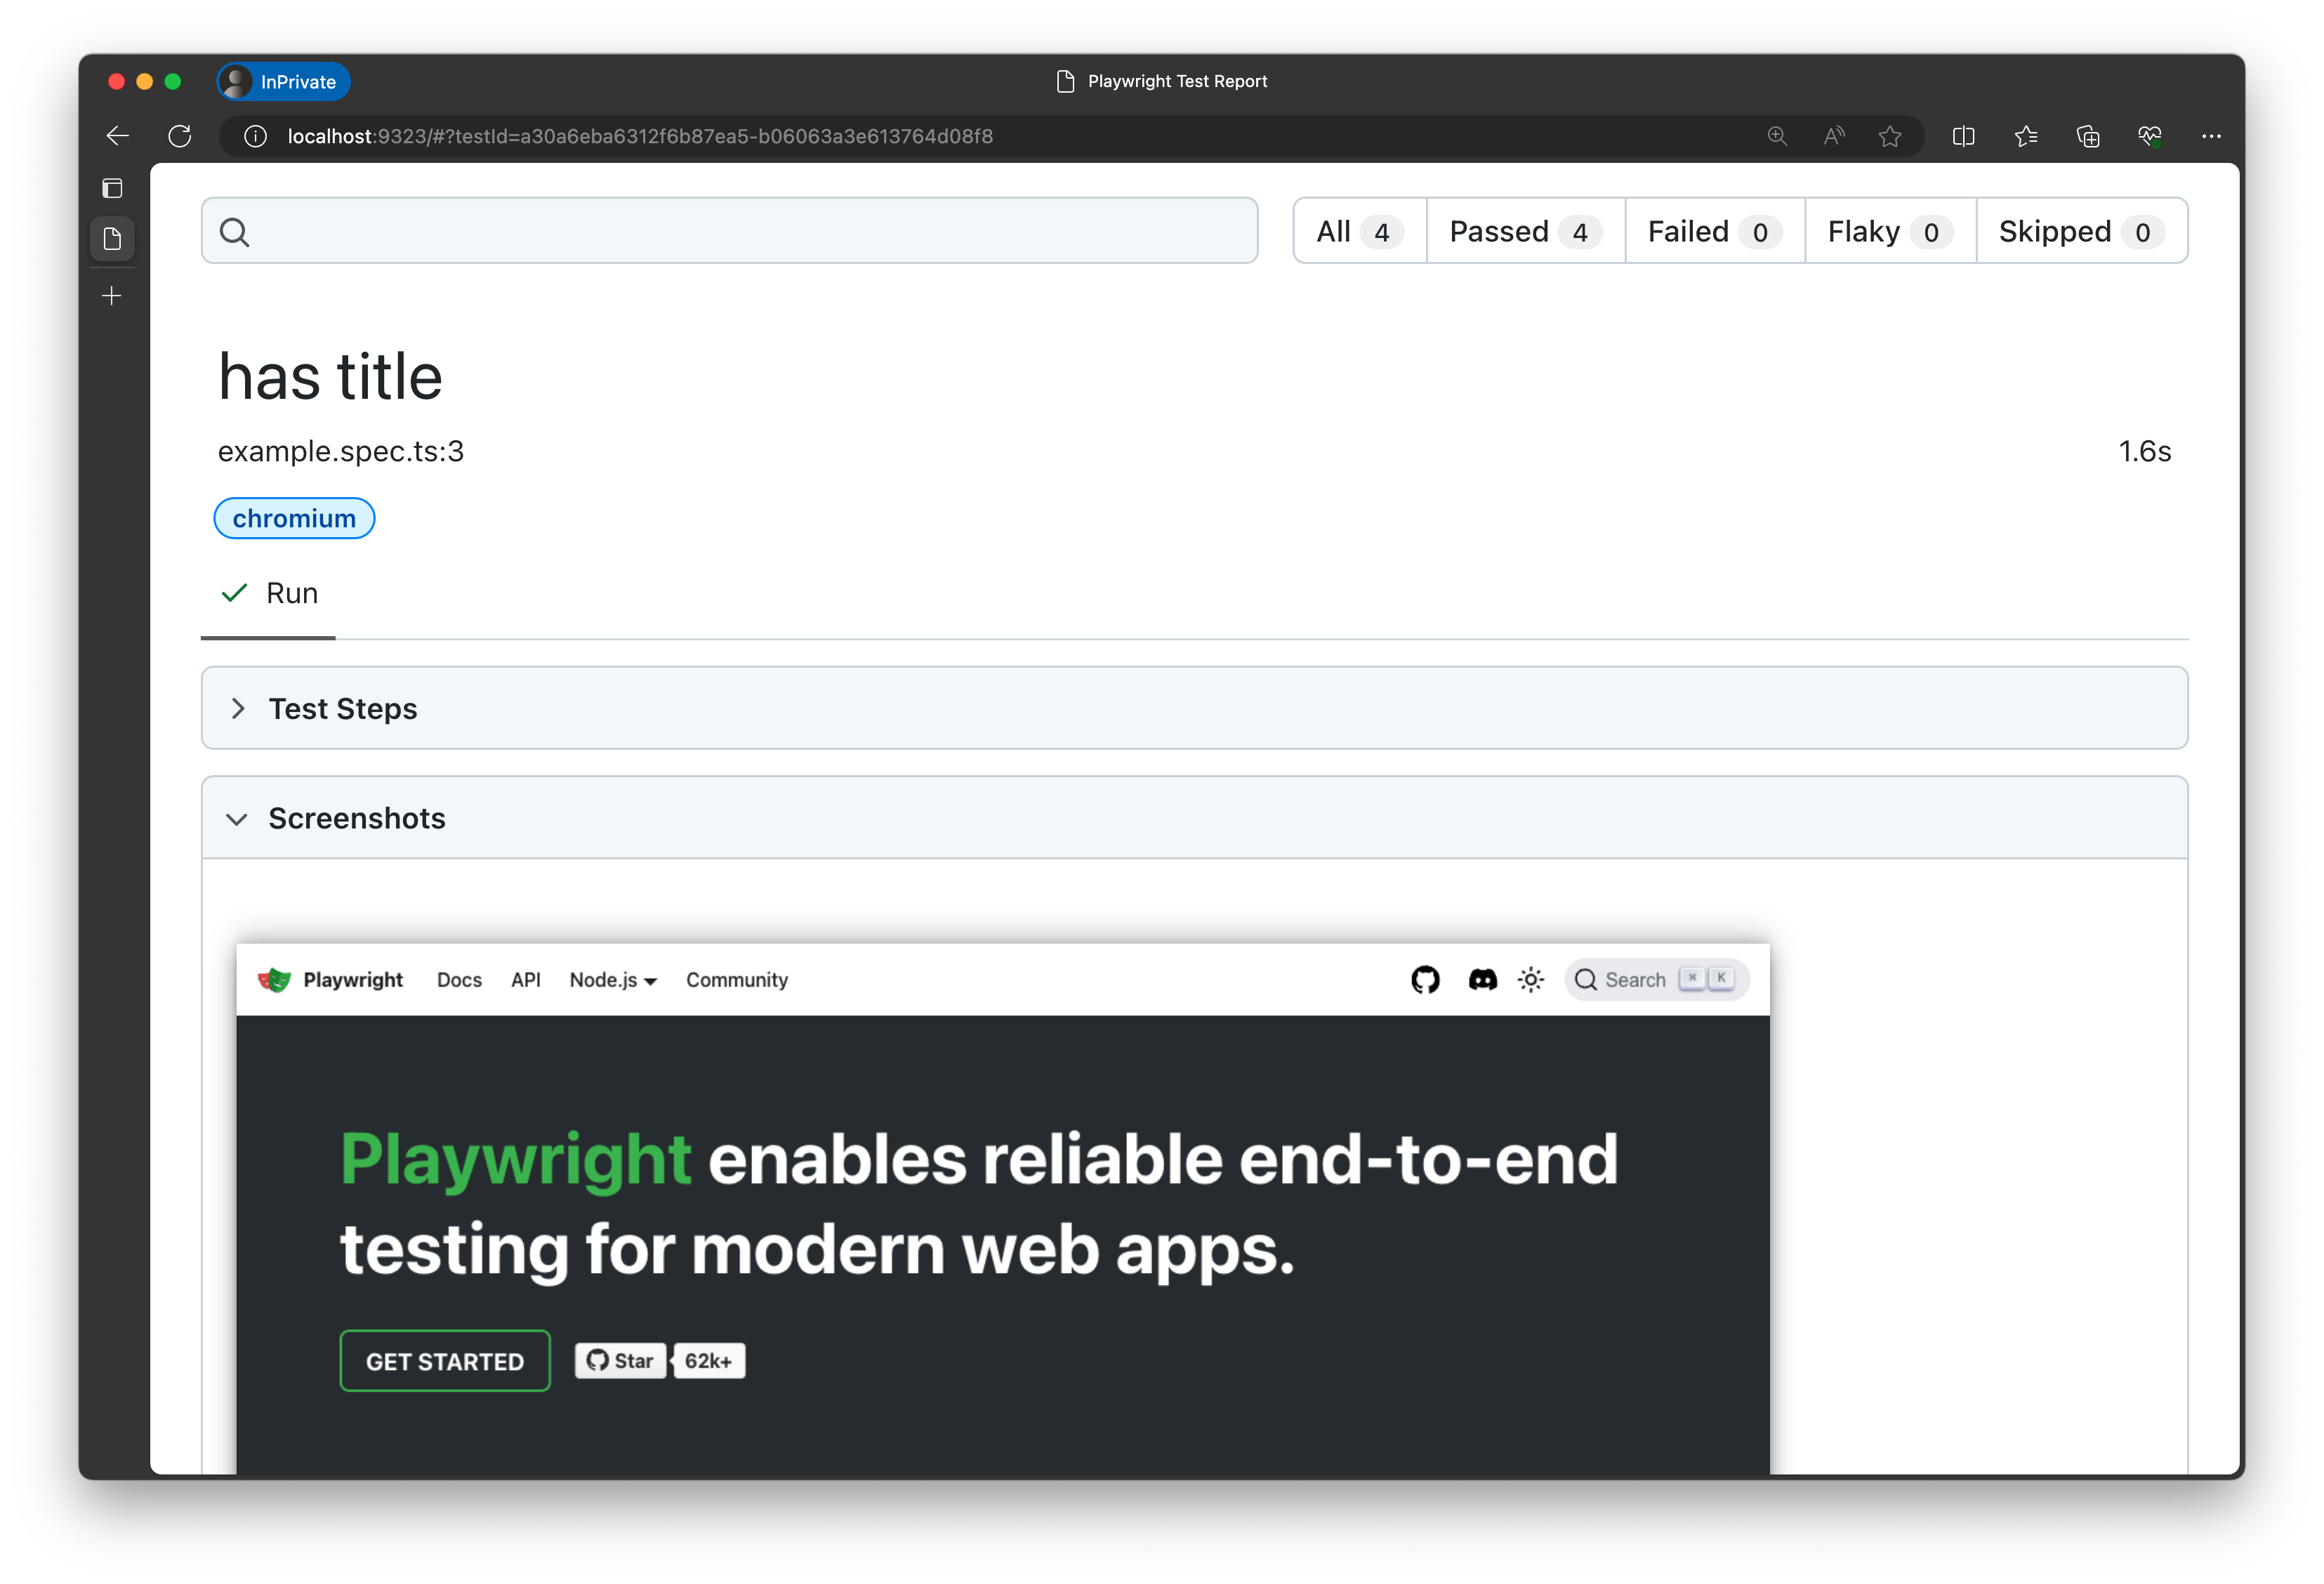
Let's look at the detailed view of one of our tests using the chromium project as defined in our config file.
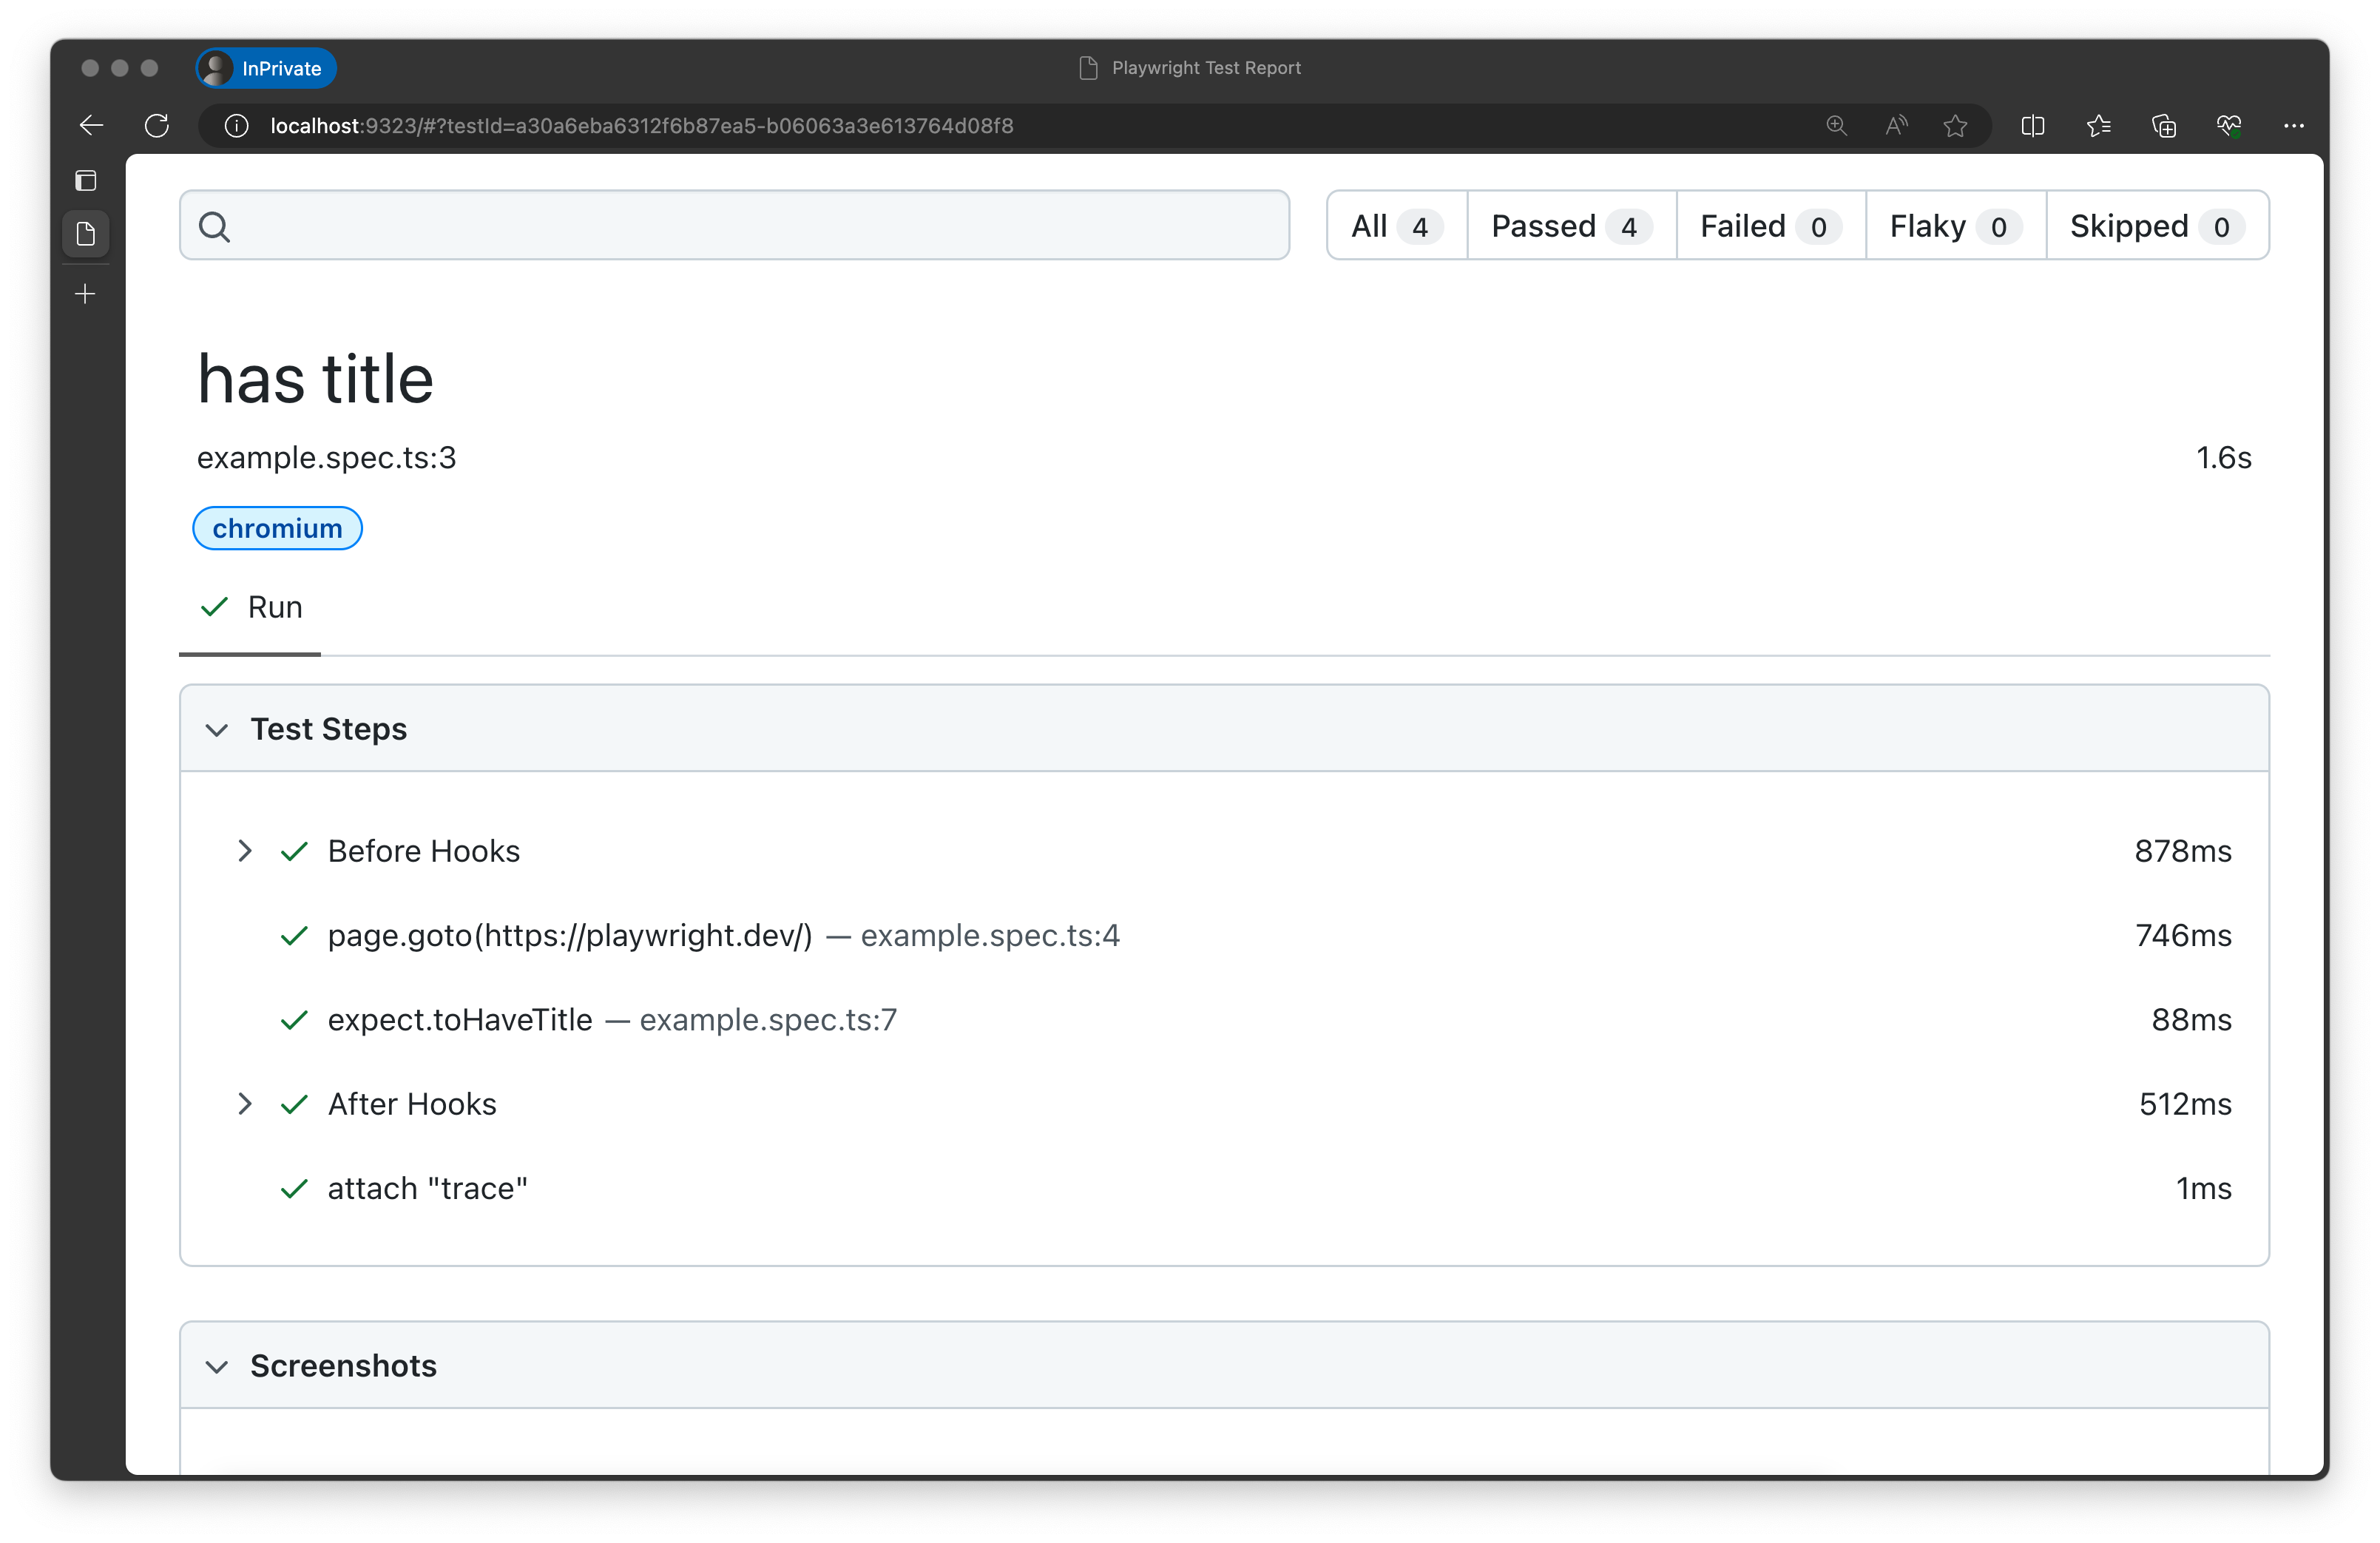
The detail view includes a screenshot (from page.goto). This is useful for visual regression testing.
Most importantly, we get a link to a trace for our test. To open the trace, select the trace link in the list view or the image of the trace in the detail view of the test.
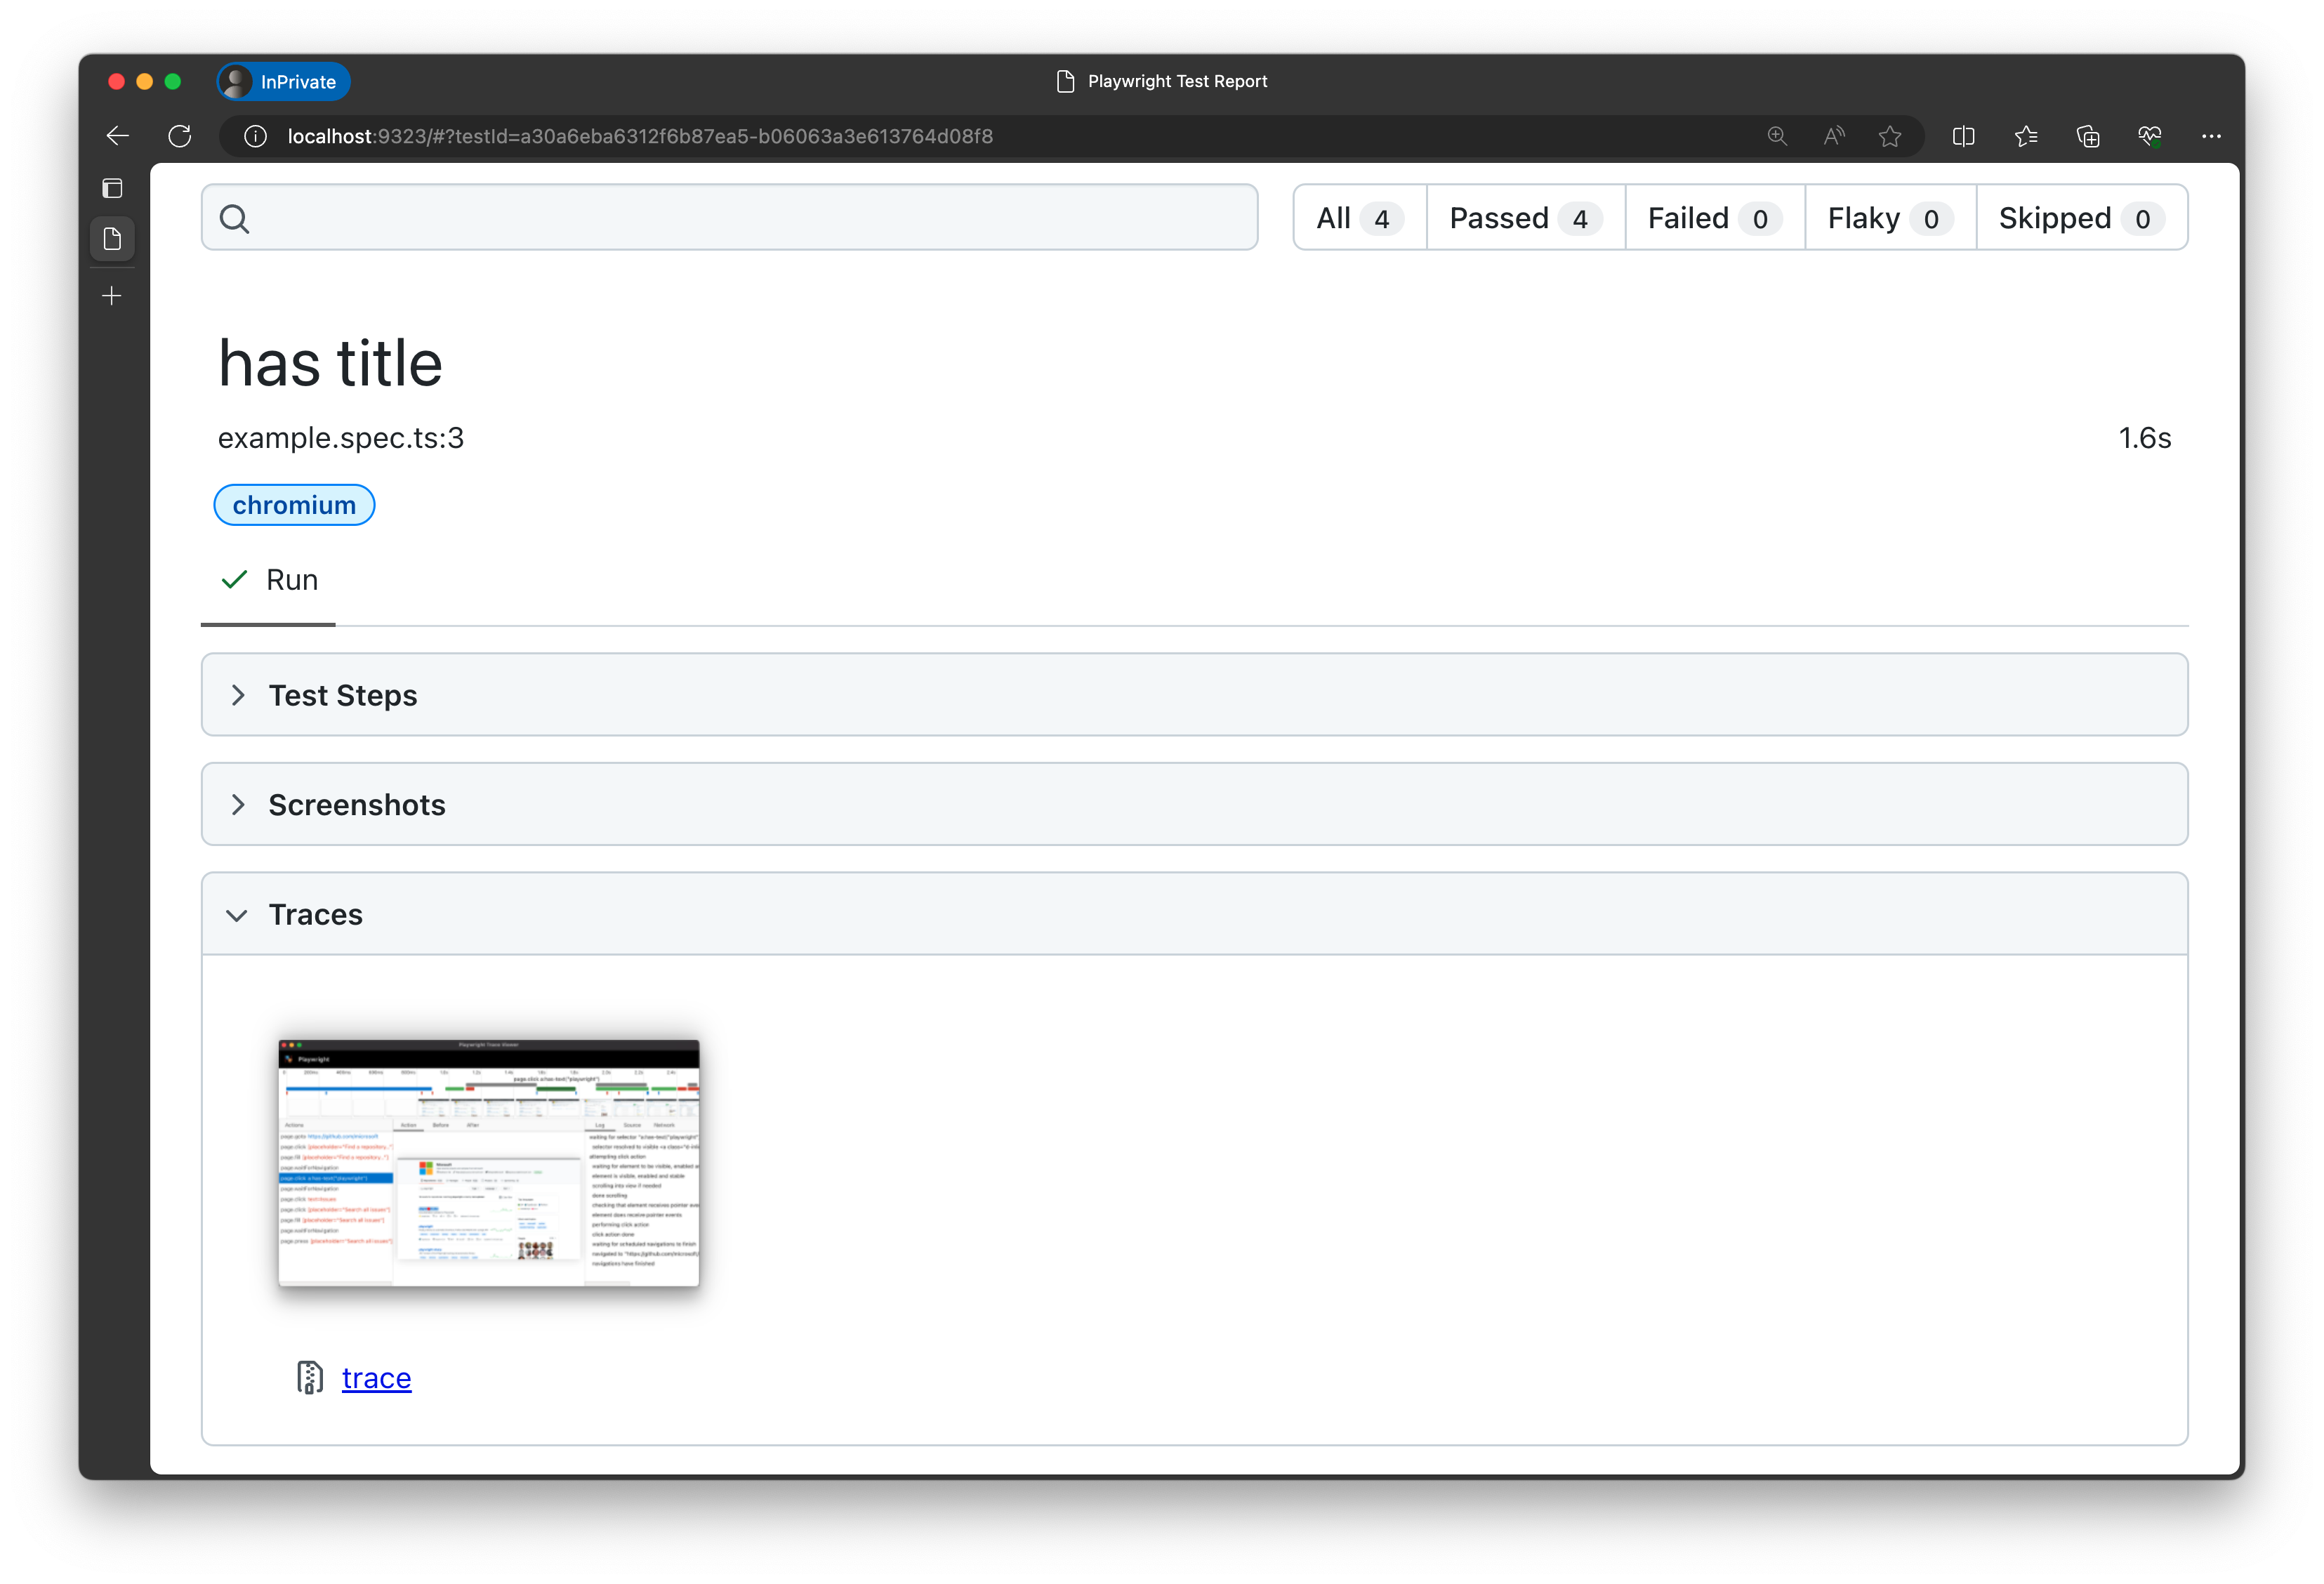
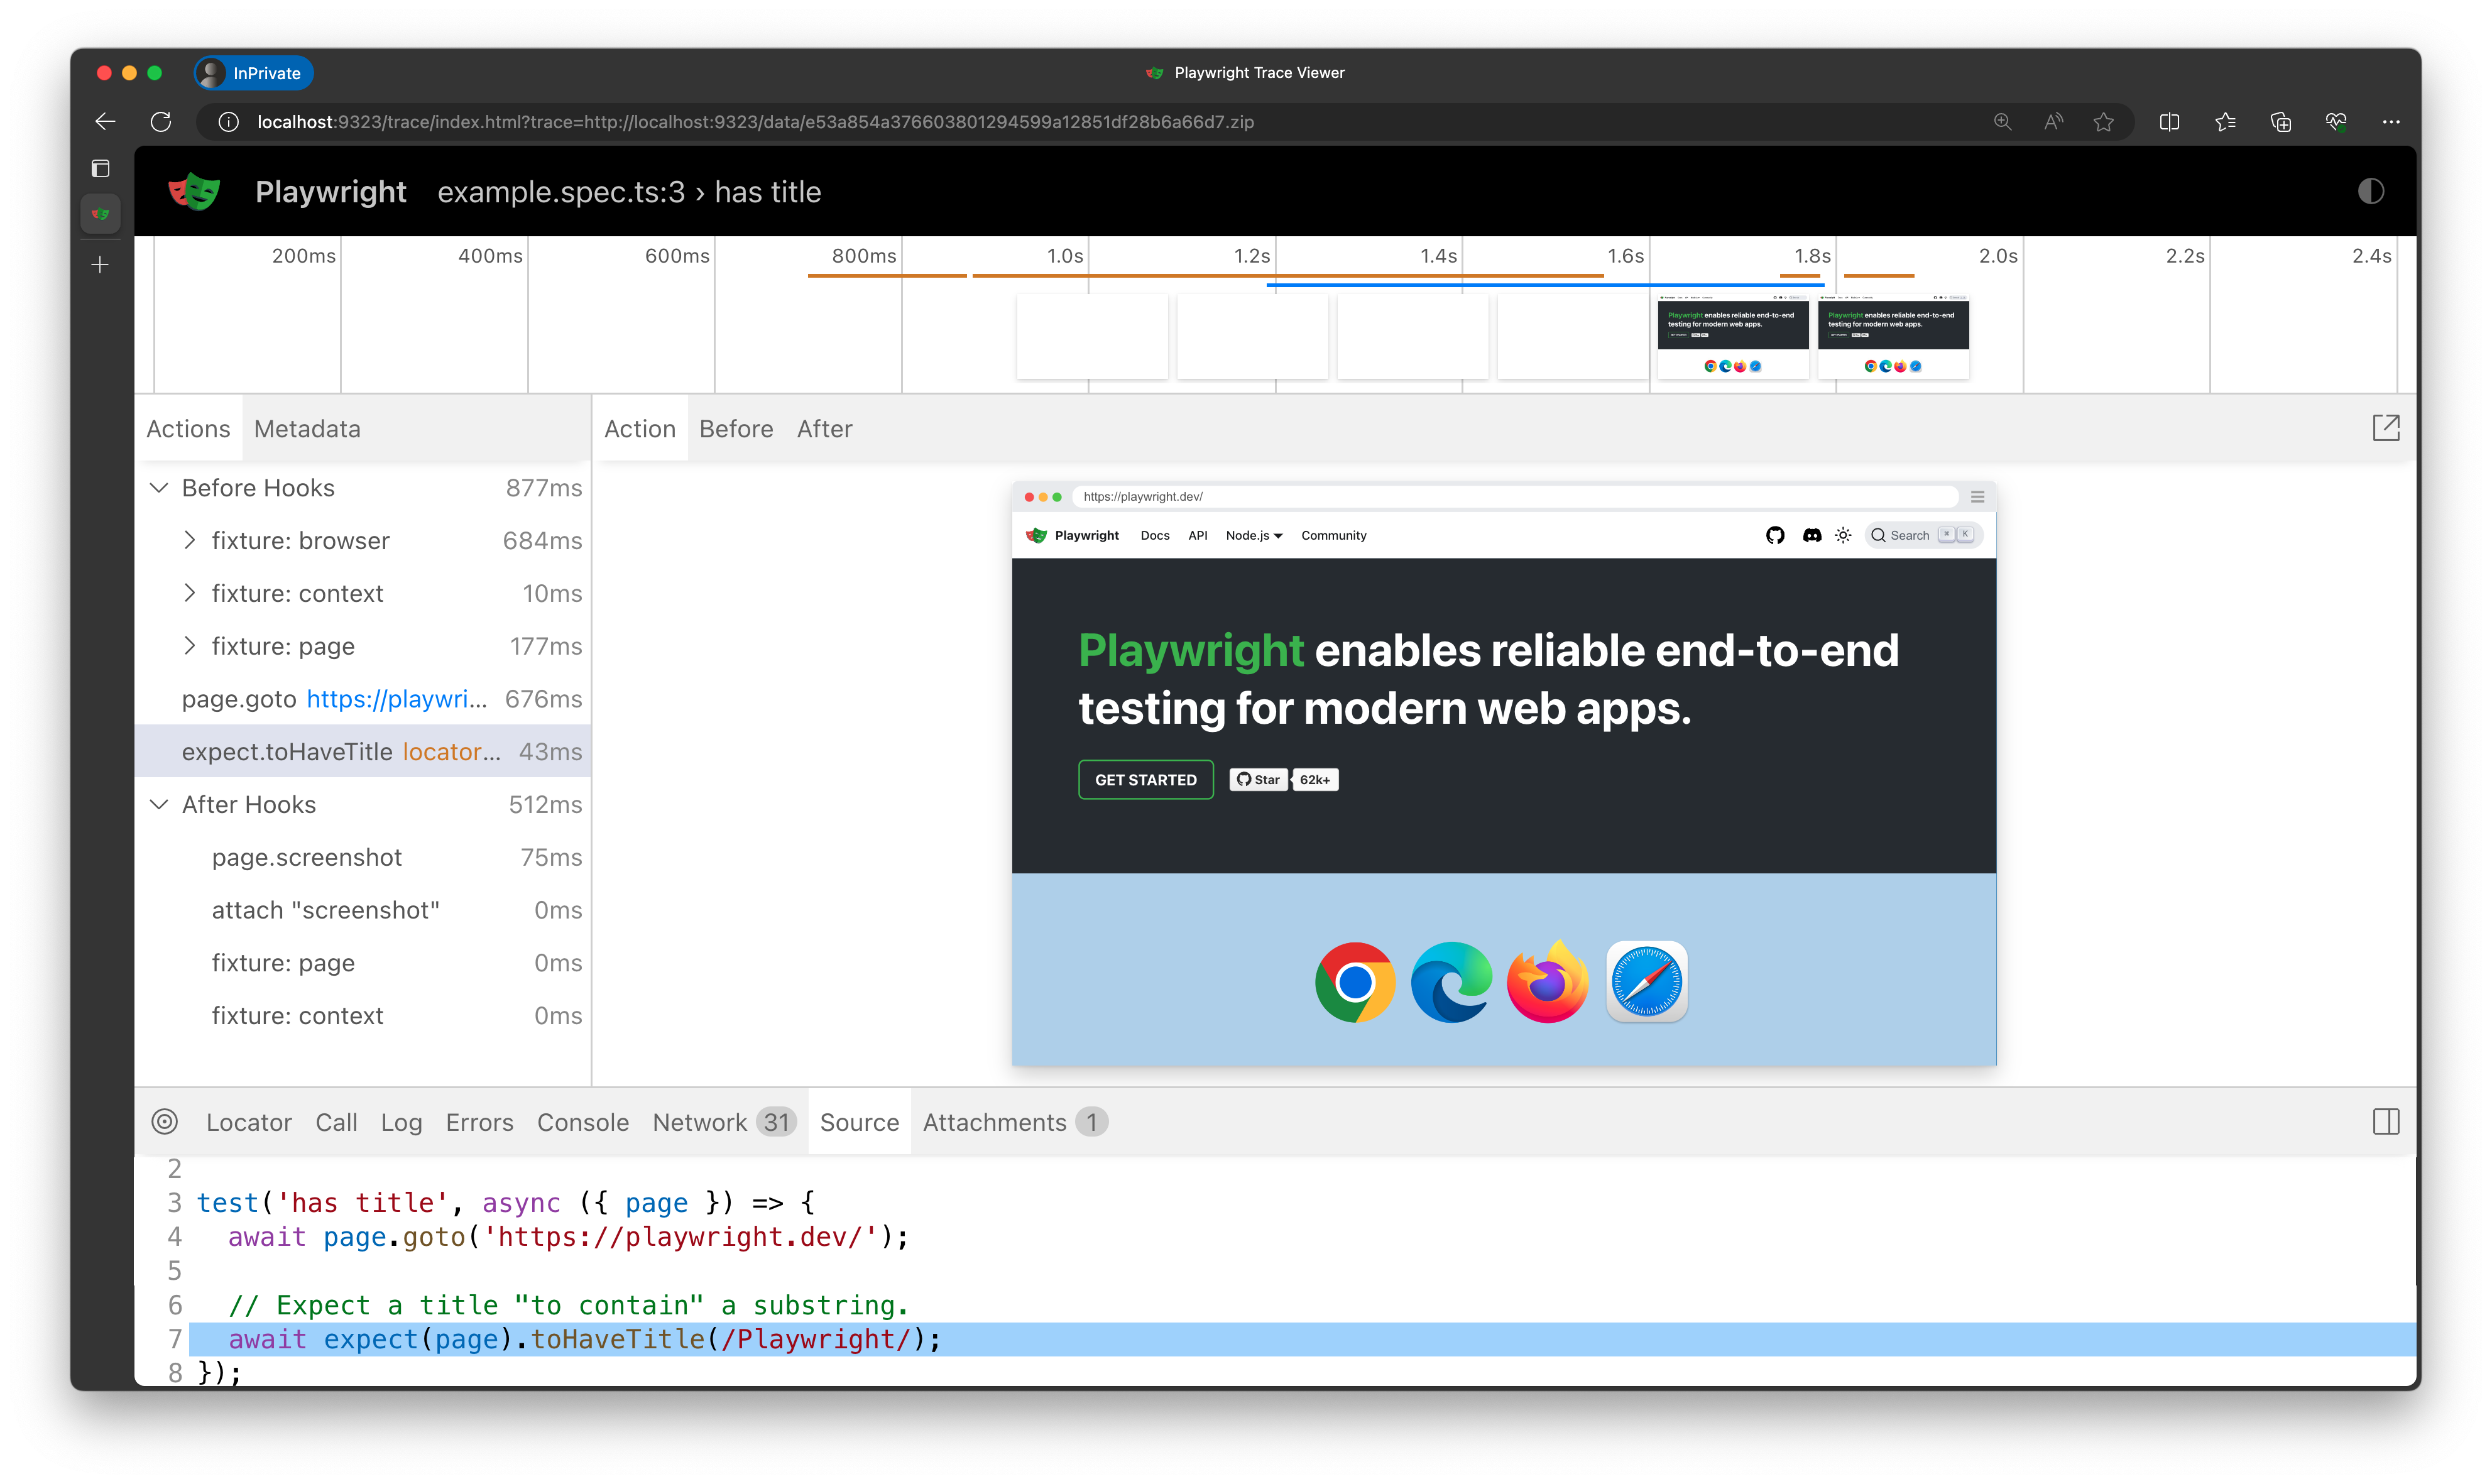
The trace gives us a detailed view of our test. From there, we can easily step through each action and explore the network requests, the console, and even pop out the DOM snapshot and inspect it (for example, when debugging).
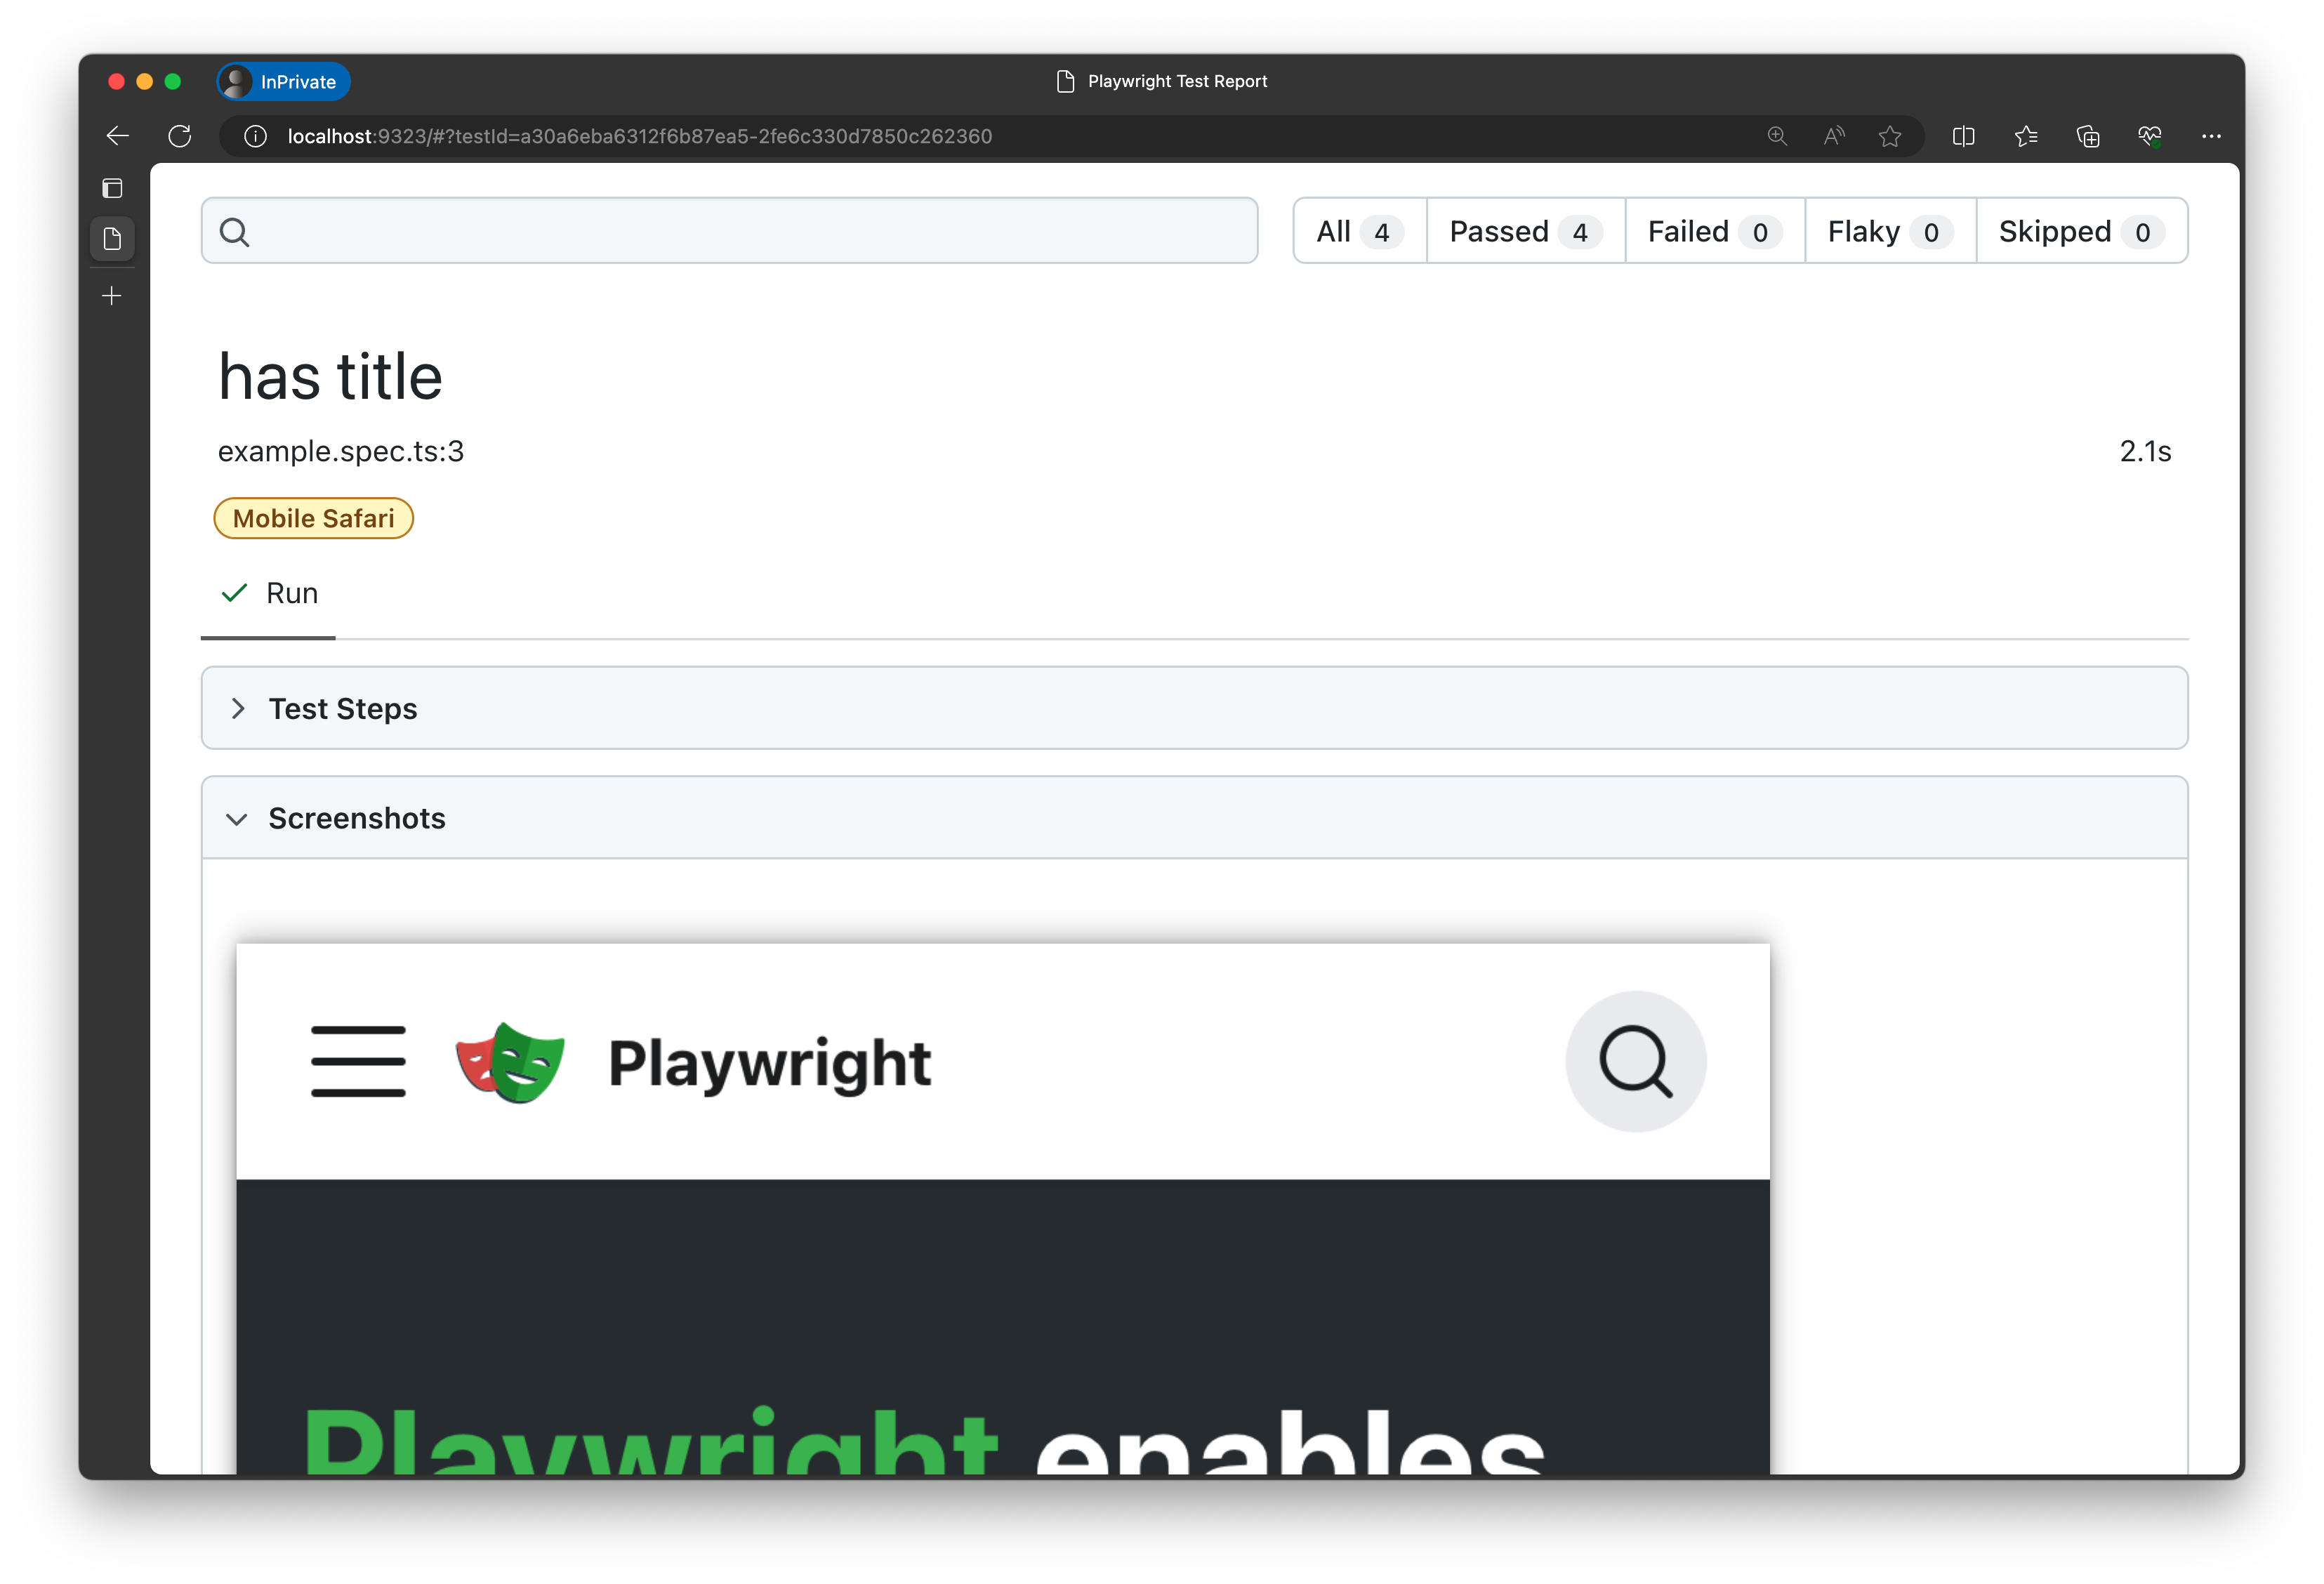
Let's go back to the report and select one of the tests runs on our Mobile Safari project. The detail page for the mobile project reflects the emulated profile view where once again we can explore the trace for our emulated test.
Turning on traces for every test run isn't recommended for production runs. Let's change the config back to run traces on the first retry of a failed test. That way if our test fails on CI, we have a trace to help debug the issue.
Let's also remove the screenshot option as we don't need that for now.
export default defineConfig({
  testDir: './tests',
  ..
  use: {
    trace: 'on-first-retry',
  },
  ..
});
We covered a lot here and need to move on. But as a challenge to yourself, try out some of the other use options and run tests to see how execution and reporting change. For example, try emulating a dark color scheme or changing the viewport to override the device profile defaults.
You learned a lot about Test Configuration. Now, let's explore Test Specification.