Exercise: Using Playwright in Visual Studio Code
In the previous section, we walked through core concepts related to the Playwright Test Configuration and Playwright Test Specification, but we used the Playwright Commandline (CLI) for executing our tests and viewing reports.
What if we could do it within our Visual Studio Code environment and have a more visual interaction process for authoring, running, and debugging, our tests?
With the Playwright Test for Visual Studio Code Extension, you get a superior developer experience and some unique tooling features that could make it your preferred way to interact with the Playwright Test runner. Let's jump in and take a tour.
Getting started
The Playwright documentation has a comprehensive tutorial with the video walkthrough that we recommend you watch in your own time. In this lesson, we try to walk through a subset of these exercises to get you familiar with usage.
 ]
]
Install Playwright extension
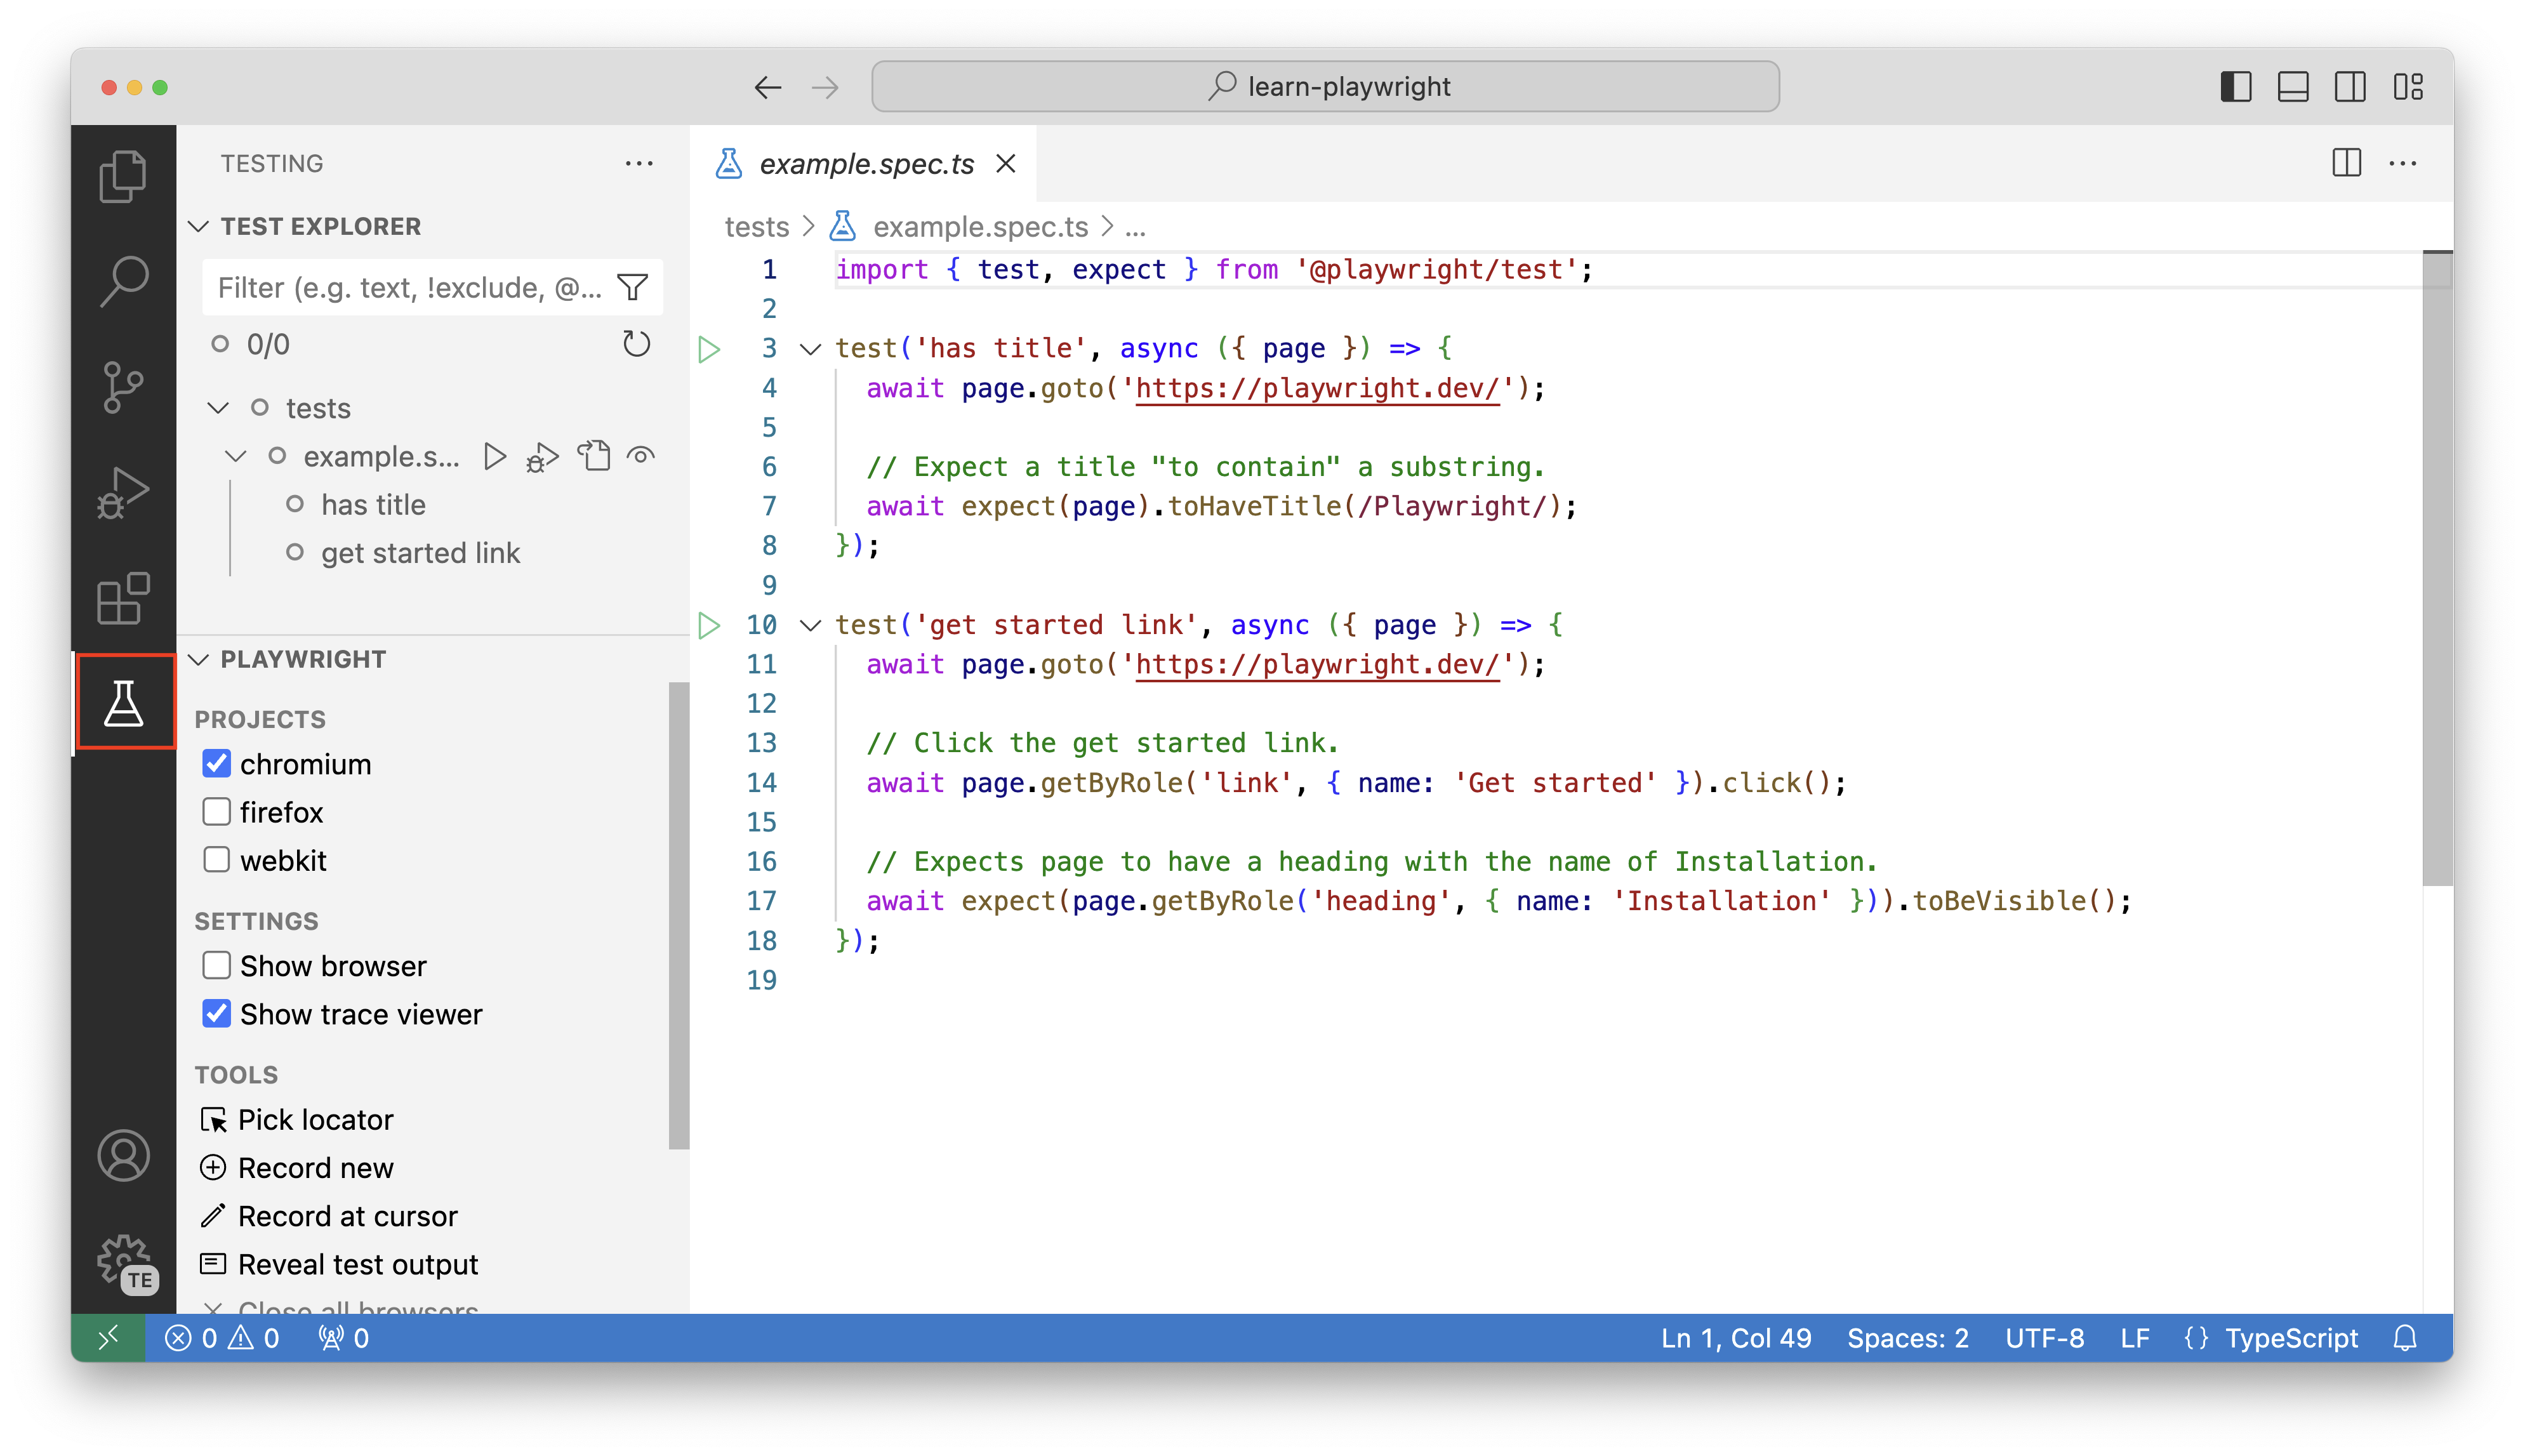
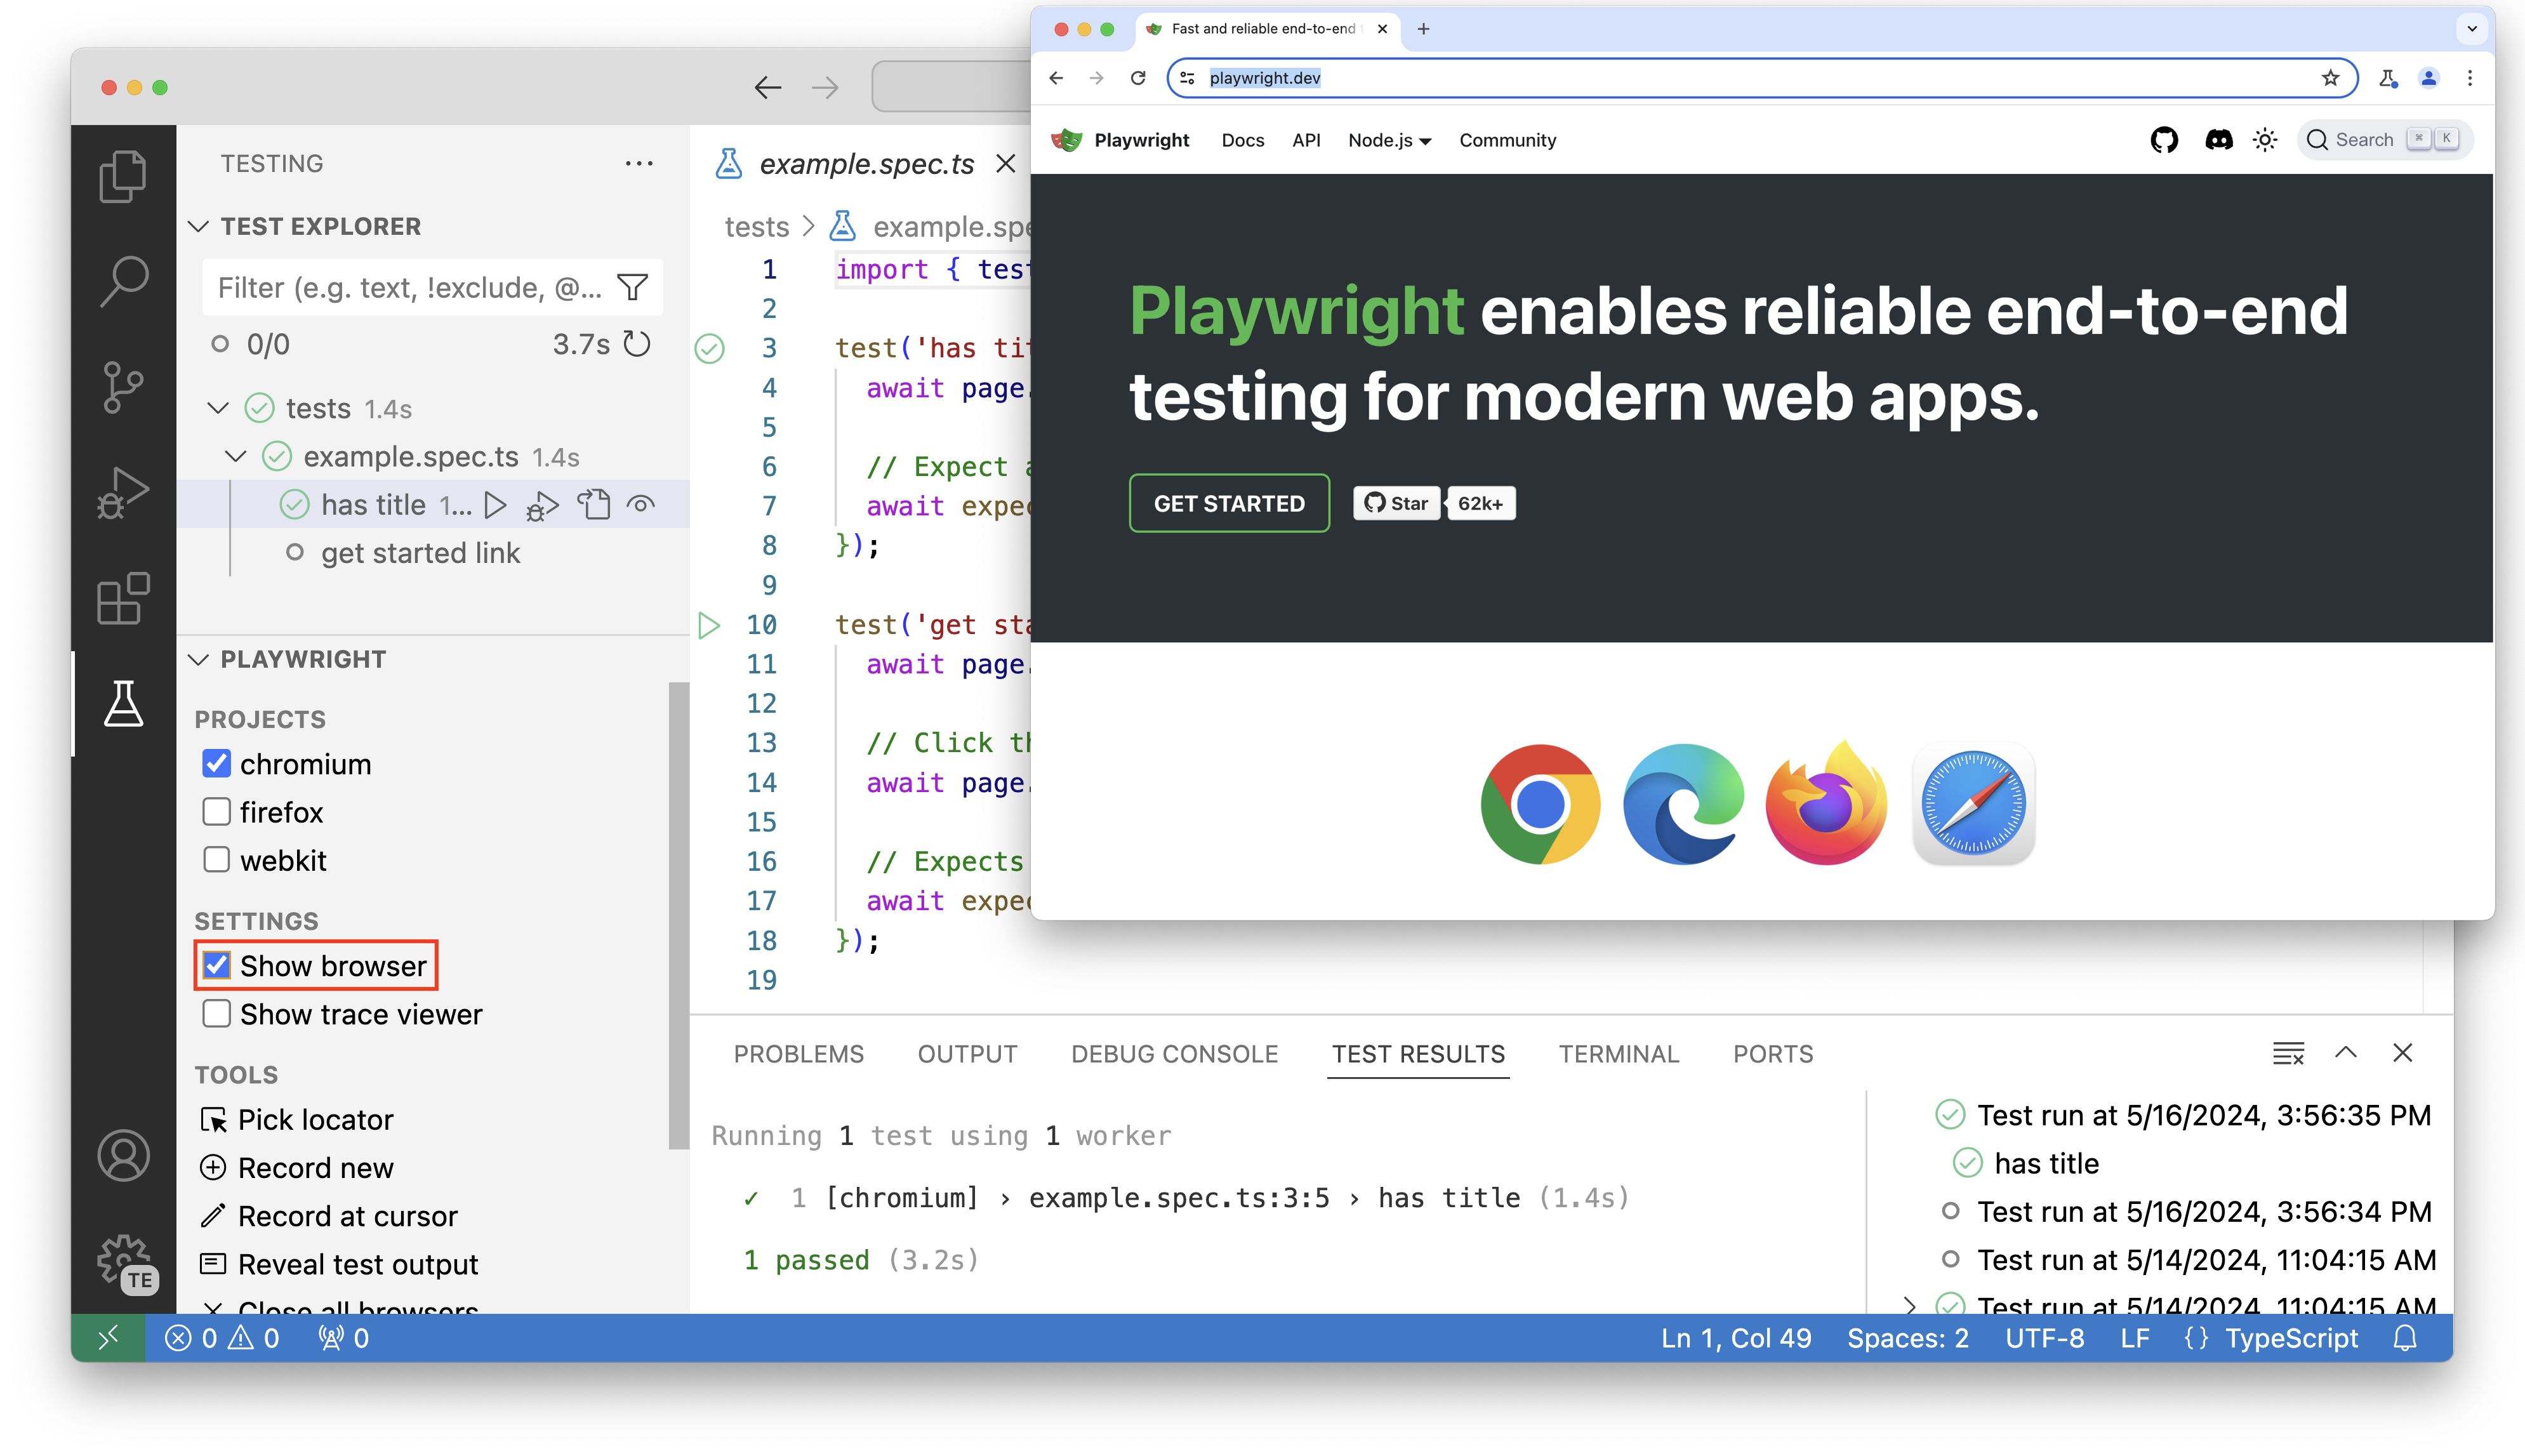
Install the extension from the Visual Studio Code Marketplace. Once installed, you should spot a beaker icon in the left-hand side of your Visual Studio Code window as shown in the screenshot. Note how the extension automatically detects and gathers the test specifications in your project.
Run test (headless)
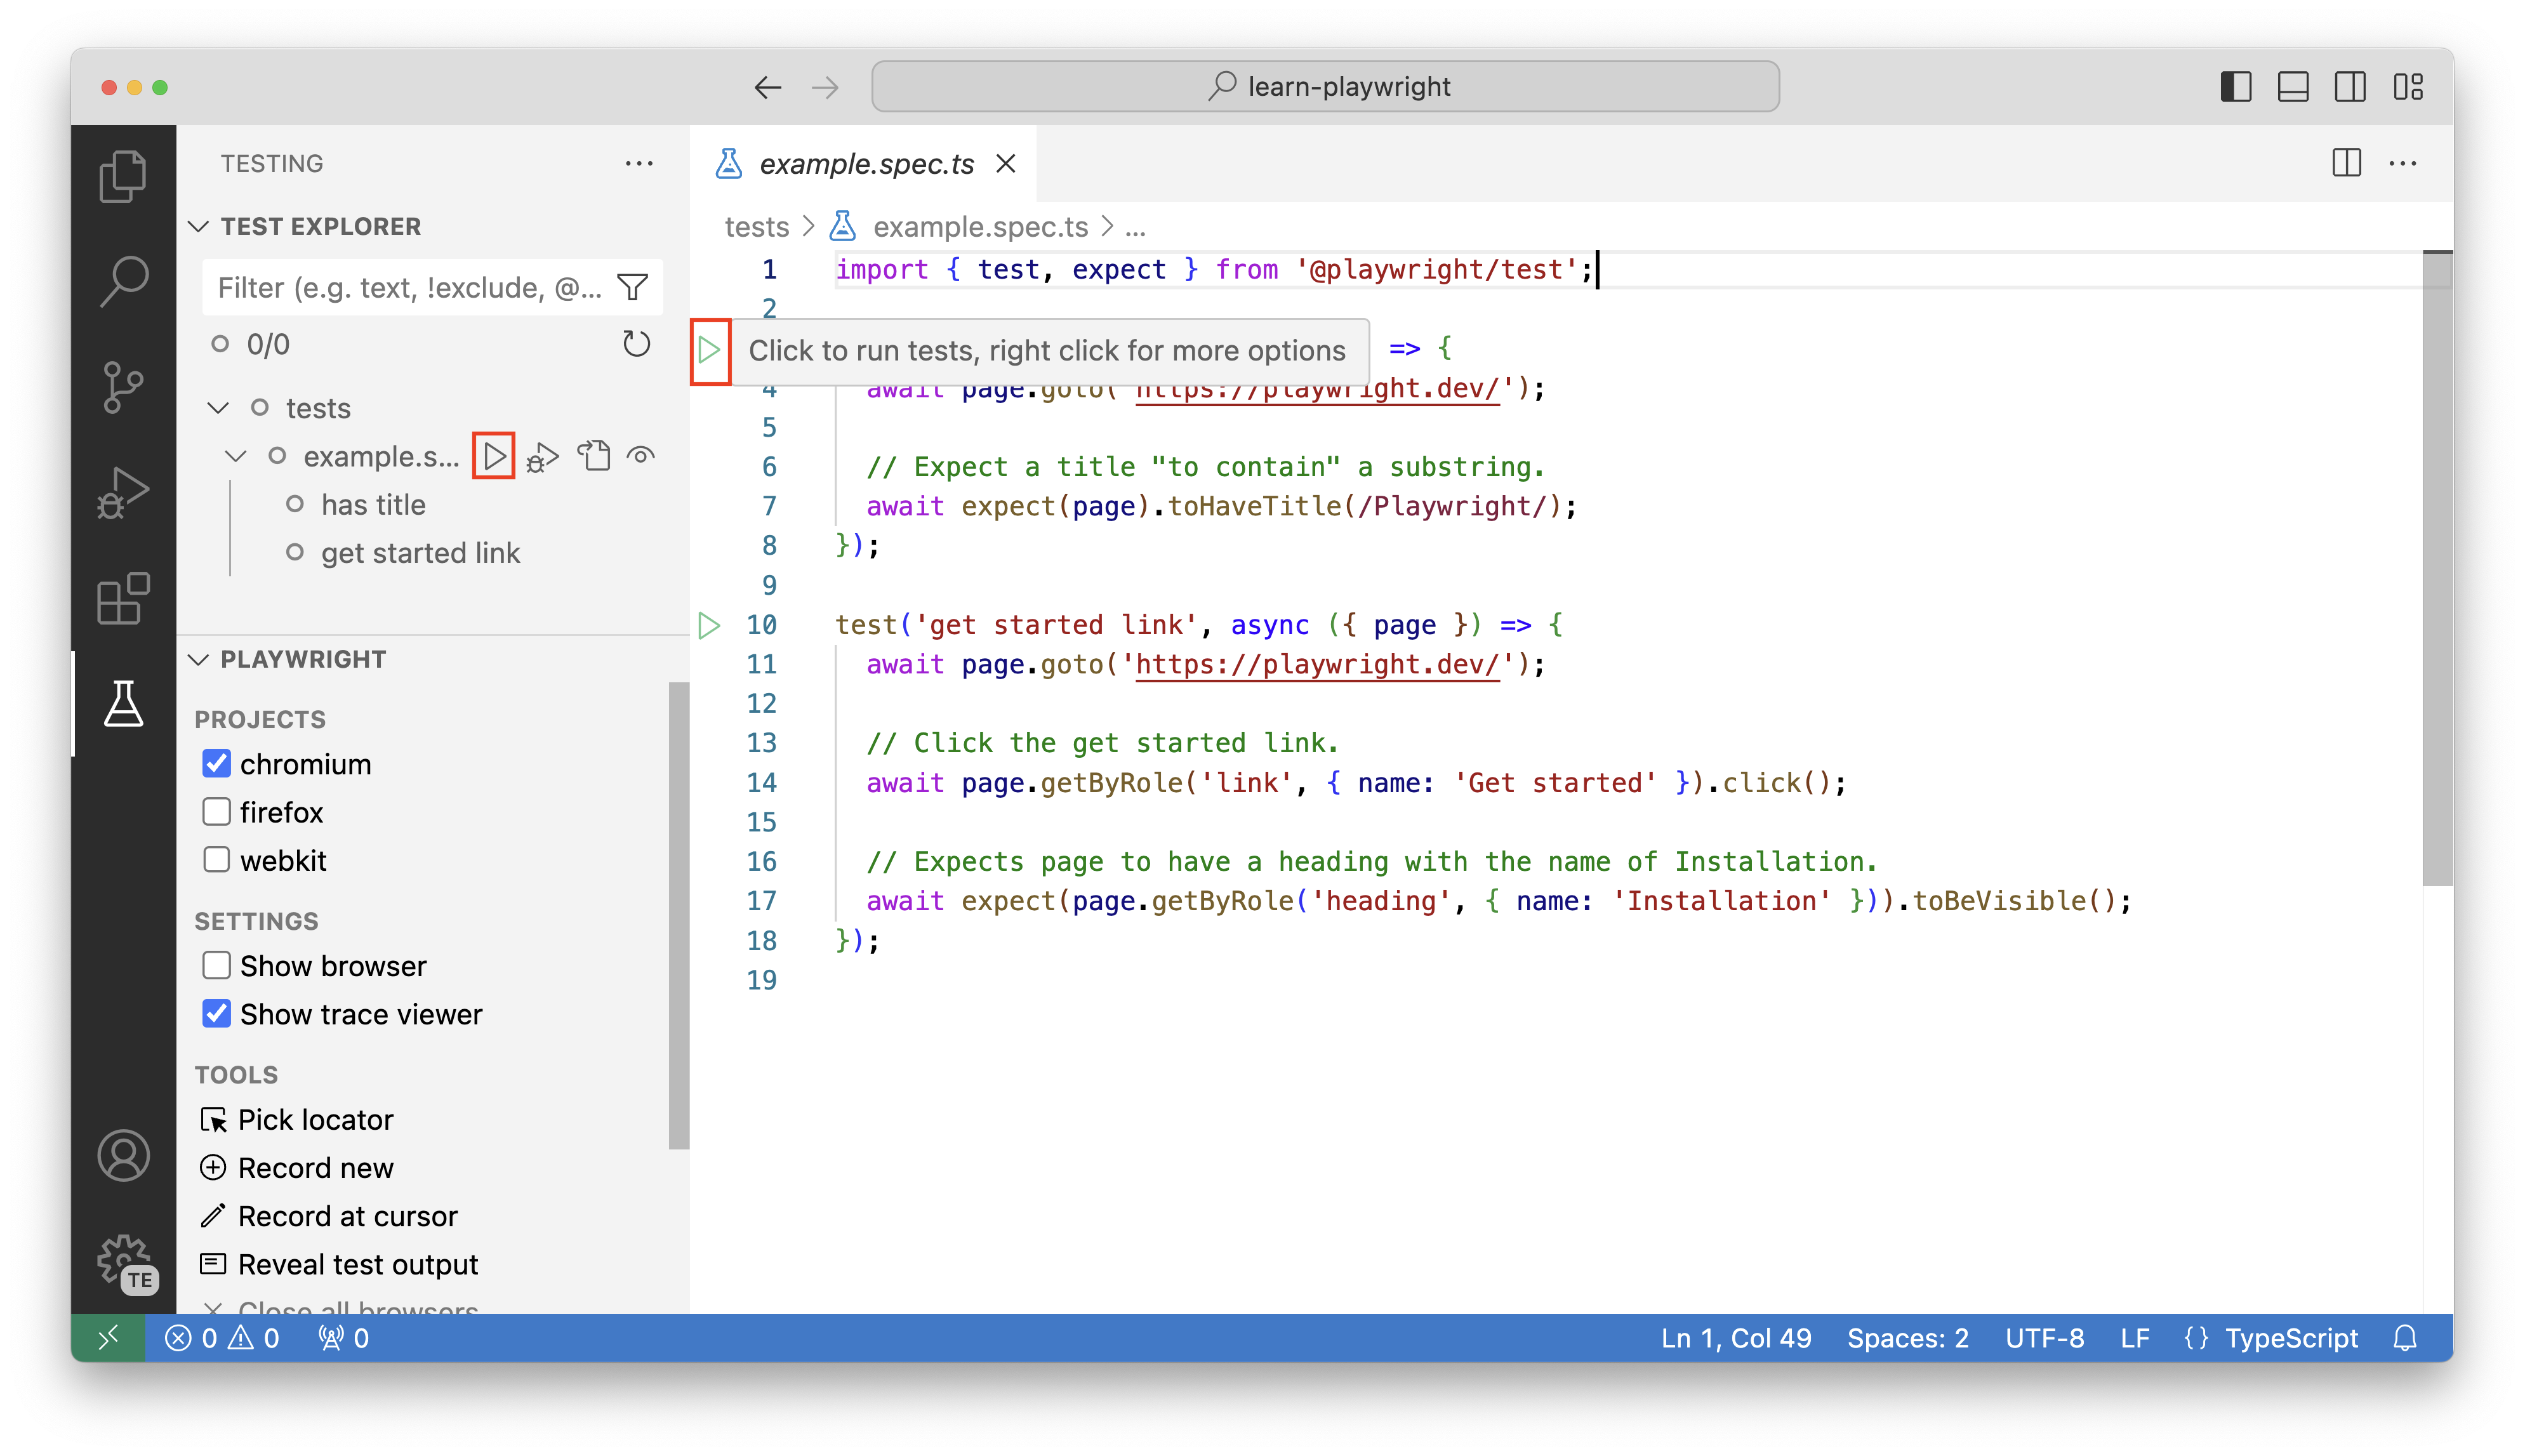
To run tests in headless manner (no browser window), make sure that the Show browser and Show trace viewer options are unchecked. Select the green play button on line 3 of the example.spec.ts file to run the first test. You can also select the gray play buttons in the Test Explorer sidebar to run all tests in the file or to run a specific test.
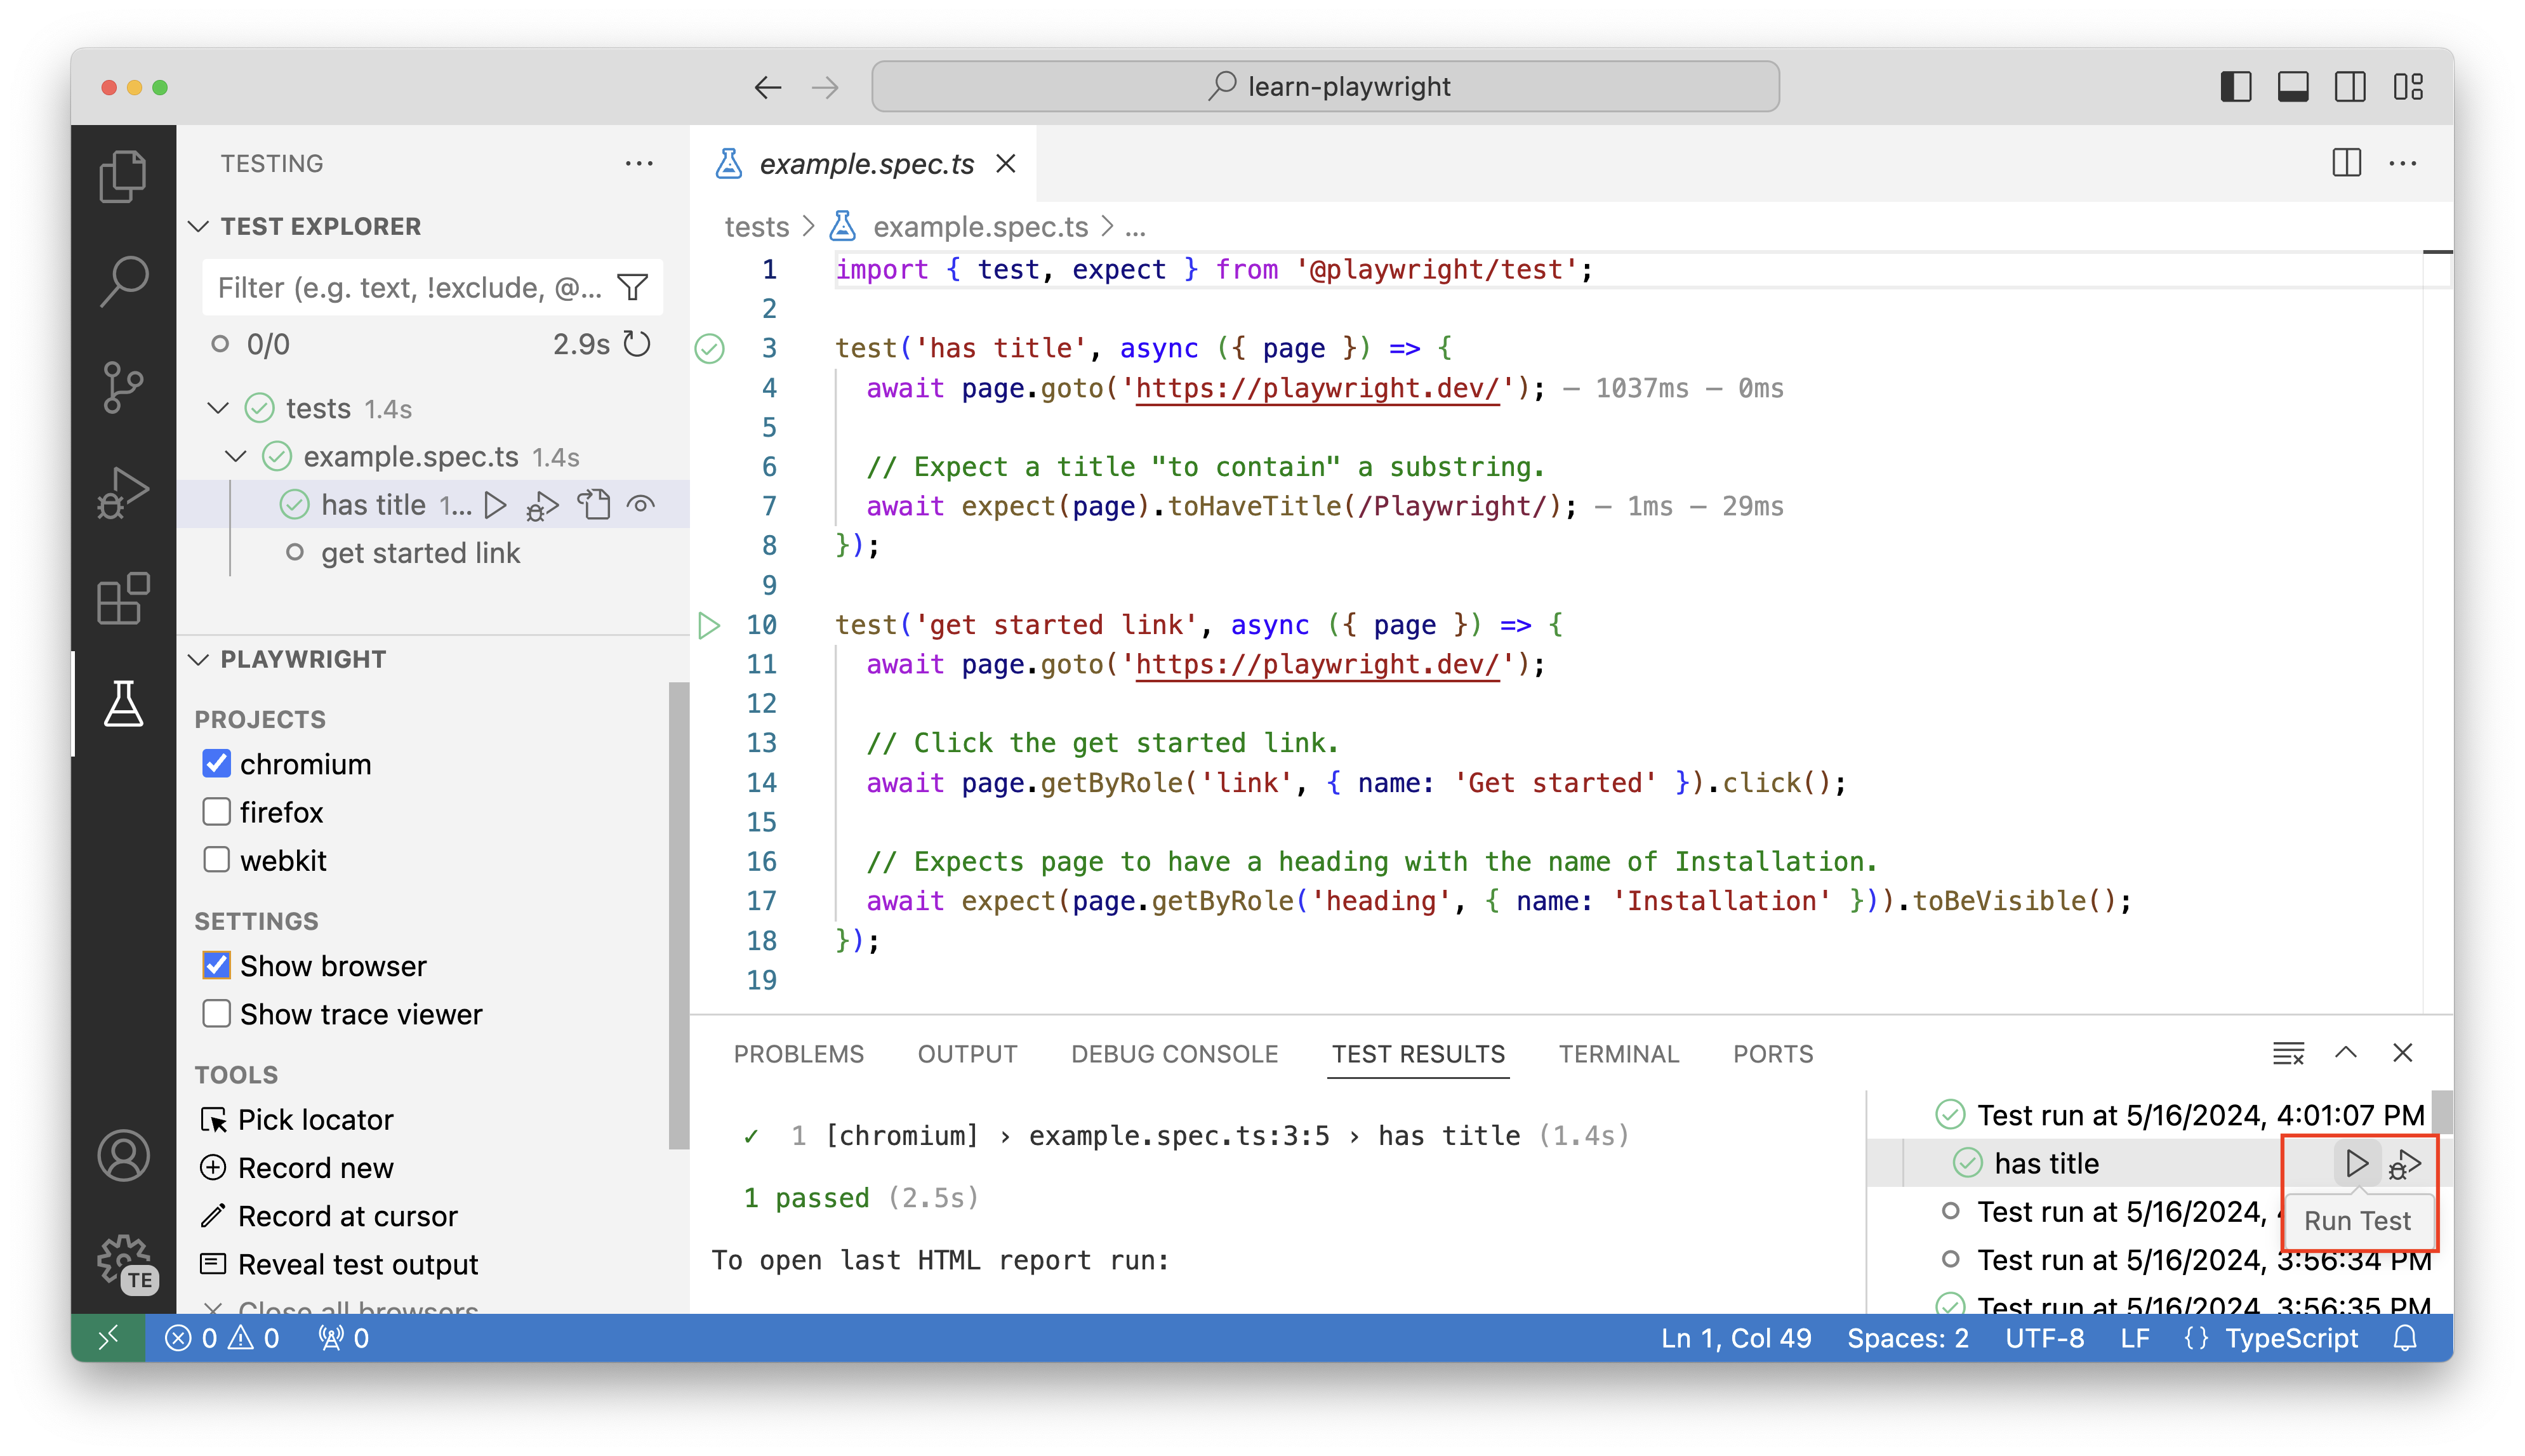
Once you run your tests, the Test Results tab opens a window where you can see the entire history of test executions. You can also drill down into a test and select Run test to rerun that specific test.
Show browser (headed)
If you want to run in headed mode, which means running your tests with a browser window open, you can check the Show browser box before running the tests.
Playwright is a very fast user, which can make it difficult to keep track of what's happening in the test when using Show browser. For debugging, we recommend using the Show trace viewer option.
Show trace viewer (headed)
Check the Show trace viewer box and select on the green play button for the second test. This launches the trace viewer window, which shows you a visual representation of the test execution.
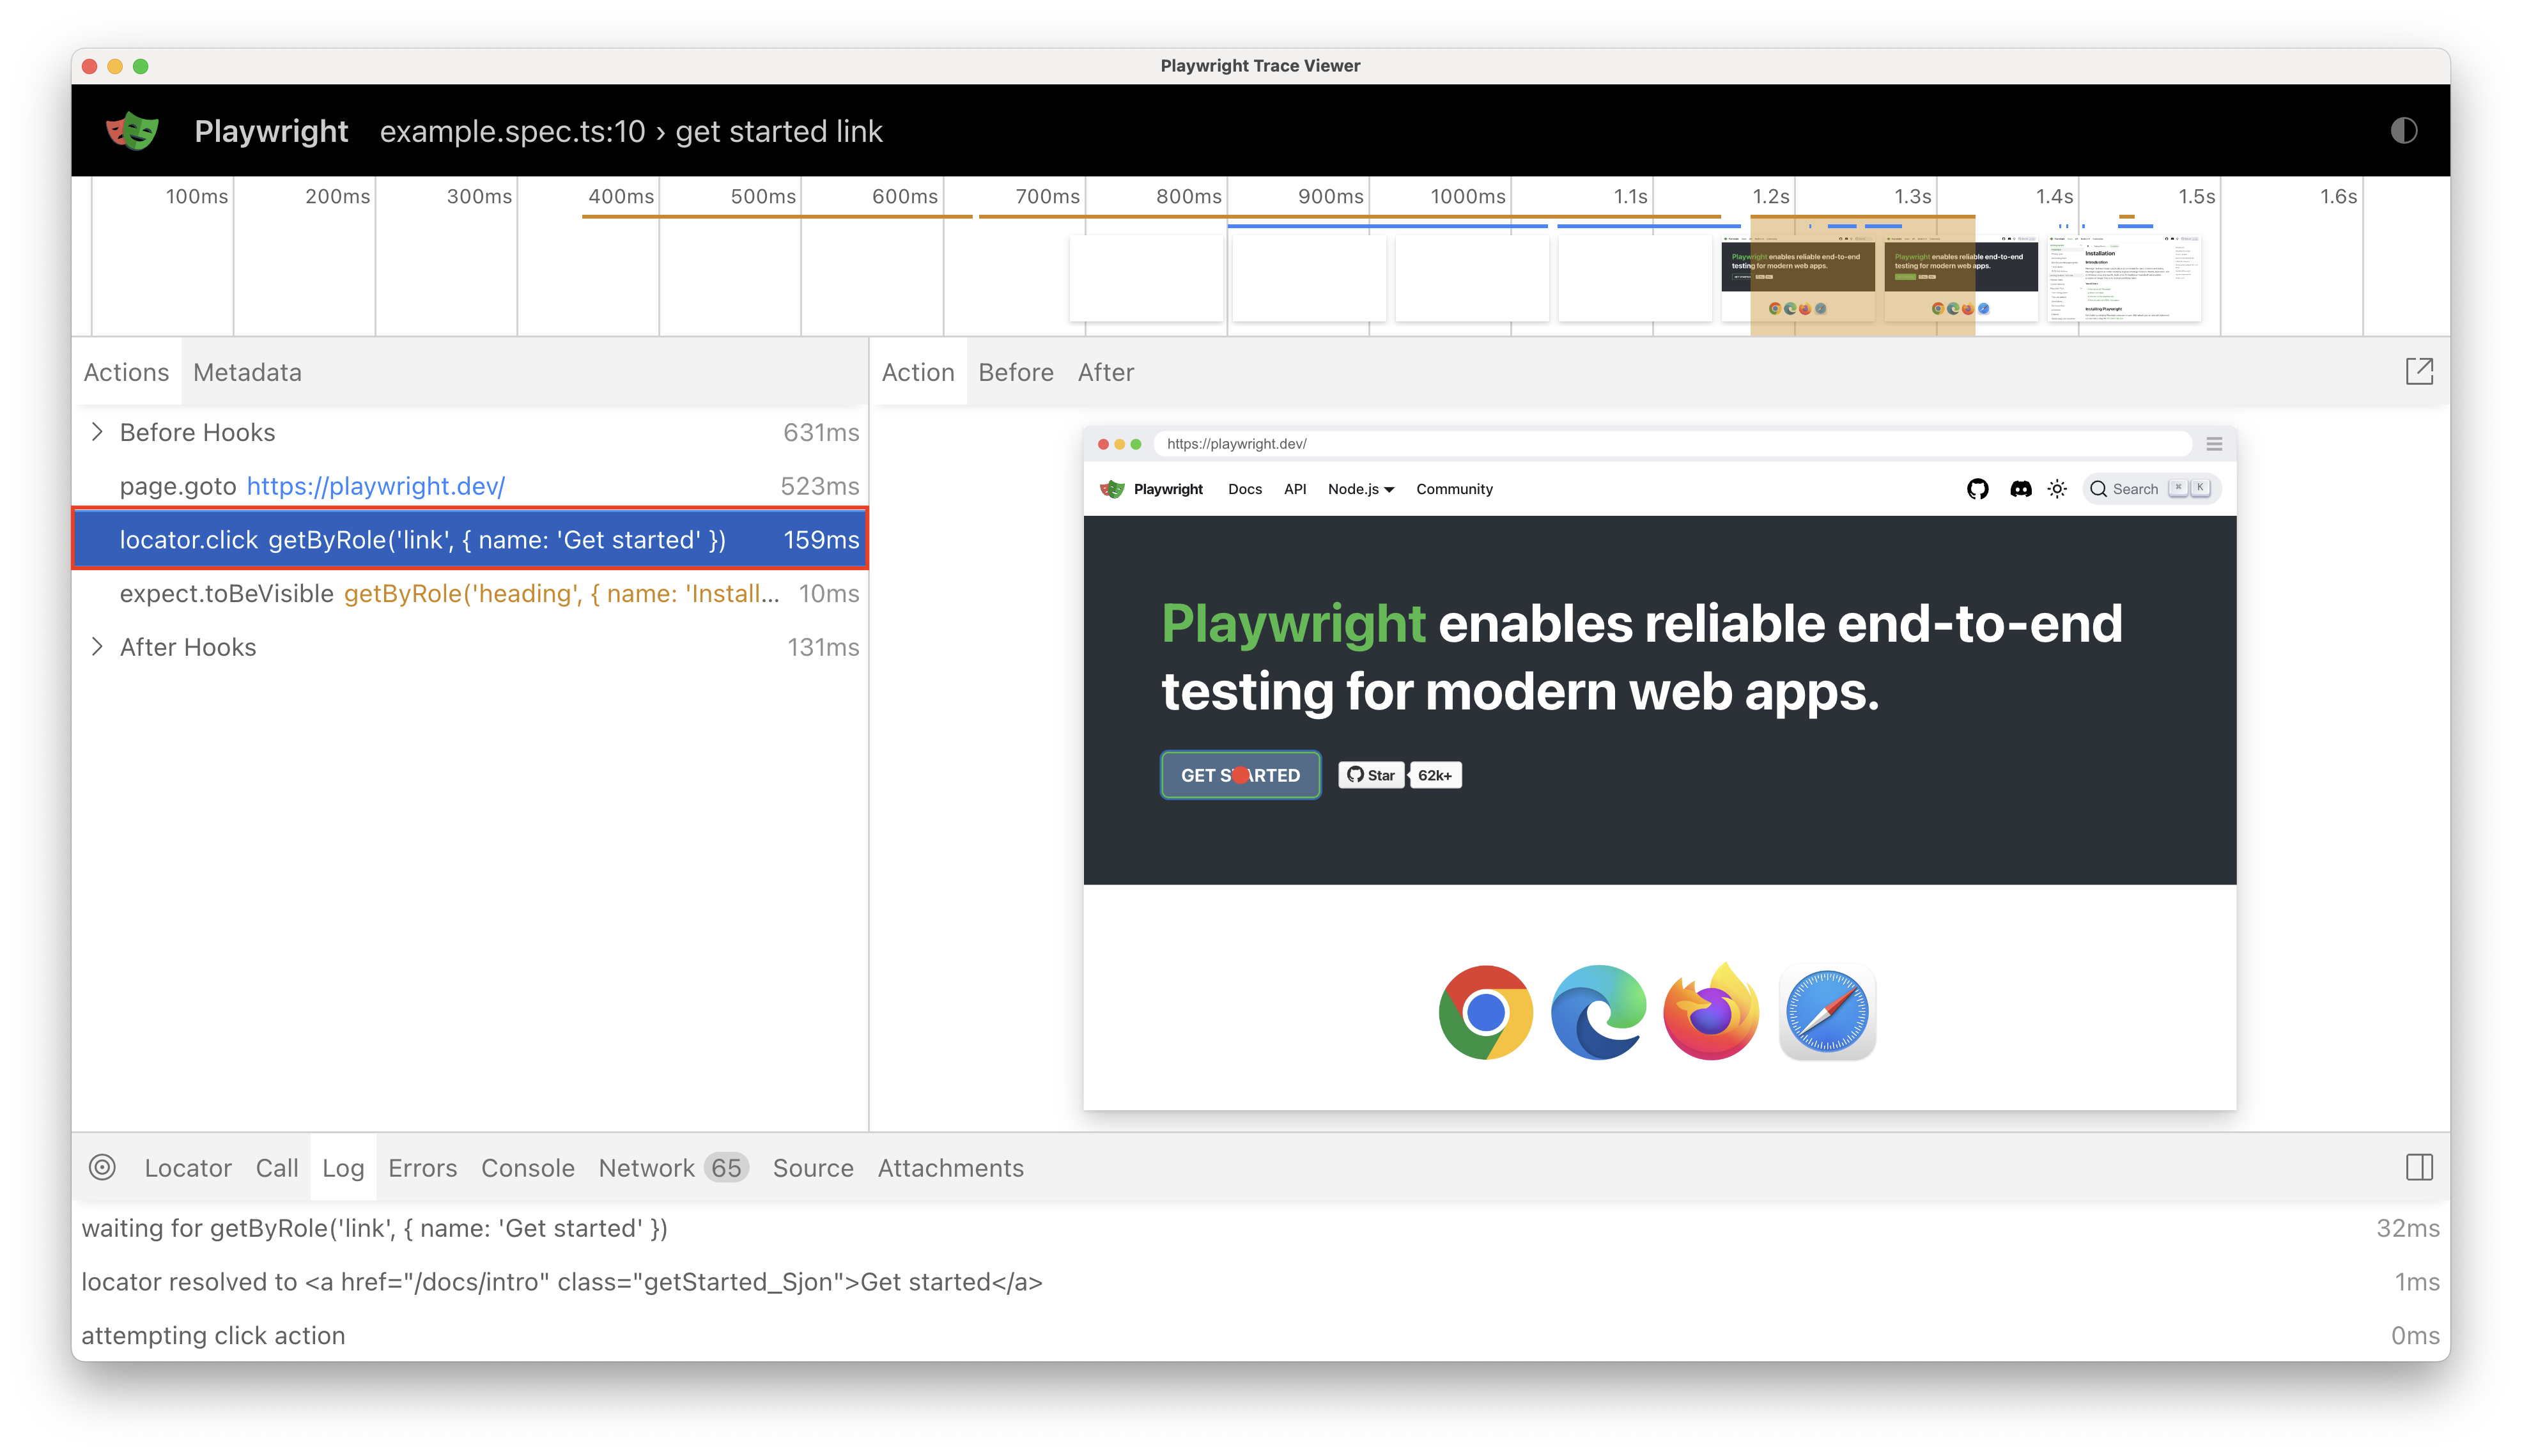
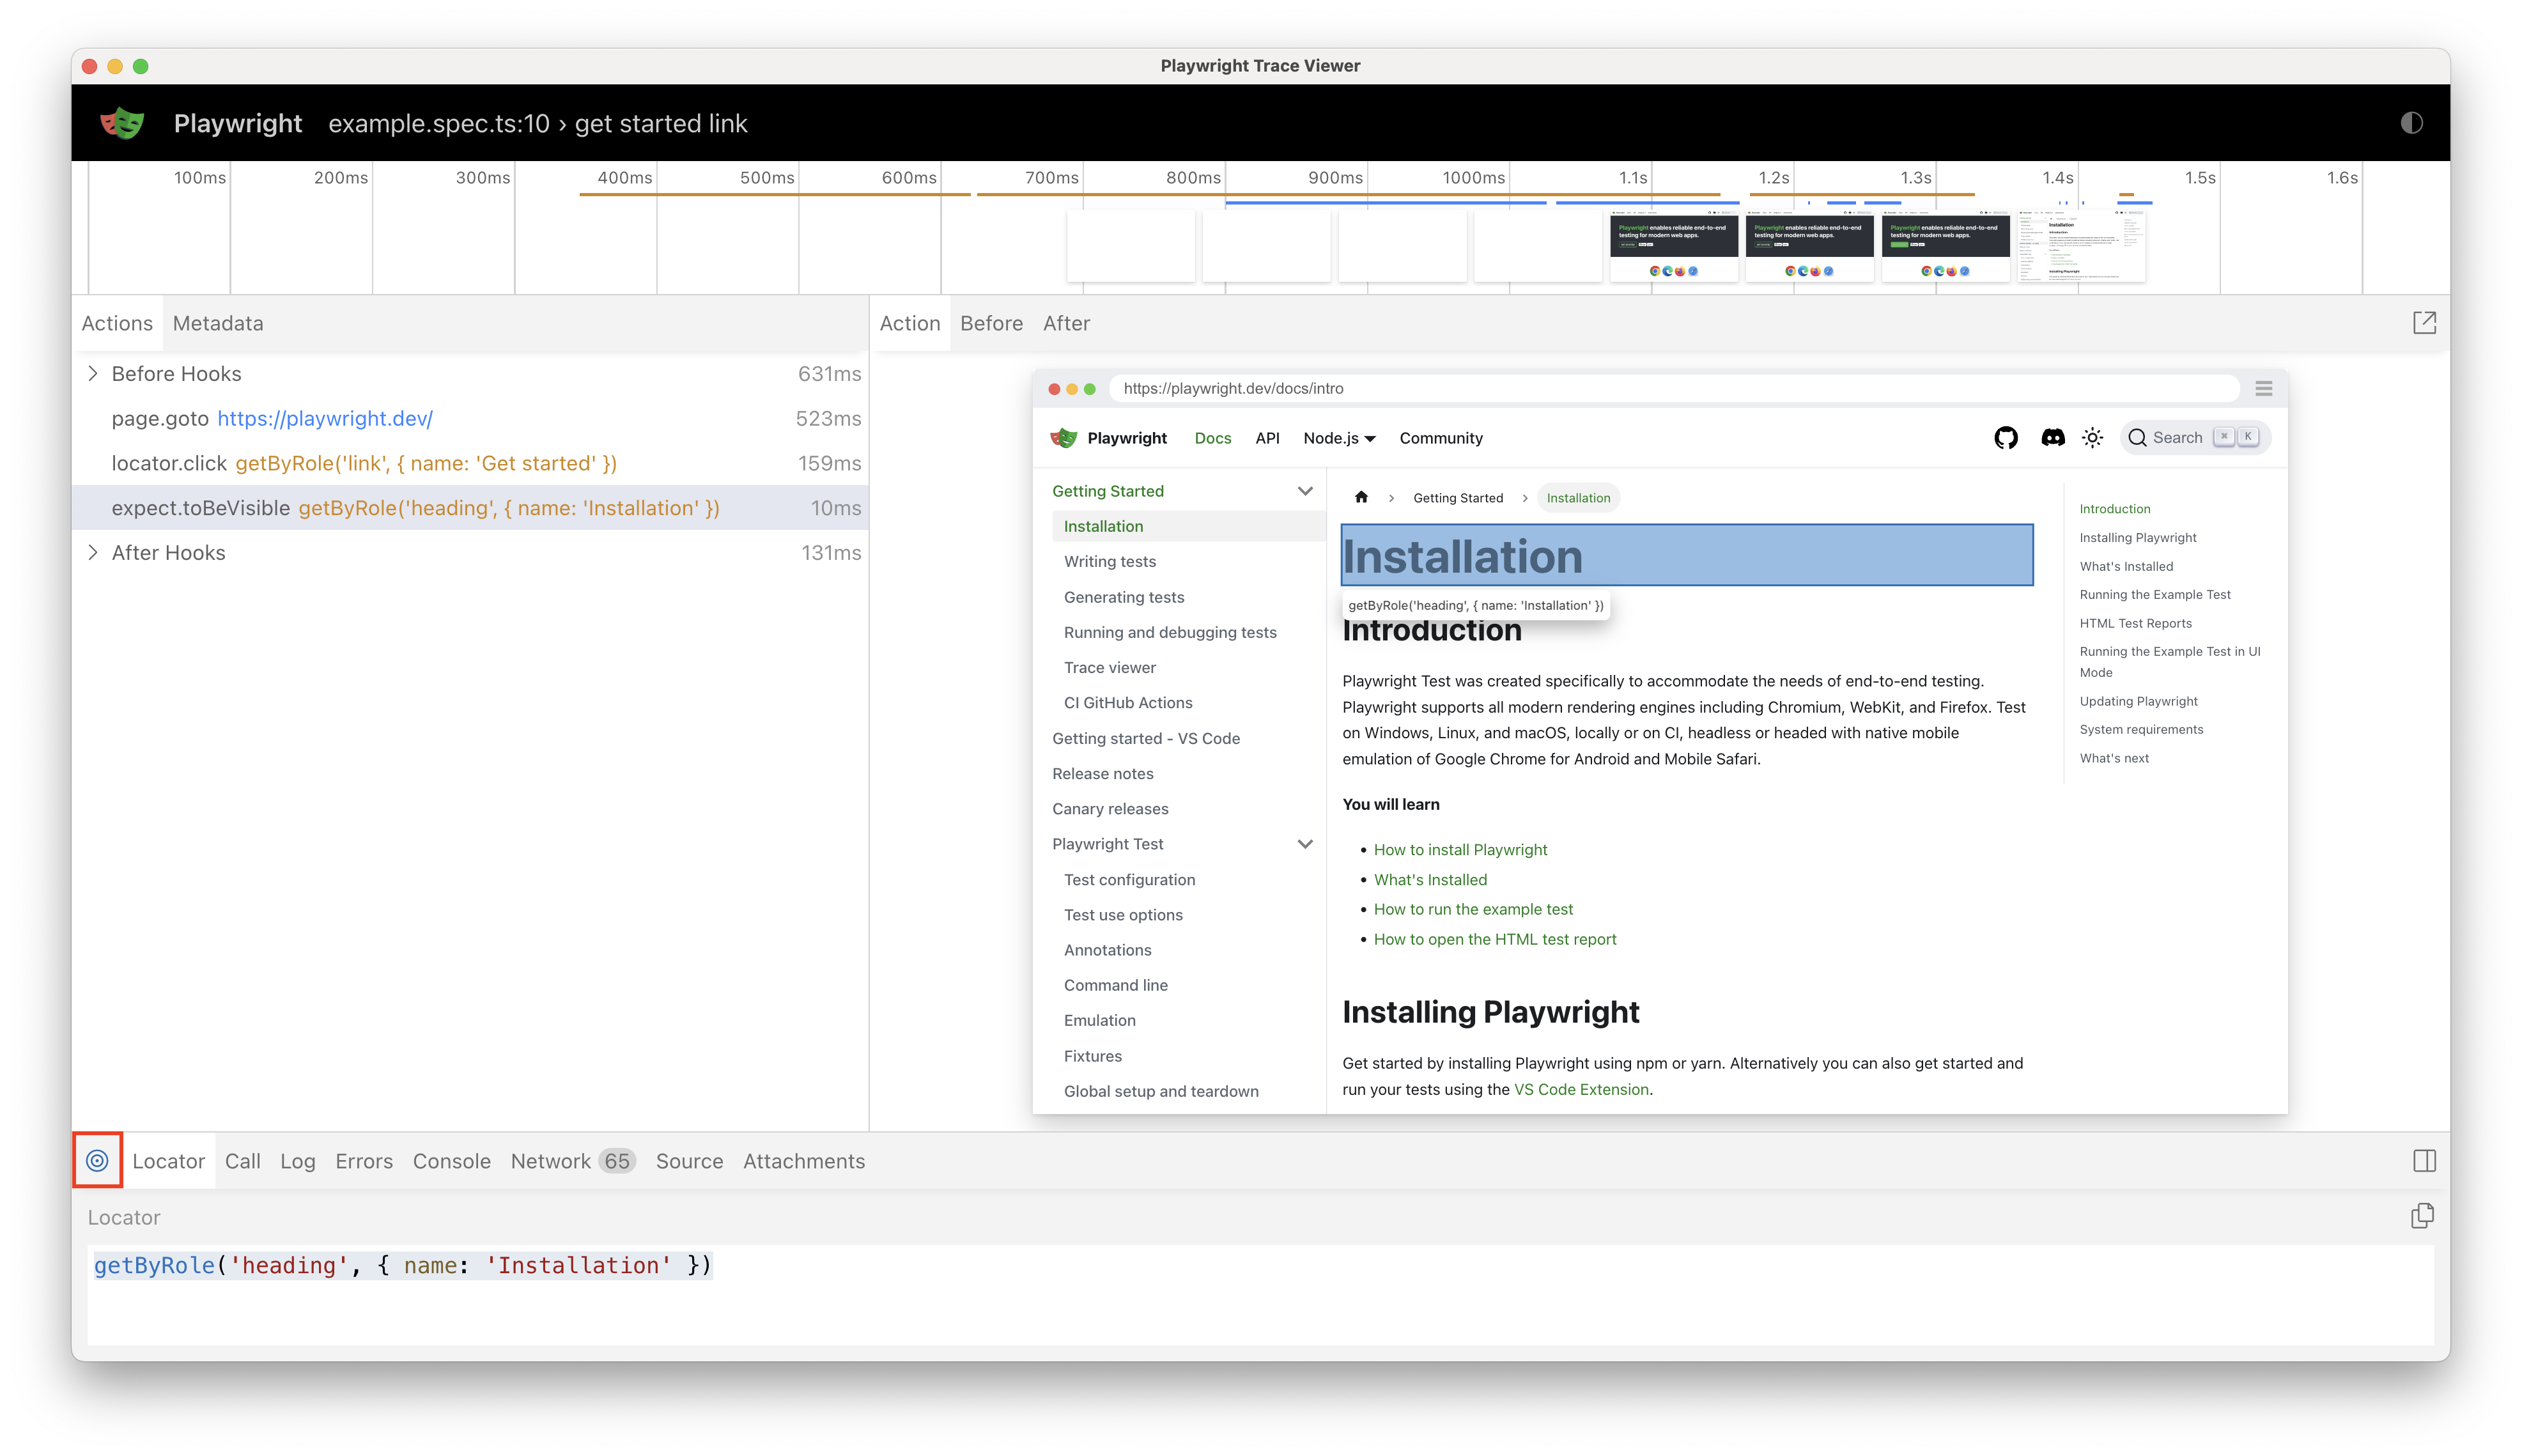
At the top, you'll see a timeline of the test that you can hover over to see the state of the browser. To select a specific time range to focus on, select and drag the timeline.
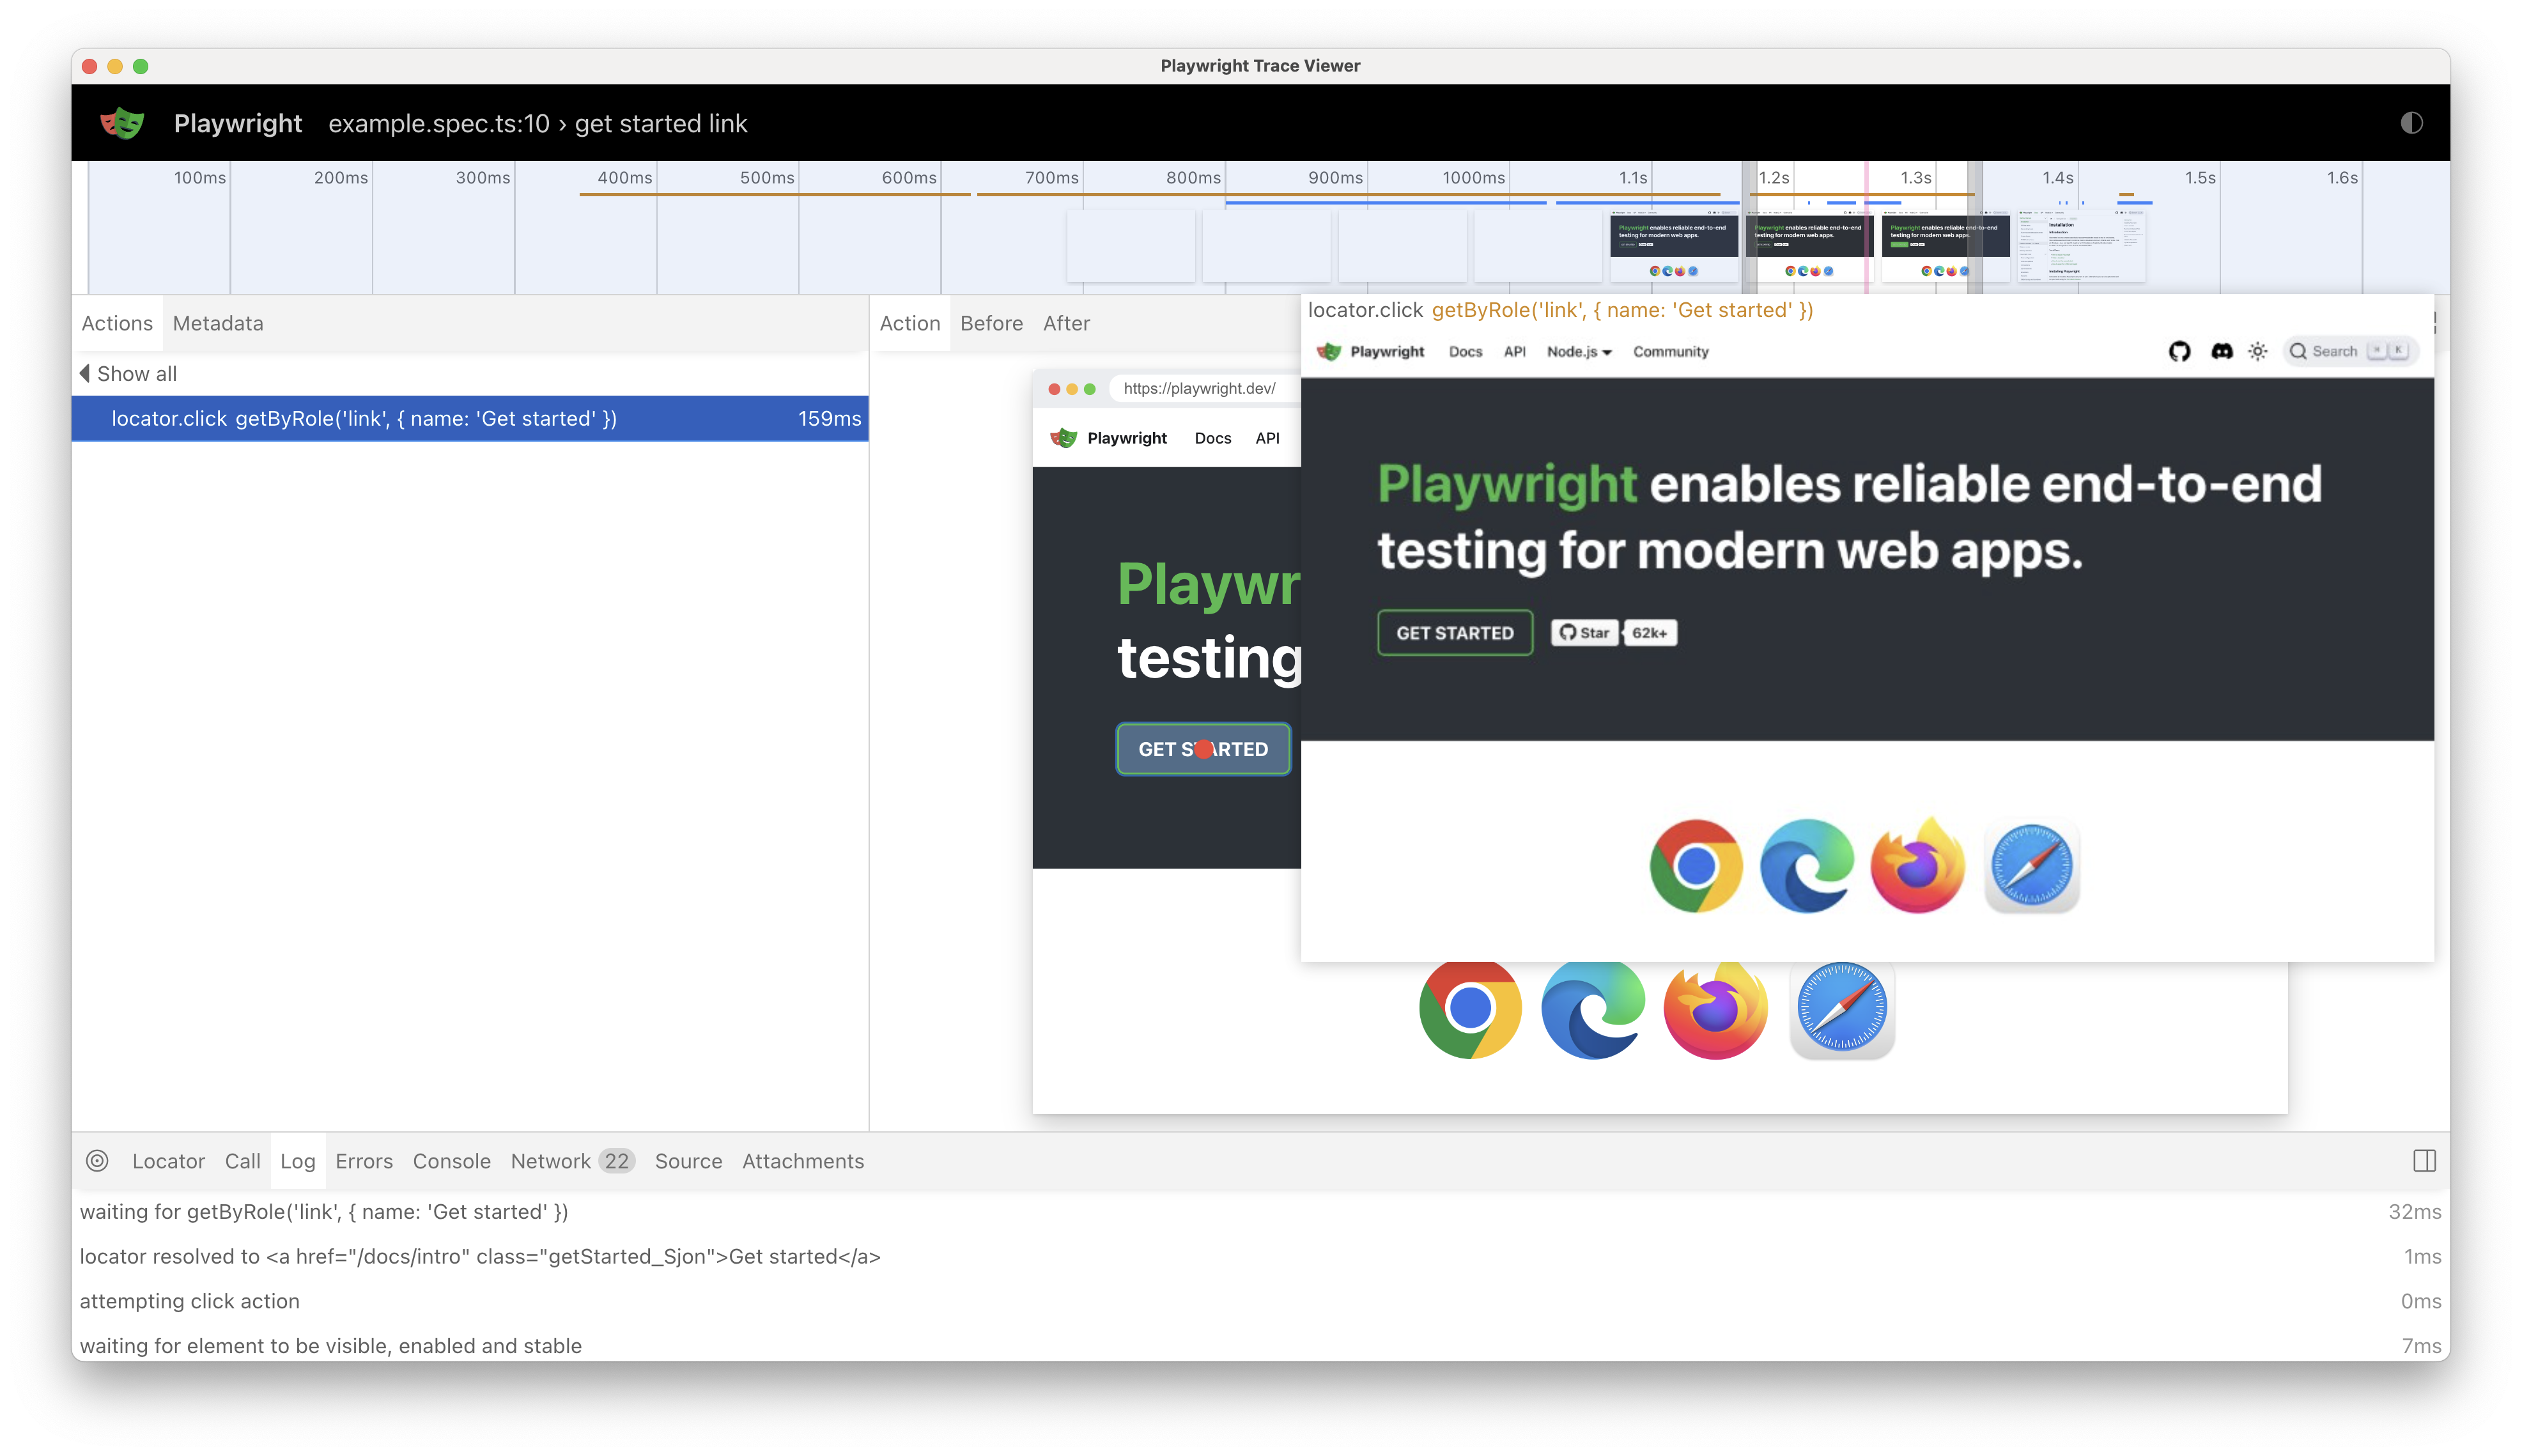
In the left sidebar, you can see the actions that were performed during the test execution. If you select the locator.click action, you'll see a red dot on the Get Started button in the DOM snapshot.
Next, select the expect.toBeVisible assertion, and you'll see our DOM snapshot changed to show the Installation page with a highlight on the heading we're asserting. Above the DOM snapshot, you can select the Before and After buttons to see the state of the DOM before and after the action was performed.
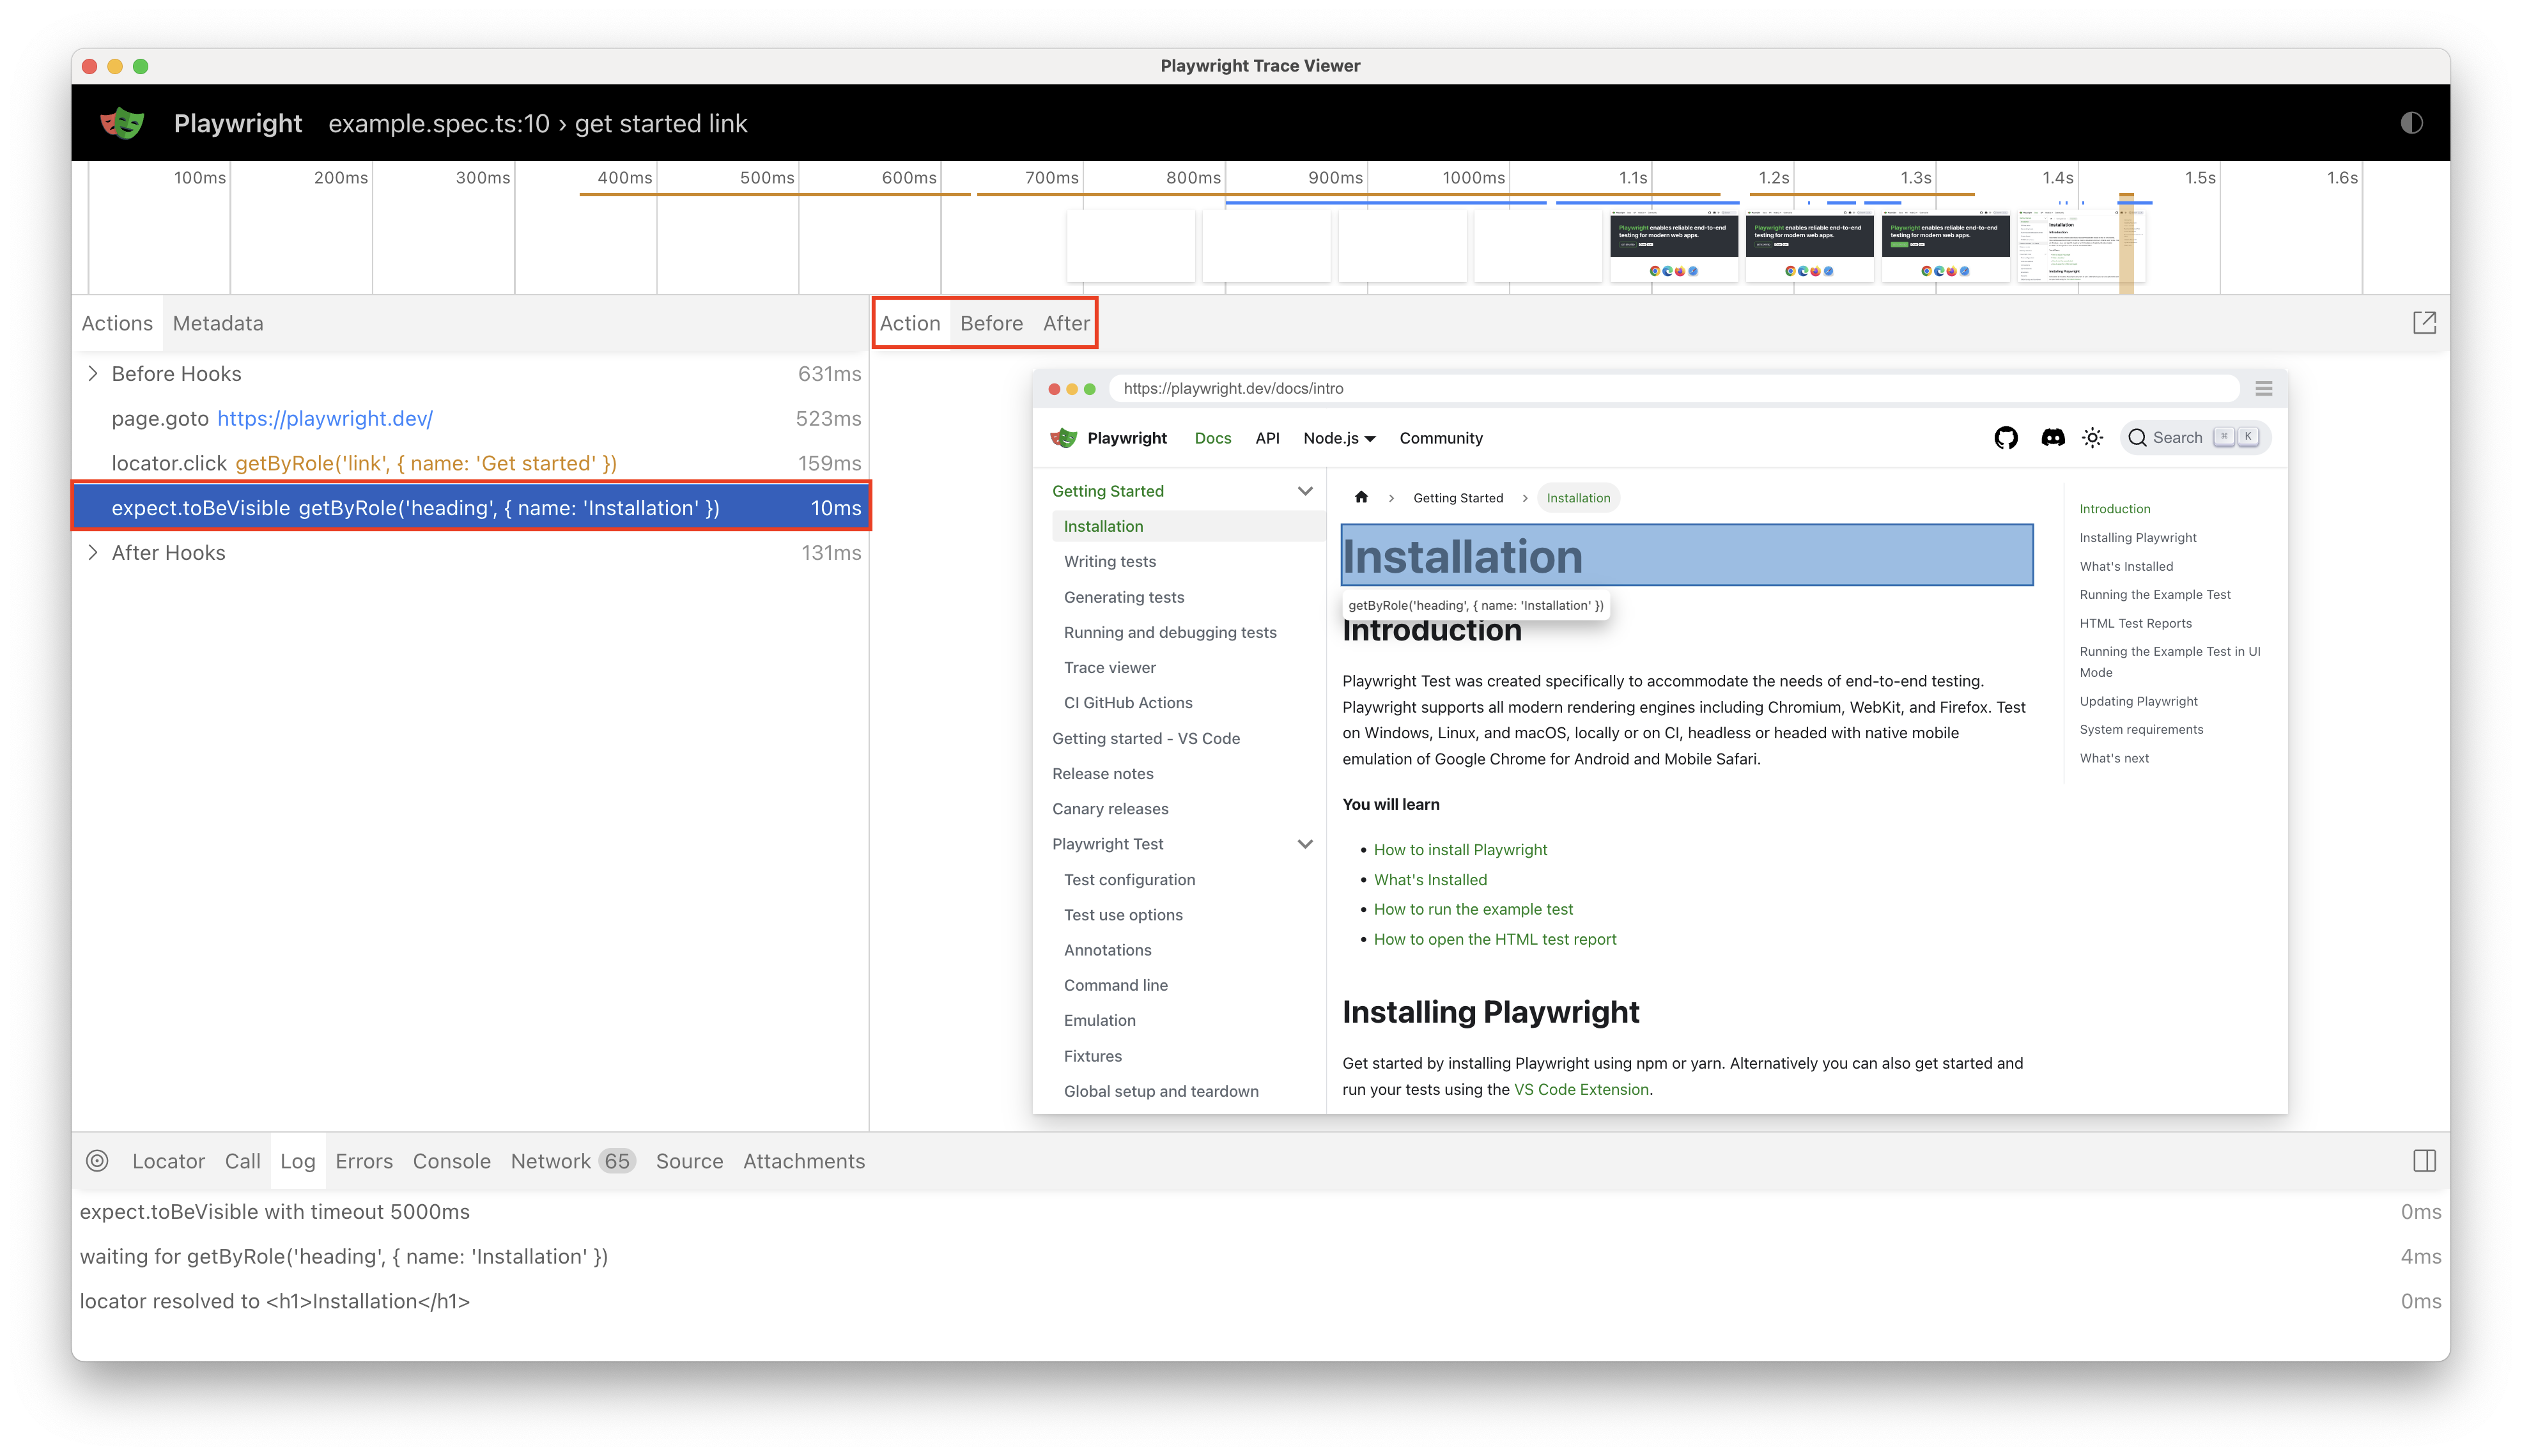
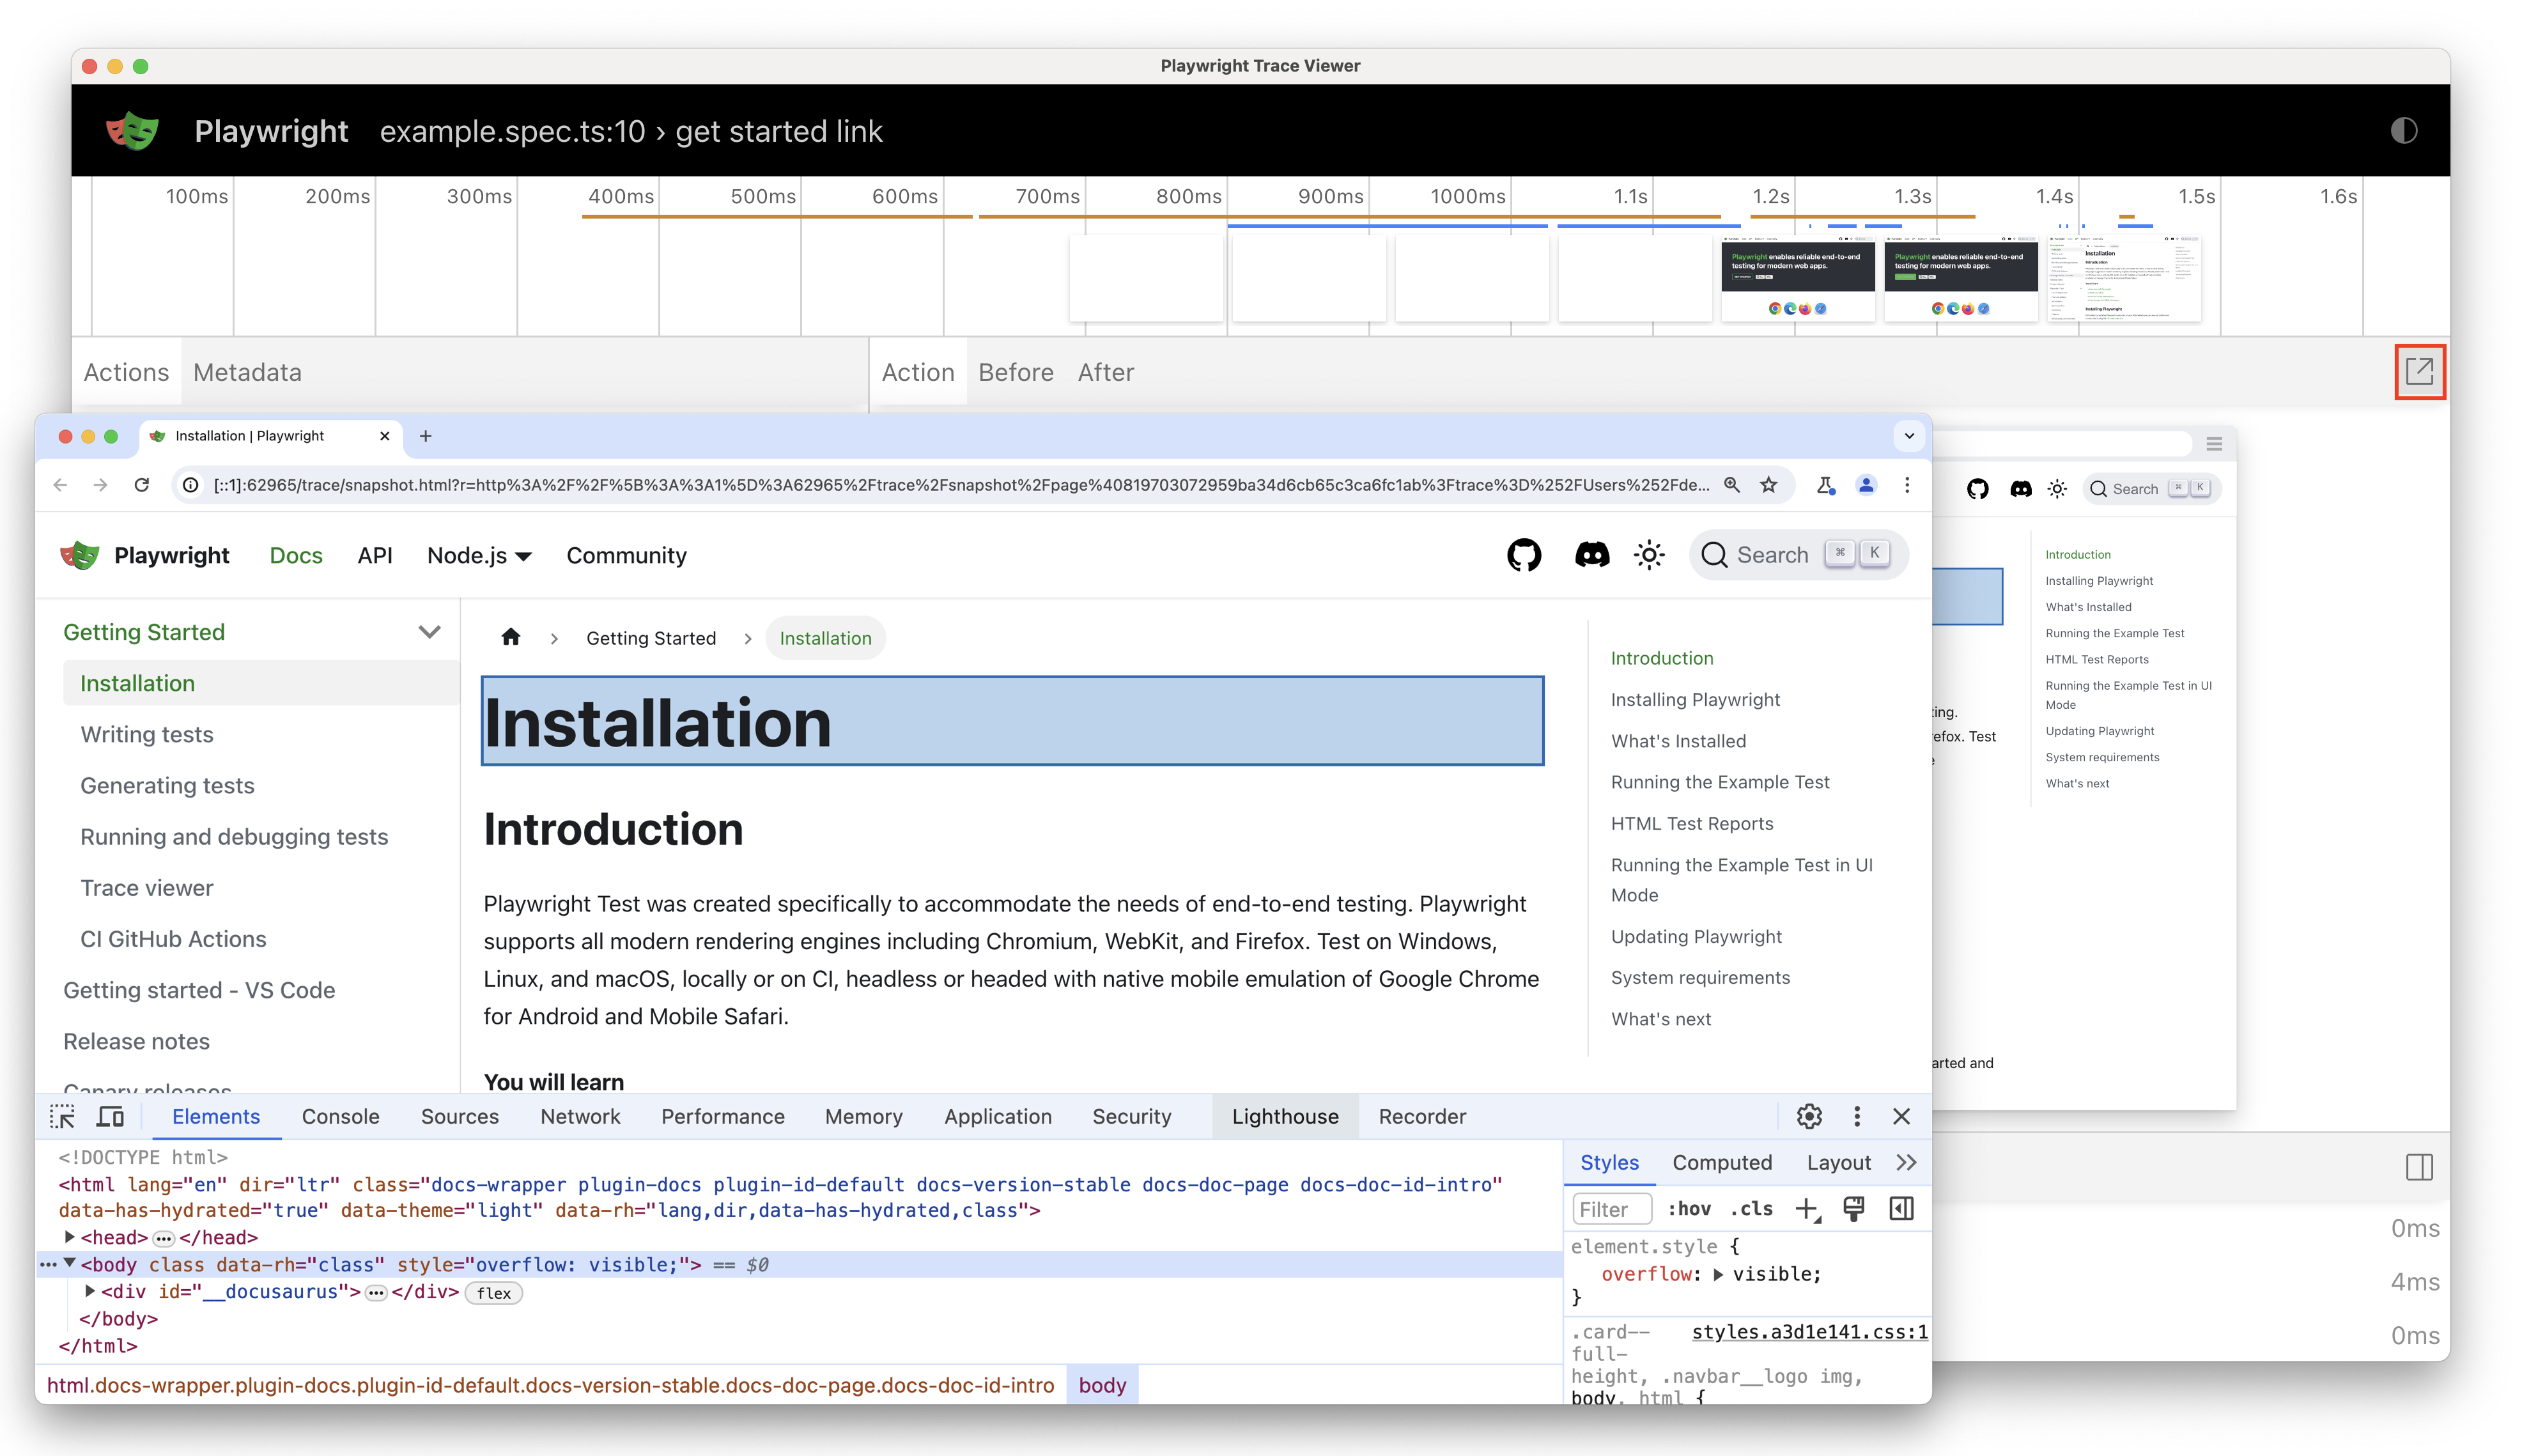
You can pop out the DOM snapshot to a separate window by selecting the pop out icon in the top right corner. It can be useful if you want to inspect the DOM while debugging your test.
Speaking of debugging, you can also pick a locator from the DOM snapshot by selecting the Pick Locator button in the bottom panel. Then, hover over elements on the DOM snapshot to see the locator for that element. Selecting an element it adds it to the Locator box at the bottom of the trace viewer, where you can edit it before copying it to your clipboard.
Feel free to explore on your own the rest of the features of the trace viewer such as the Call, Console, Network, and Source tabs.
Debug tests
For debugging, we recommend running your tests with the Show trace viewer option and using your test's trace to better understand what's happening.
However, with the Visual Studio Code extension, you can also debug your tests right in Visual Studio Code, see error messages, create breakpoints, and live debug your tests. Learn more from the documentation or watch the following video to get a sense of the debugging support.
Generate tests
CodeGen generates your tests for you as you perform actions in the browser, making it the simplest way to get started for authoring tests for complex workflows.
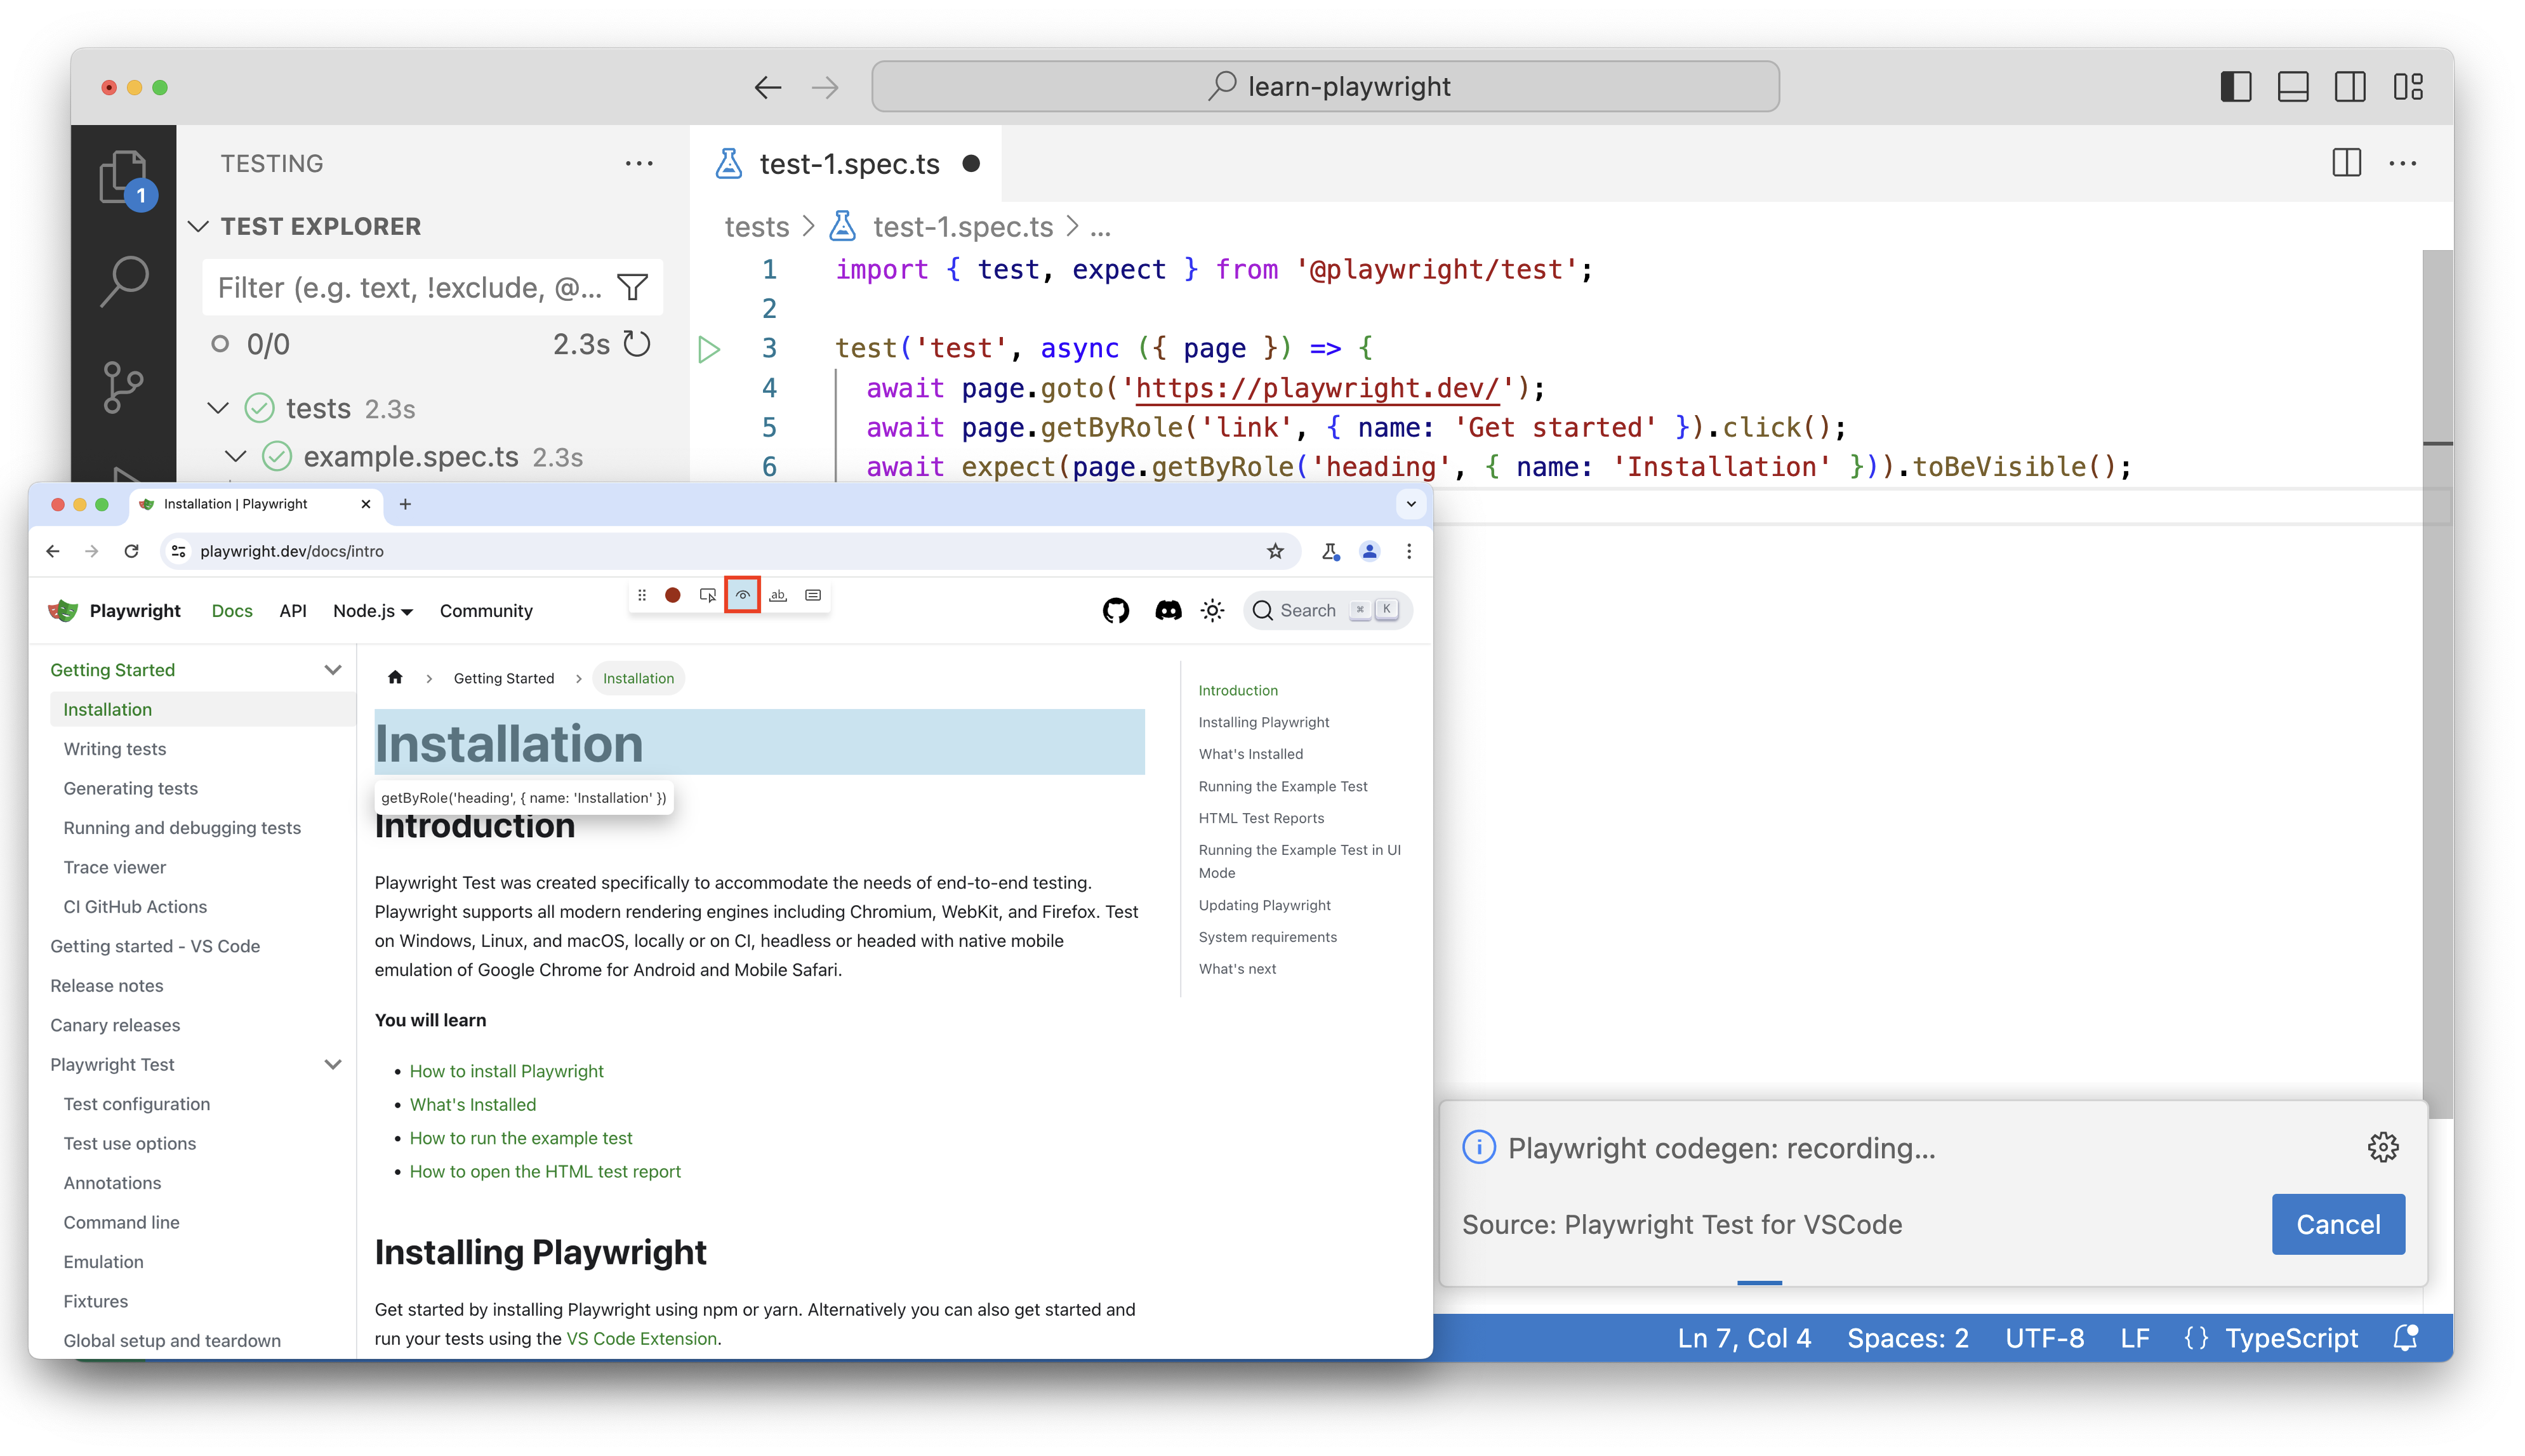
To generate a test, select the Record new button in the testing sidebar in Visual Studio Code. This opens up a browser window where you can perform actions that will be recorded and turned into a test. You'll also notice that a new file in the tests folder is created with the generated test.
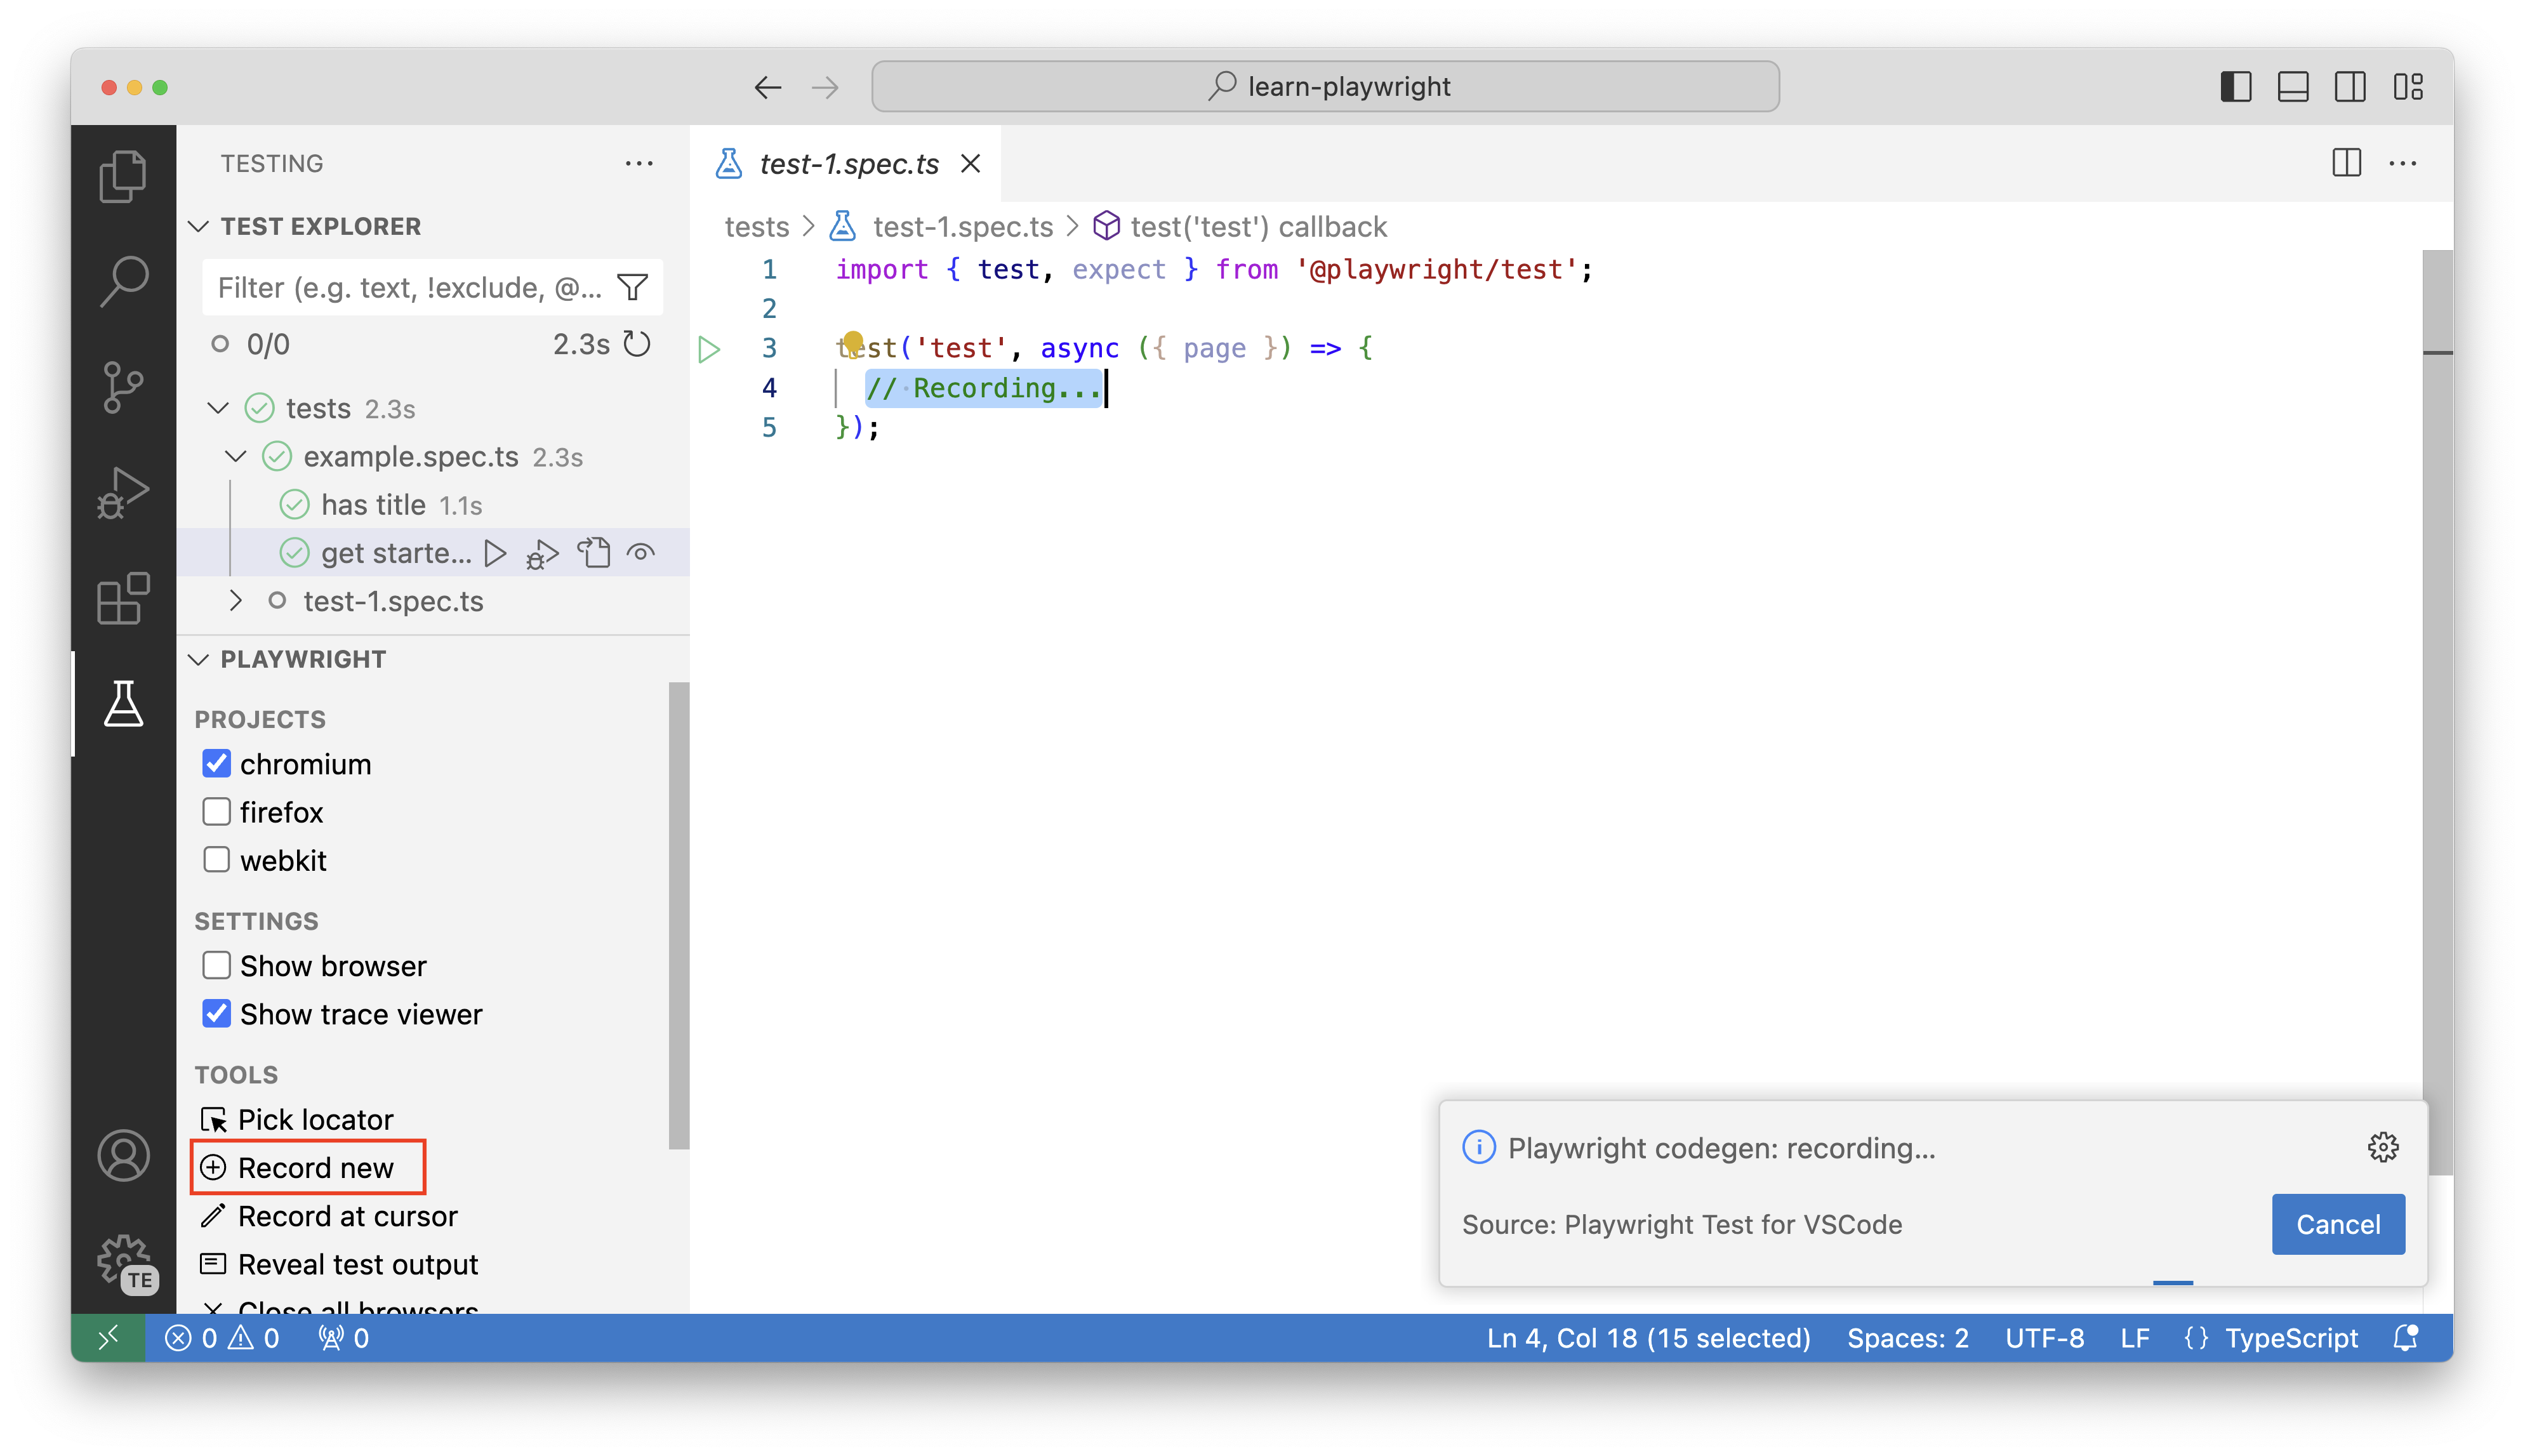
Type in a URL in the browser window and start performing actions like a user would. You'll see the actions being recorded in the test file in VS Code.
Let's recreate the simple test we ran earlier by going to the Playwright website and selecting the Get Started button. We can then select the Assert Visibility icon from the Codegen toolbar and select the Installation heading to assert that it's visible.
Learn more on generating tests in the following video.
Next steps
In this section, you learned how to use the Visual Studio Code extension to find and run tests, and how to work with the trace viewer to get a more visual experience for debugging tests.
You also learned how Visual Studio Code provides richer tools for generating tests using the Record a New Test, Pick Locator, and Record at Cursor features. Now, it's time to apply your Playwright Fundamentals learnings in a guided project to build an end-to-end test specification for our sample app.