Create a date table
Make sure you still use the report you created titled MyFirstPowerBIModel from the previous units. You use it to create a Date table.
Create a date table
Go to the Table view by selecting the Table icon in the navigation menu to the left of Power BI Desktop.
From the ribbon at the top of the screen, select the Table Tools tab.
Then, choose New Table from the menu at the top of the screen.
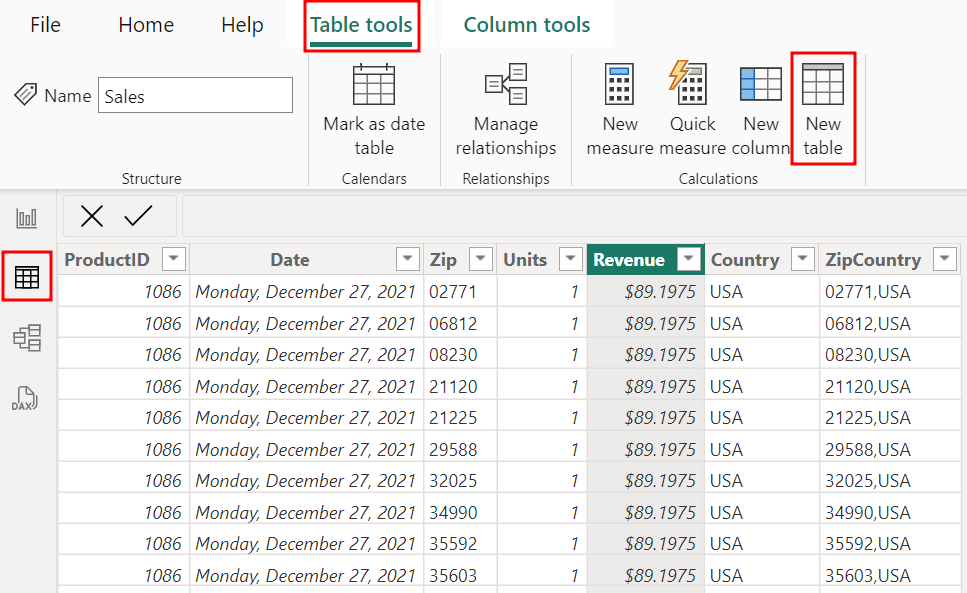
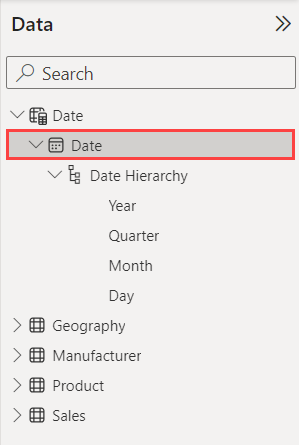
You see a new table called "Table" is created in the Data pane to the right of the Power BI Desktop and the formula bar opens at the top of your screen.
Enter the following formula in the formula bar, then hit Enter on your keyboard:
Date = CALENDAR(DATE(2014,1,1), DATE(2022,12,31))You're using two DAX functions: the CALENDAR function, which accepts the start and end data, and the DATE function, which takes the year, month, and day fields.
For this scenario, you need to create dates from 2014 to 2021 (since we have data for those years). We can also add more fields, like Year, Month, Week, etc., to the table by using other DAX functions.
In the Data pane, select the Date field in the Date table.
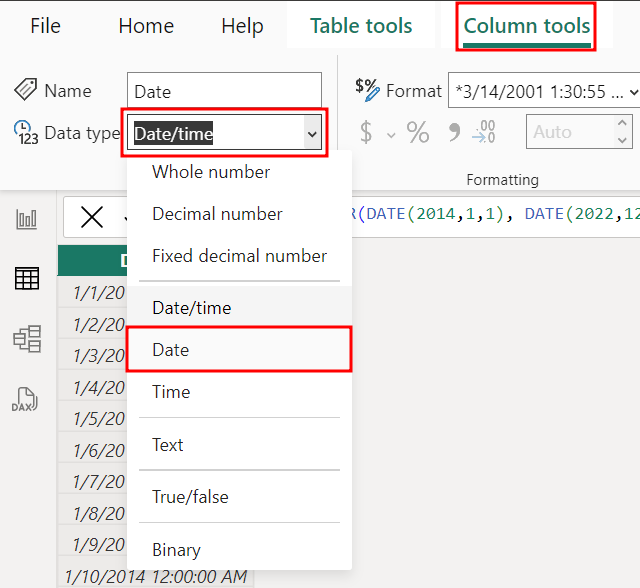
The Date field is in the Date/Time data type, but you need it to be the Date data type. To change it, select the Column Tools tab from the ribbon.
Then, choose the Data type drop-down and select Date.
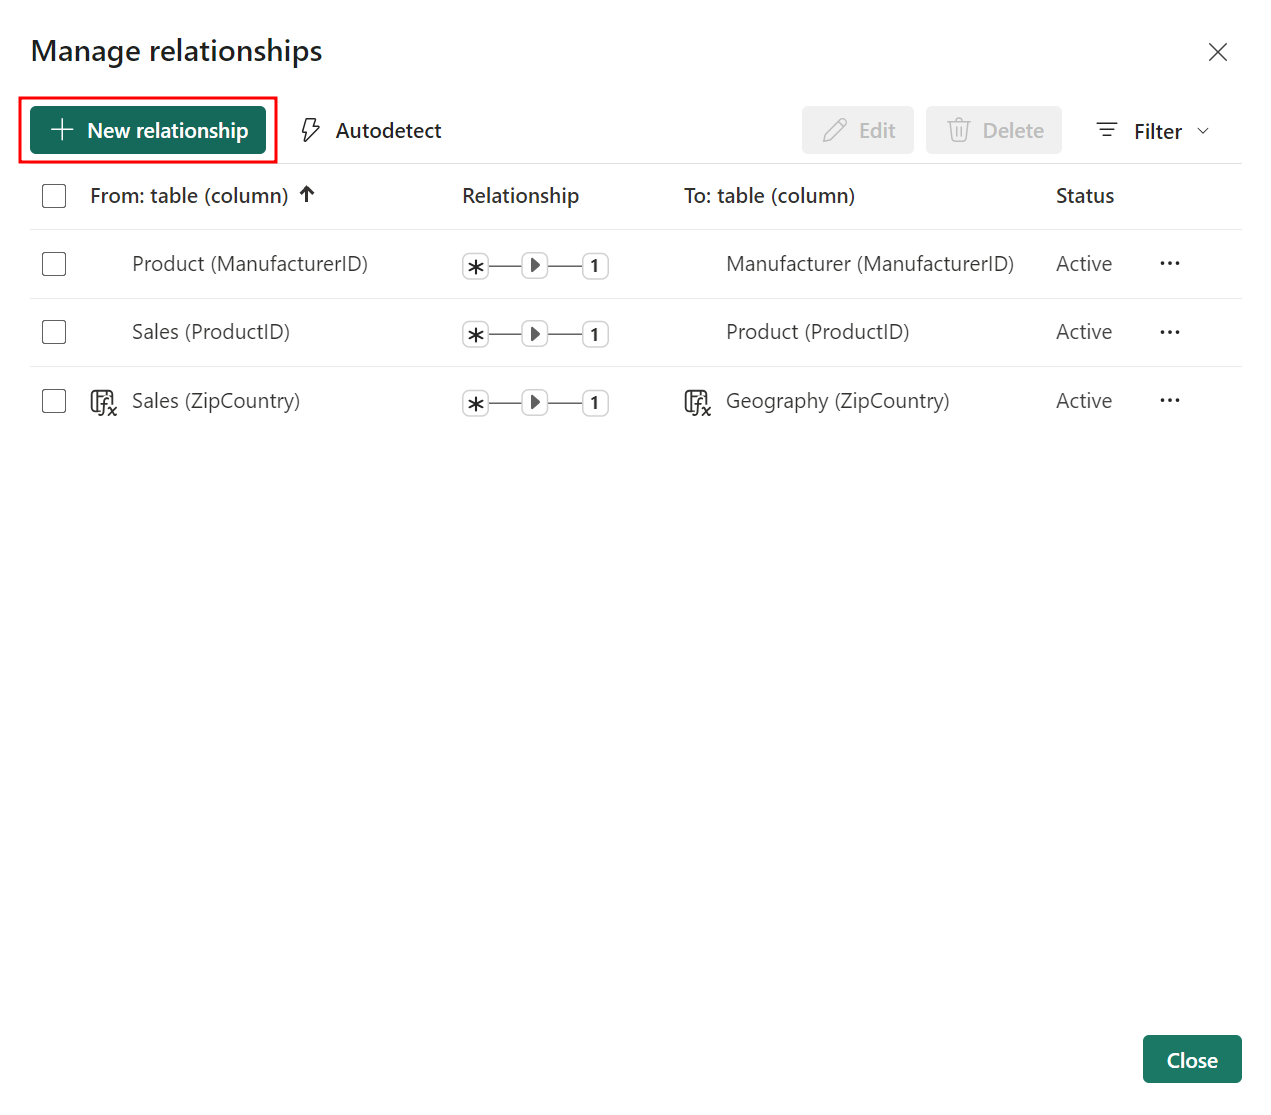
Now, you need to create a relationship between the Date and Sales tables. From the ribbon, select the Column Tools tab, and then choose Manage Relationships.
The Manage Relationships dialog box opens. Select the + New relationship button.
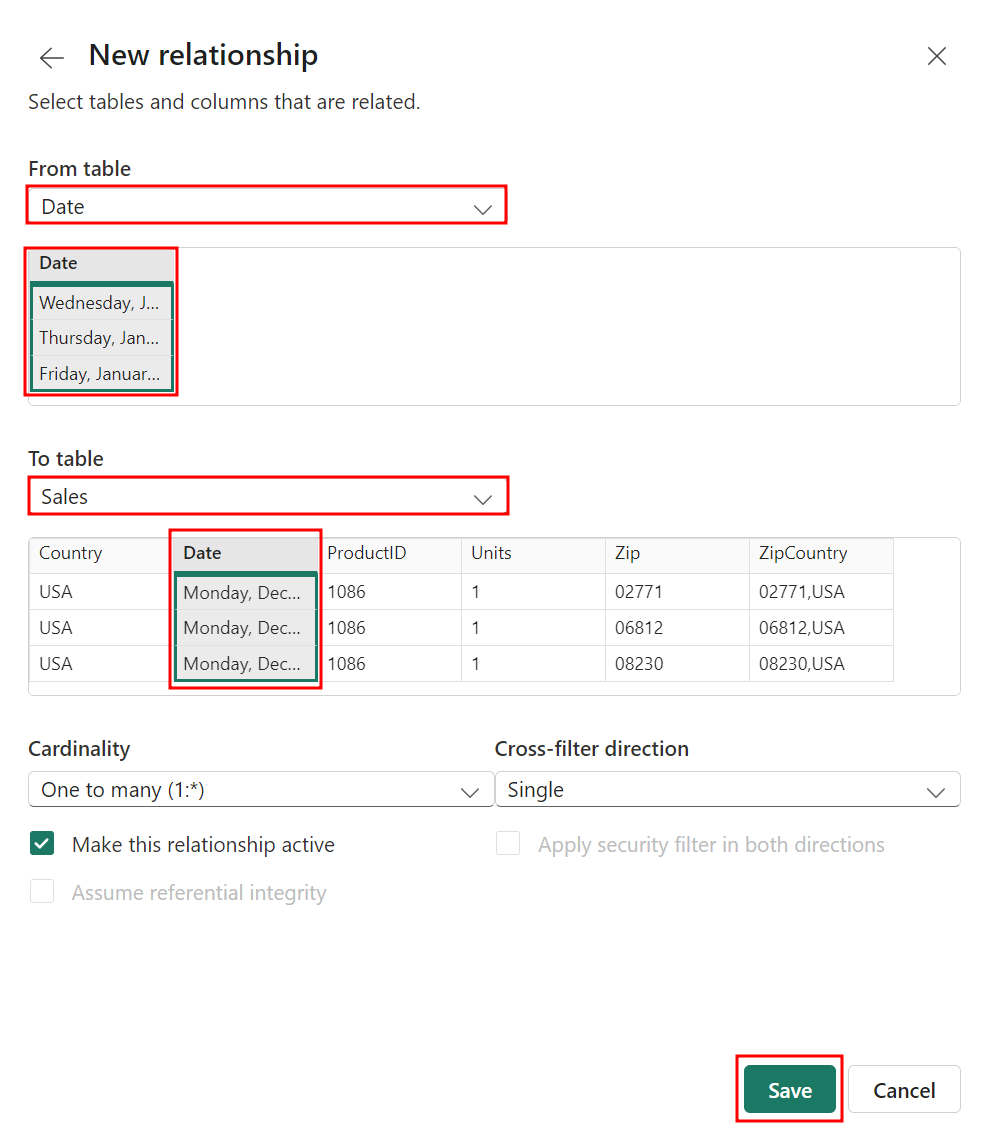
Then, the New Relationship dialog box opens. Select Date from the top dropdown menu.
Select Sales from the second dropdown menu.
Highlight the Date field in both tables by multi-selecting.
Then, select Save to close the New relationship dialog box.
Select the Close button to close the Manage relationships dialog box.
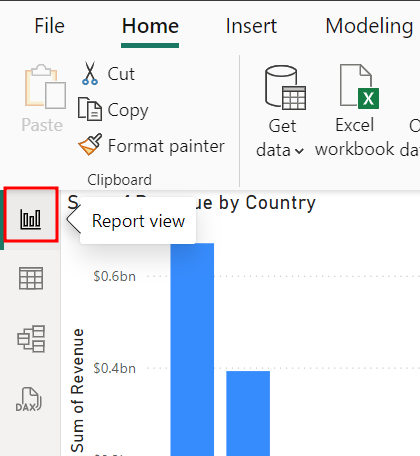
Now, select the Report view icon in the left navigation menu to go to the Report view.
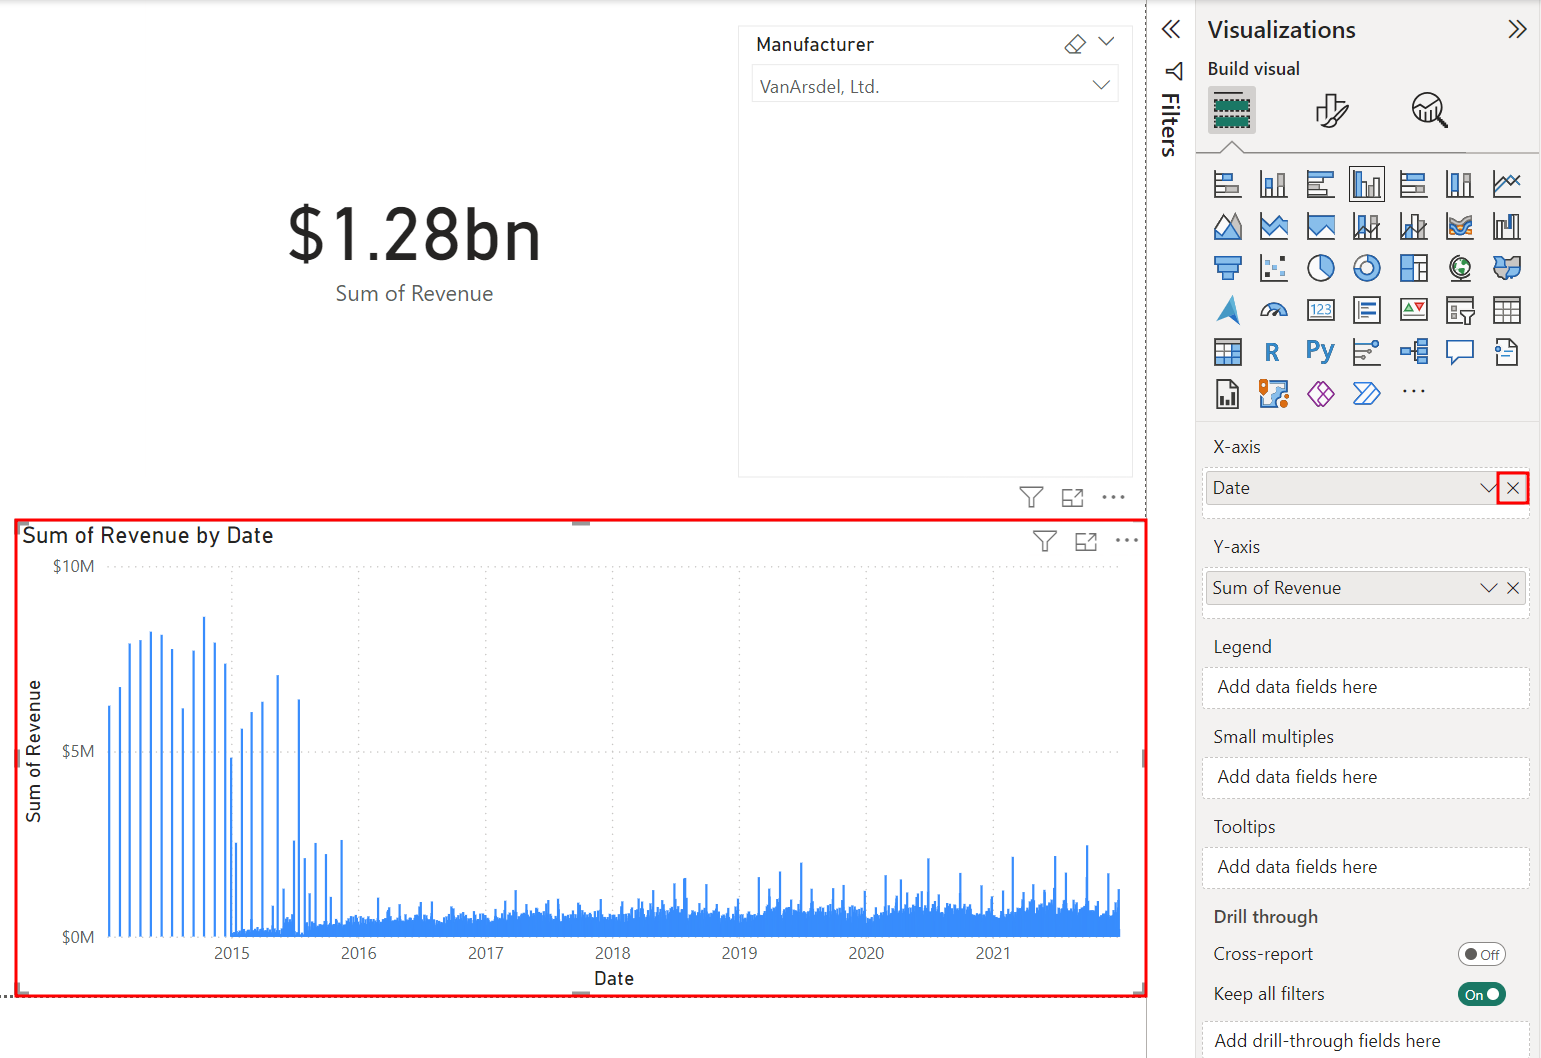
The Sum of Revenue by Date chart looks different now. Let's fix that.
Select the Sum of Revenue by Date visual.
From the X-axis section in the Visualizations pane, select the X to remove the Date field.
From the Data pane, expand the Date table.
Now, drag and drop the Date field from the Date table to the X-axis section in the Visualizations pane.
Select the Drill up button above the visual until the visual is on the Year level.
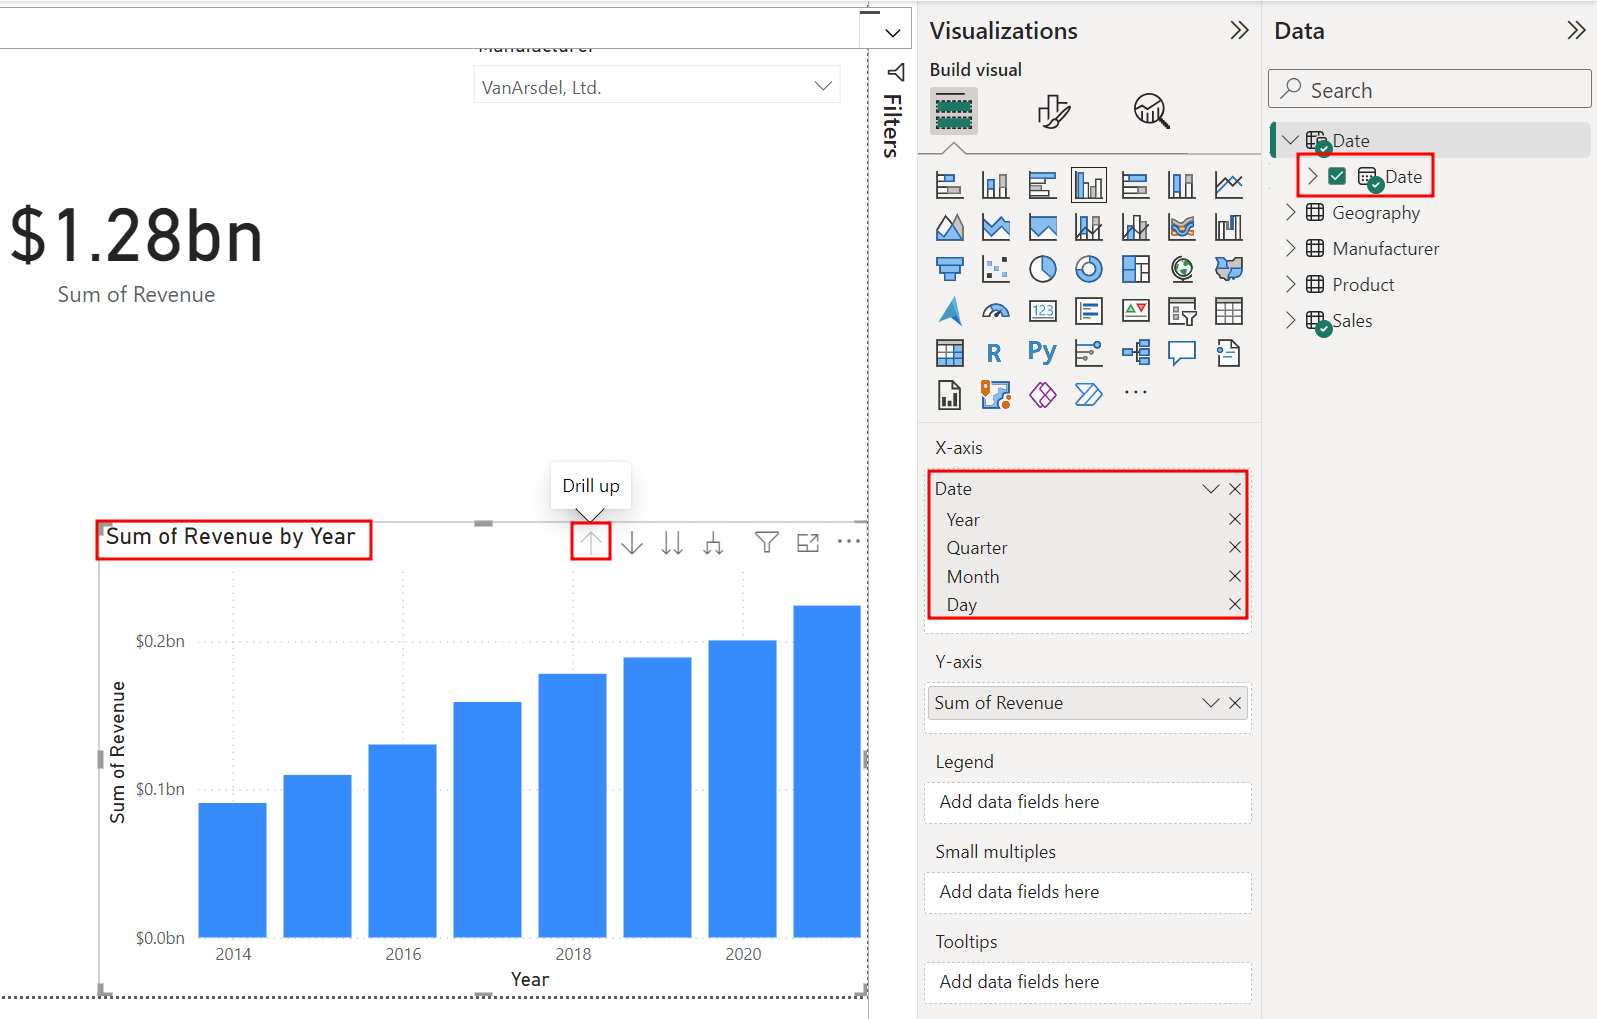
Now, the new Date field behavior is like it was previously.
Since there are now two Date fields, you might be confused which one to use. To remove confusion, hide the Date field in the Sales table.
From the Data pane, hover over and select the ellipses (…) to the right of the Date field in the Sales table.
Then, select Hide from the options menu.
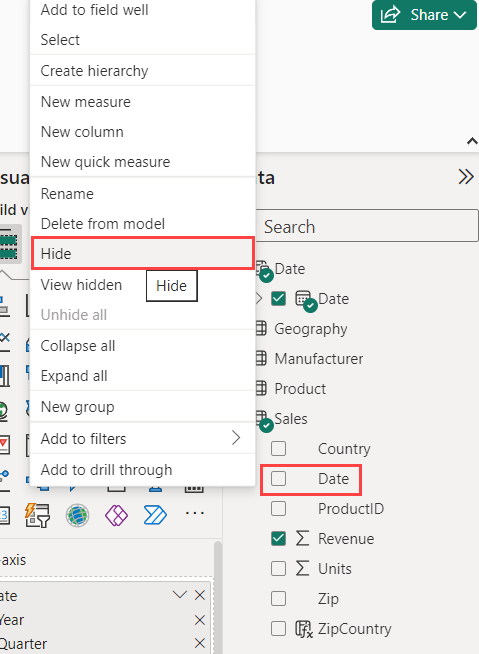
Use the preceding steps to hide Country, ProductID, Zip, and ZipCountry in the Sales table as well. The only fields that should now be in the Sales table are Revenue and Units.
Next, hide ZipCountry from the Geography table.
Then, hide ManufacturerID from the Manufacturer table.
Hide ProductID and ManufacturerID from the Product table.


Tip
It’s best practice to hide fields that are not used in your report visuals. These fields are the basis of our relationships between each table so we should not delete them.