Analyze data in Excel
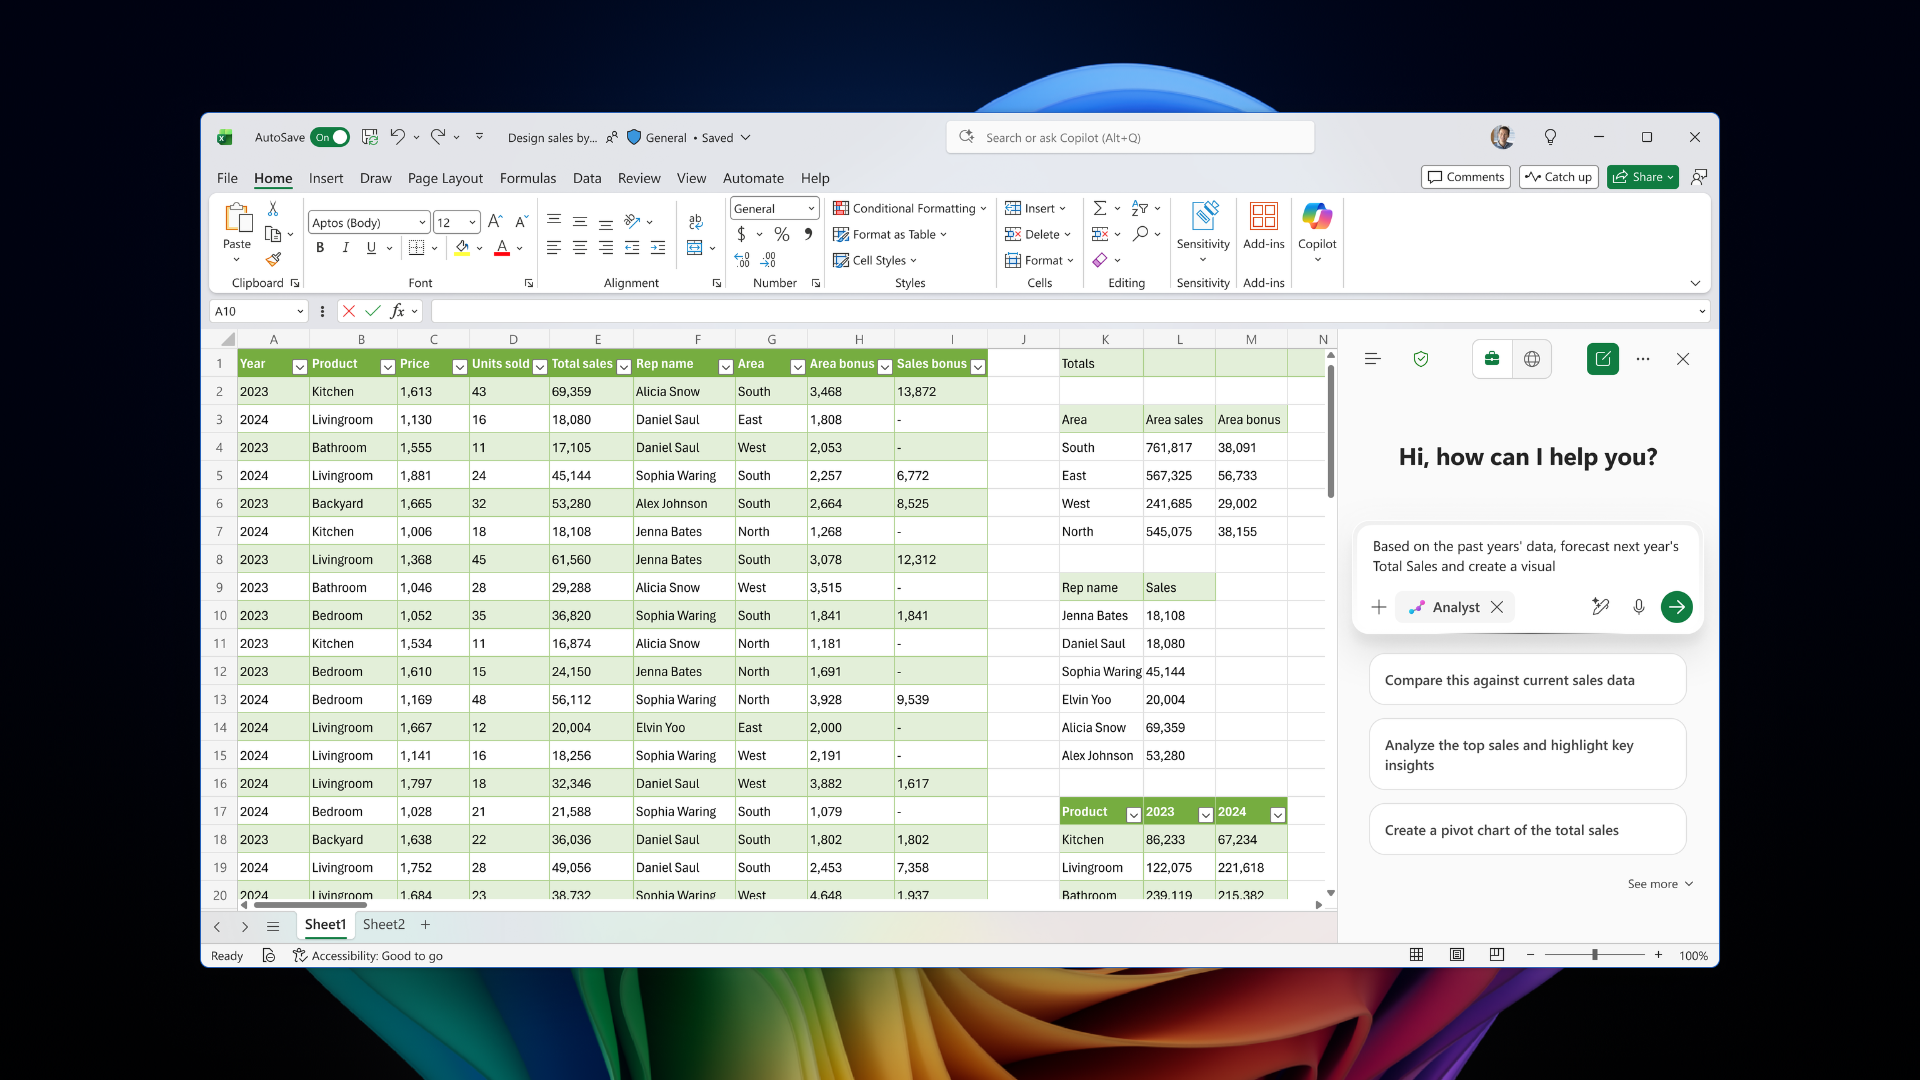
Your team has compiled a quarterly sales report in Excel, and you're tasked with identifying trends, highlighting key insights, and preparing visuals for stakeholder review. Rather than manually building formulas and charts, you can use Copilot in Excel to ask plain-language questions about your data—while using your Surface touchscreen to interact with the results. Let's explore how:
Open your spreadsheet and activate Copilot: On your Surface, open the Excel workbook containing your data. Ensure your data is formatted as a table. This is a best practice for using Copilot in Excel, as it relies on structured, tabular data. Select the Copilot button on the Home tab of the ribbon to open the Copilot panel on the right side of your screen.
Ask plain language questions about your data: Instead of writing complex formulas, start by asking Copilot questions in natural language. You can ask "What were our top 10 sales by revenue this quarter?" or "Which product categories increased the most compared to last quarter?" Copilot processes your query and provides results in formats like summaries, charts, PivotTables, or highlighted insights. You can use the Surface PixelSense touchscreen to tap on results, scroll through data, and pinch-to-zoom on charts for a closer look.
Generate charts and visuals: Ask Copilot to create visuals that tell the story of your data, such as "Create a bar chart comparing by revenue region for Q1 and Q2." or "Show me a trend line for monthly sales over the past six months." Copilot generates the chart and displays it in the Copilot panel. If you're satisfied with a chart, select Add to a new sheet to insert it into your workbook. You can use touch gestures on your Surface to resize, reposition, or interact with the chart directly on the canvas.
Dig deeper with follow up questions: Once Copilot identifies a pattern or trend, dig deeper with follow-up prompts, such as: "Why did spending increase in March?" or "Which items contributed most to this change?" Copilot provides more context based on the data in your workbook. This iterative approach allows you to move from a high-level overview to specific insights without writing a single formula. When your analysis is ready, you can share the workbook with stakeholders via a secure OneDrive link or copy key visuals into the PowerPoint presentation.
Note
Microsoft 365 Copilot requires a separate license. See Microsoft 365 Copilot overview.