Exercise: Create a dashboard from a query
Dashboards are an excellent way to communicate data science insights visually.
You're connected to resources containing a meteorological dataset. In this unit, you create a dashboard from a query of this data.
Pin query to dashboard
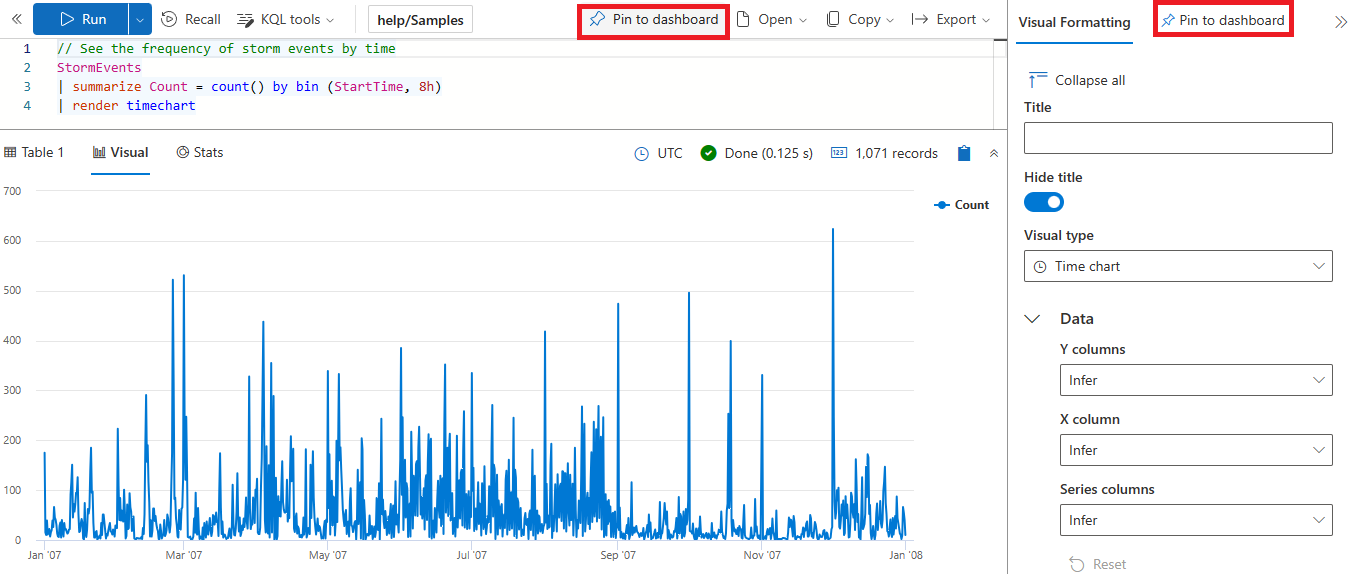
Start with a query that you want to pin to the dashboard. In this case, you share a plot of events versus time from the publicly available help cluster.
Run the following query:
StormEvents
| summarize Count = count() by bin (StartTime, 8h)
| render timechart
At the top of the query editor or in the help.Samples pane, select Pin to dashboard.
In the Pin to dashboard pane that opens, set Hide tile name to off and fill in the following fields:
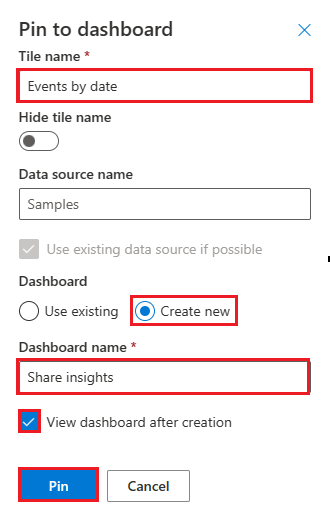
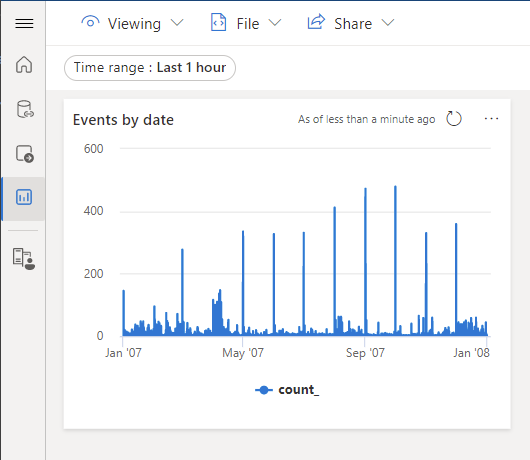
Field Description Suggested value Tile name The title for this specific tile. In this example, give it a name that describes the contents of the graph. Events by date Data source name The name of the database to query. This field is autopopulated when pinning from a query. Samples Use existing/Create new In this example, you're creating a new dashboard. Create new Dashboard name Think about all the tiles you want to add to this dashboard, and give the dashboard an appropriate name. Share insights View dashboard after creation Switches to dashboard view from the query view Checked Select Pin to create the pin and view the dashboard.
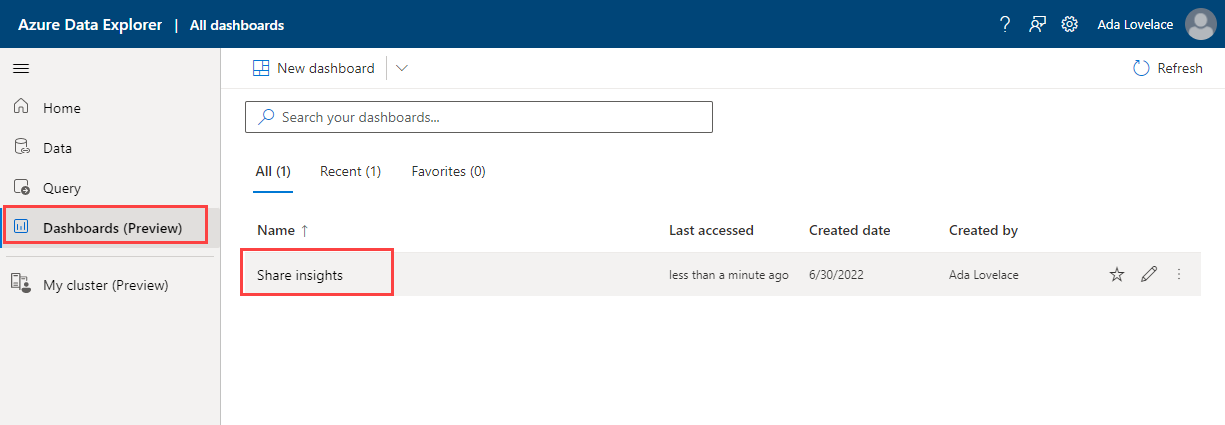
Return to your dashboard
If you exit the dashboard itself, you can return to the dashboard menu by selecting Dashboards from the left pane, and then selecting the specific dashboard you wish to view.