Exercise - Monitor the health of your pipeline
In this exercise, you examine the analytics features that Azure Pipelines provide.
Irwin asked the Tailspin team on how they can release faster. Building an automated release pipeline is a great step toward releasing quickly and reliably. As you release more often and more rapidly, it's important to understand the health and history of your releases. Looking at health trends regularly can help you diagnose potential problems before they become critical.
Before we take a look at some of your pipeline's analytics, let's listen in on the Tailspin team at their morning meeting.
How can I track the health of my pipeline?
It's the following morning. At the team meeting, Andy and Mara have finished demonstrating the build and release pipeline that they set up.
Amita: This is fantastic! The build pipeline was a great start, but I still had to manually install the build artifact in my lab so I could test it. If I can get these releases to my test environment on a regular schedule, I can move new features through QA much faster.
Mara: Exactly! And remember, we can always expand our release pipeline to include more stages. The goal is to create a complete deployment workflow.
Tim: A staging environment would be great. I could do more stress testing before we present new features to management for final approval.
The team is excited to see what the new pipeline can do. They all start talking at the same time.
Andy: I'm excited too. But let's focus on one step at a time. Yes, I think we can make all of these changes and more, but this is just a proof of concept. We'll work on expanding it over time.
Amita: So how do we track the health of our release pipelines?
Andy: Remember the dashboard we created to monitor the build health? We can set up the same kind of system for our releases.
Tim: Irwin will like that.
Andy: Let's hold off on building a release dashboard until we have a complete release workflow. For now, let's look at some of the built-in analytics that Azure Pipelines provides.
The team gathers around Andy's laptop.
What information does pipeline analytics provide?
Every pipeline provides reports that include metrics, trends, and insights. These reports can help you improve the efficiency of your pipeline.
Reports include:
- The overall pass rate of your pipeline.
- The pass rate of any tests in your pipeline.
- The average duration of your pipeline runs; including the build tasks, which take the most time to complete.
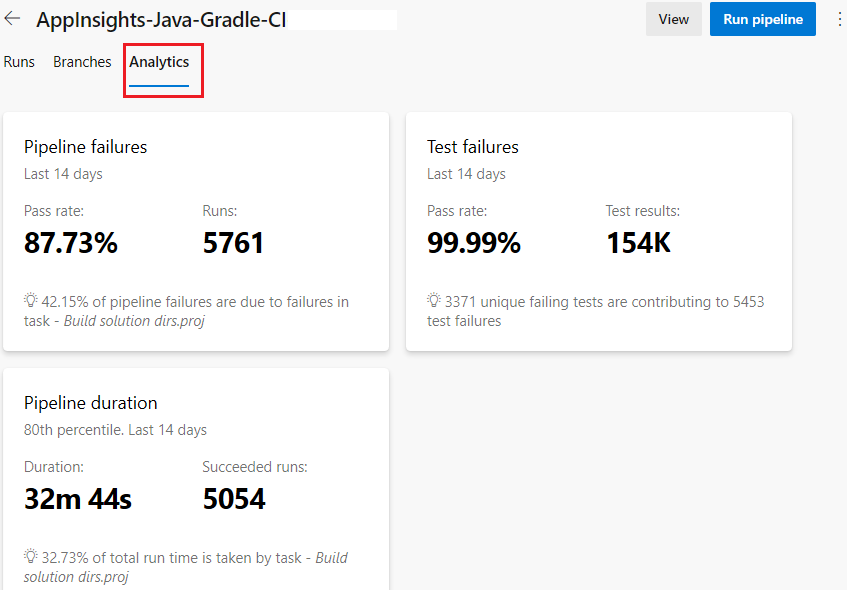
Here's a sample report that shows the pipeline failures, test failures, and pipeline duration.
You can filter the results to focus on a specific time period or on the overall activity of a GitHub branch. Azure DevOps also provides this information as an OData feed. Use this feed to publish reports and notifications to systems such as Power BI, Microsoft Teams, or Slack. You can learn more about analytics feeds at the end of this module.
Explore your pipeline's analytics
In Azure DevOps, select Pipelines, then select your pipeline.
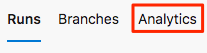
Select the Analytics tab.
Review the pass rates and average duration of your pipeline runs.
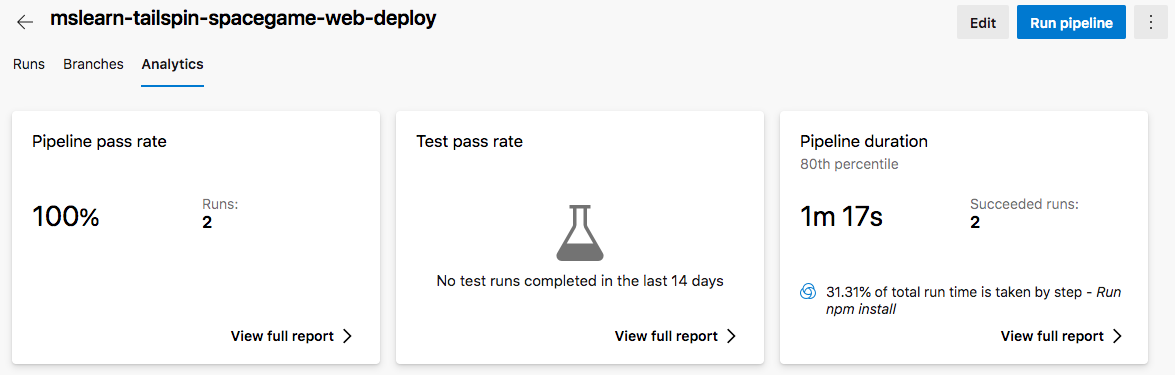
Under Pipeline pass rate, select View full report to view the detailed report.
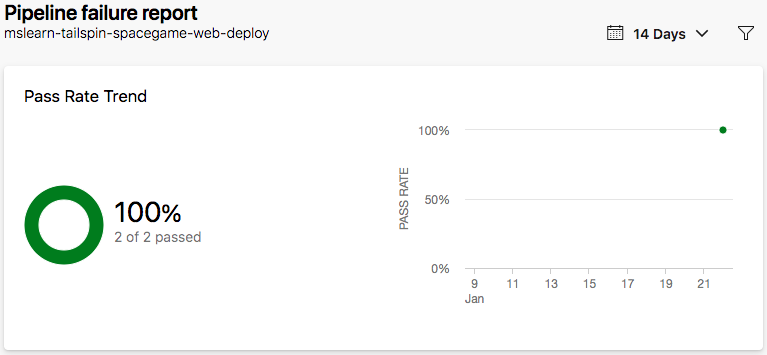
Amita: That's the information I want, but I don't see much data yet.
Andy: That's right. We'll collect more data as we perform more runs over time. We'll use this data to gain insights and learn how we can make it more efficient.
Mara: I see that the npm install task takes the longest to complete. Perhaps we can make it run faster by caching the npm packages.
Andy: That's a great idea! We can investigate this further as we have more pipeline runs.