Train and evaluate your model
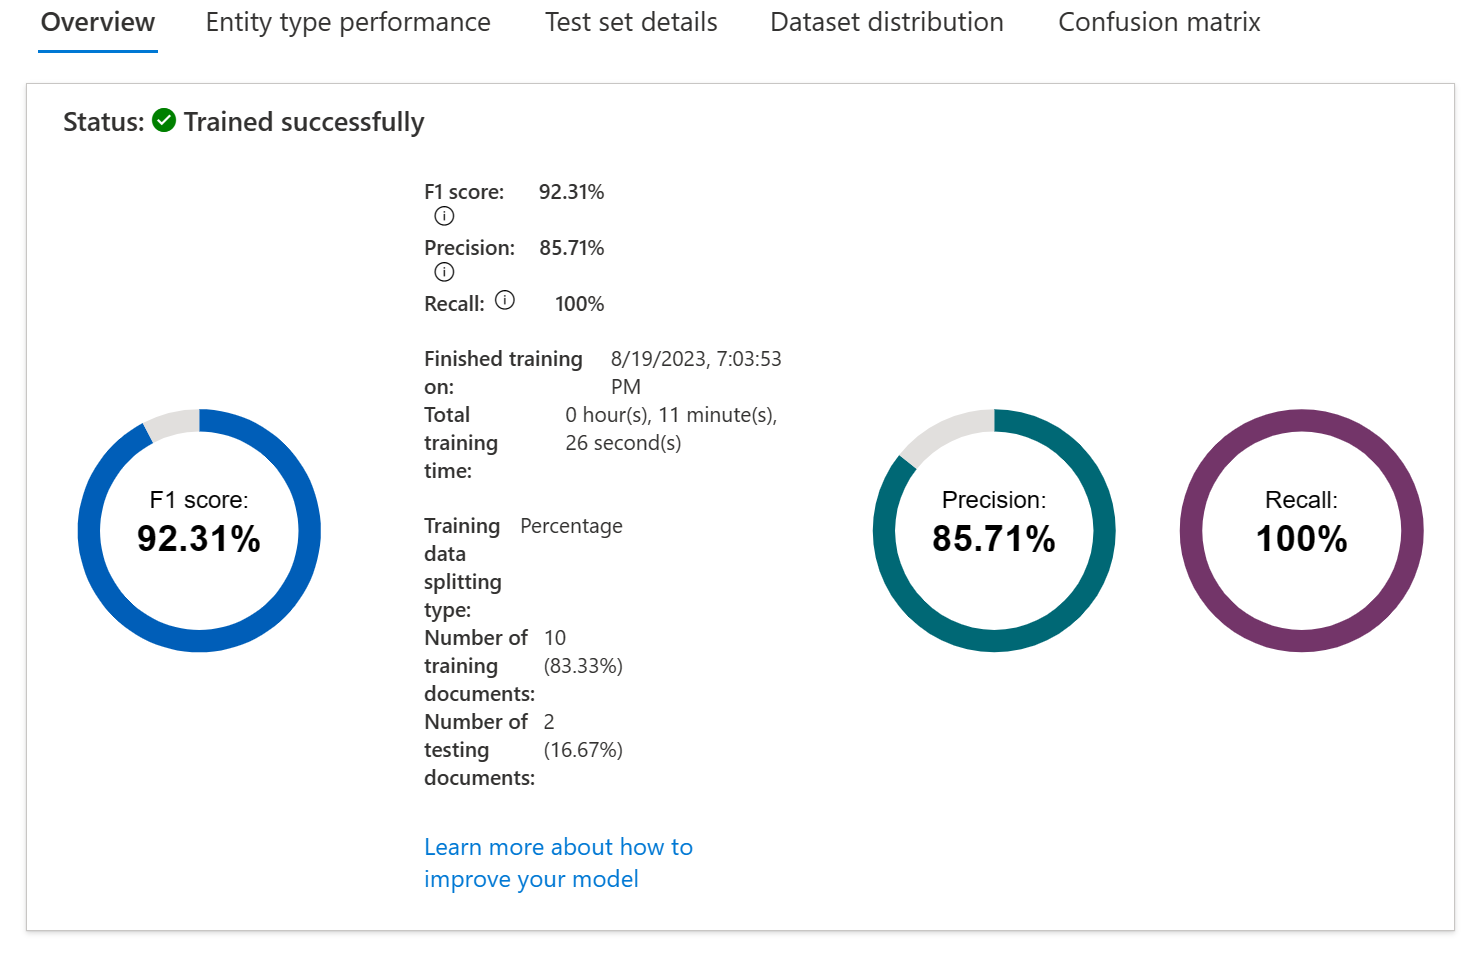
Training and evaluating your model is an iterative process of adding data and labels to your training dataset to teach the model more accurately. To know what types of data and labels need to be improved, Language Studio provides scoring in the View model details page on the left hand pane.
Individual entities and your overall model score are broken down into three metrics to explain how they're performing and where they need to improve.
| Metric | Description |
|---|---|
| Precision | The ratio of successful entity recognitions to all attempted recognitions. A high score means that as long as the entity is recognized, it's labeled correctly. |
| Recall | The ratio of successful entity recognitions to the actual number of entities in the document. A high score means it finds the entity or entities well, regardless of if it assigns them the right label |
| F1 score | Combination of precision and recall providing a single scoring metric |
Scores are available both per entity and for the model as a whole. You may find an entity scores well, but the whole model doesn't.
How to interpret metrics
Ideally we want our model to score well in both precision and recall, which means the entity recognition works well. If both metrics have a low score, it means the model is both struggling to recognize entities in the document, and when it does extract that entity, it doesn't assign it the correct label with high confidence.
If precision is low but recall is high, it means that the model recognizes the entity well but doesn't label it as the correct entity type.
If precision is high but recall is low, it means that the model doesn't always recognize the entity, but when the model extracts the entity, the correct label is applied.
Confusion matrix
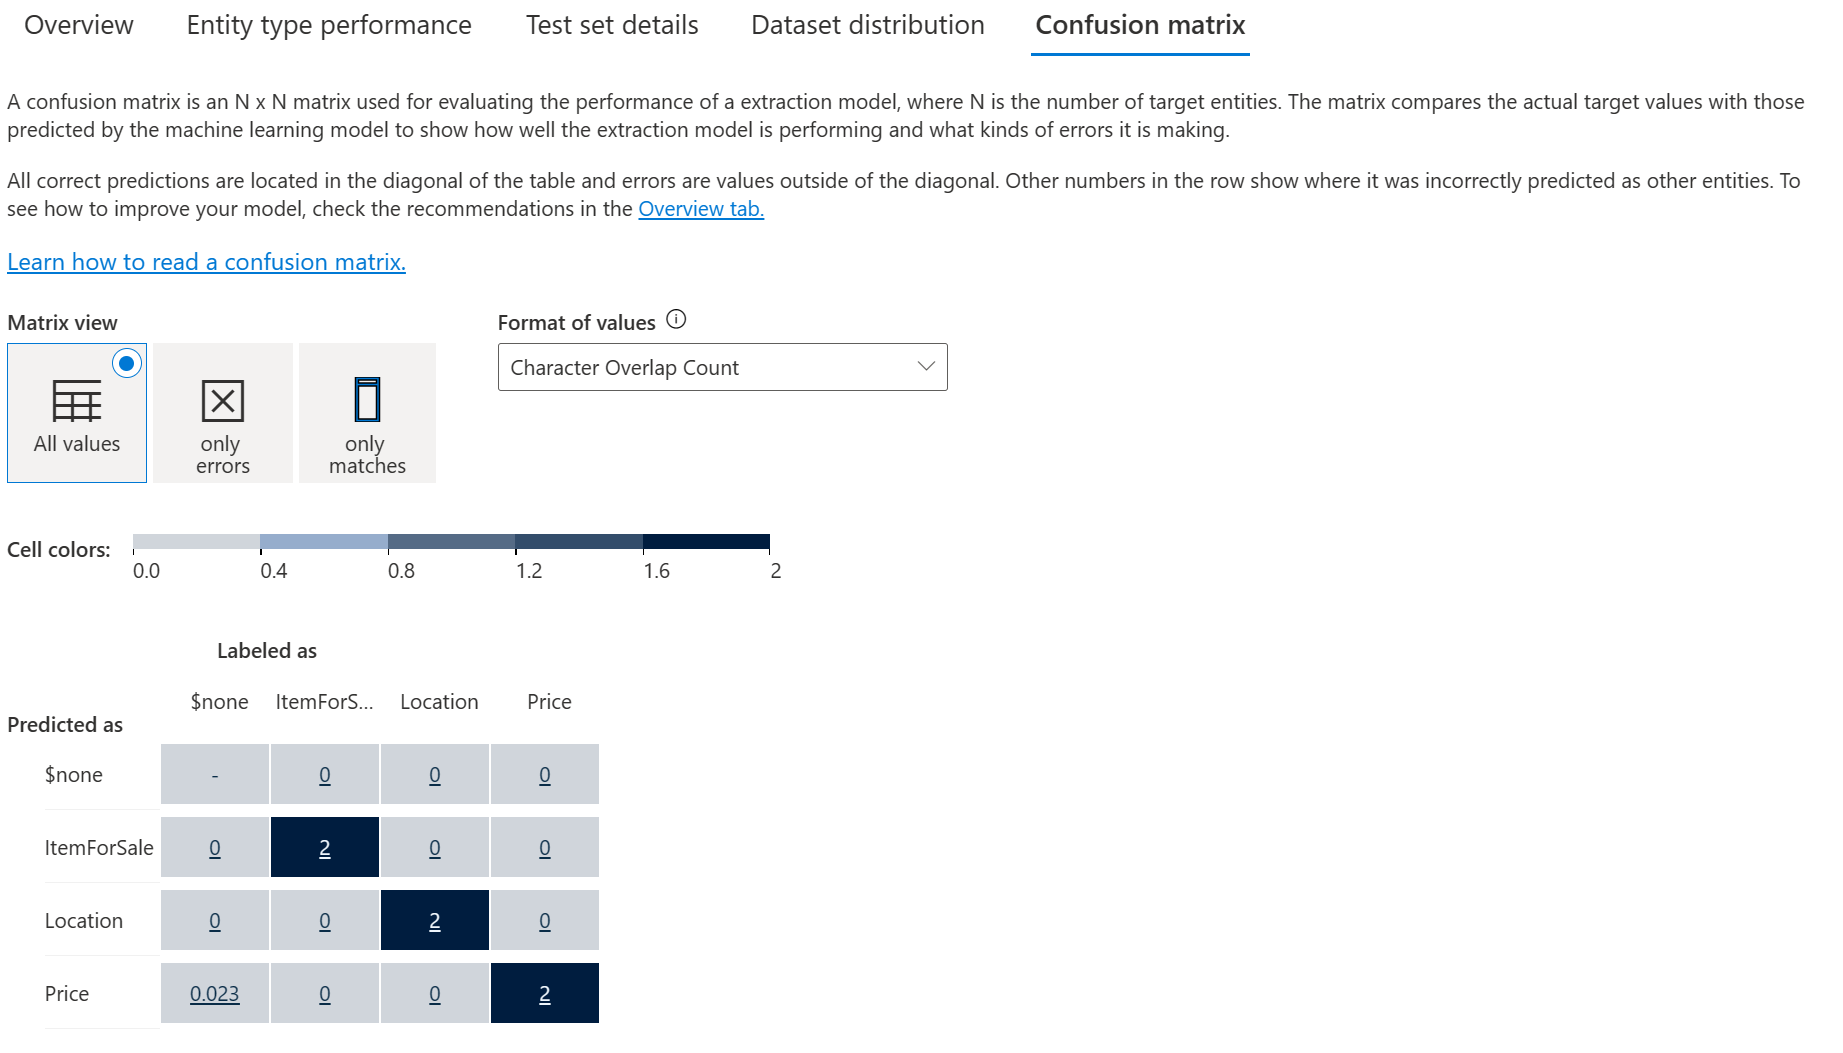
On the same View model details page, there's another tab on the top for the Confusion matrix. This view provides a visual table of all the entities and how each performed, giving a complete view of the model and where it's falling short.
The confusion matrix allows you to visually identify where to add data to improve your model's performance.

