Types of data analytics
In this scenario, the VP knows sales aren't growing, but that single observation doesn't tell her what to do next. Each follow-up question requires a different analytical method. Five types of analytics work together to take the investigation from initial observation to a concrete pricing recommendation.
Descriptive analytics: what happened?
Descriptive analytics quantifies what happened without explaining why.
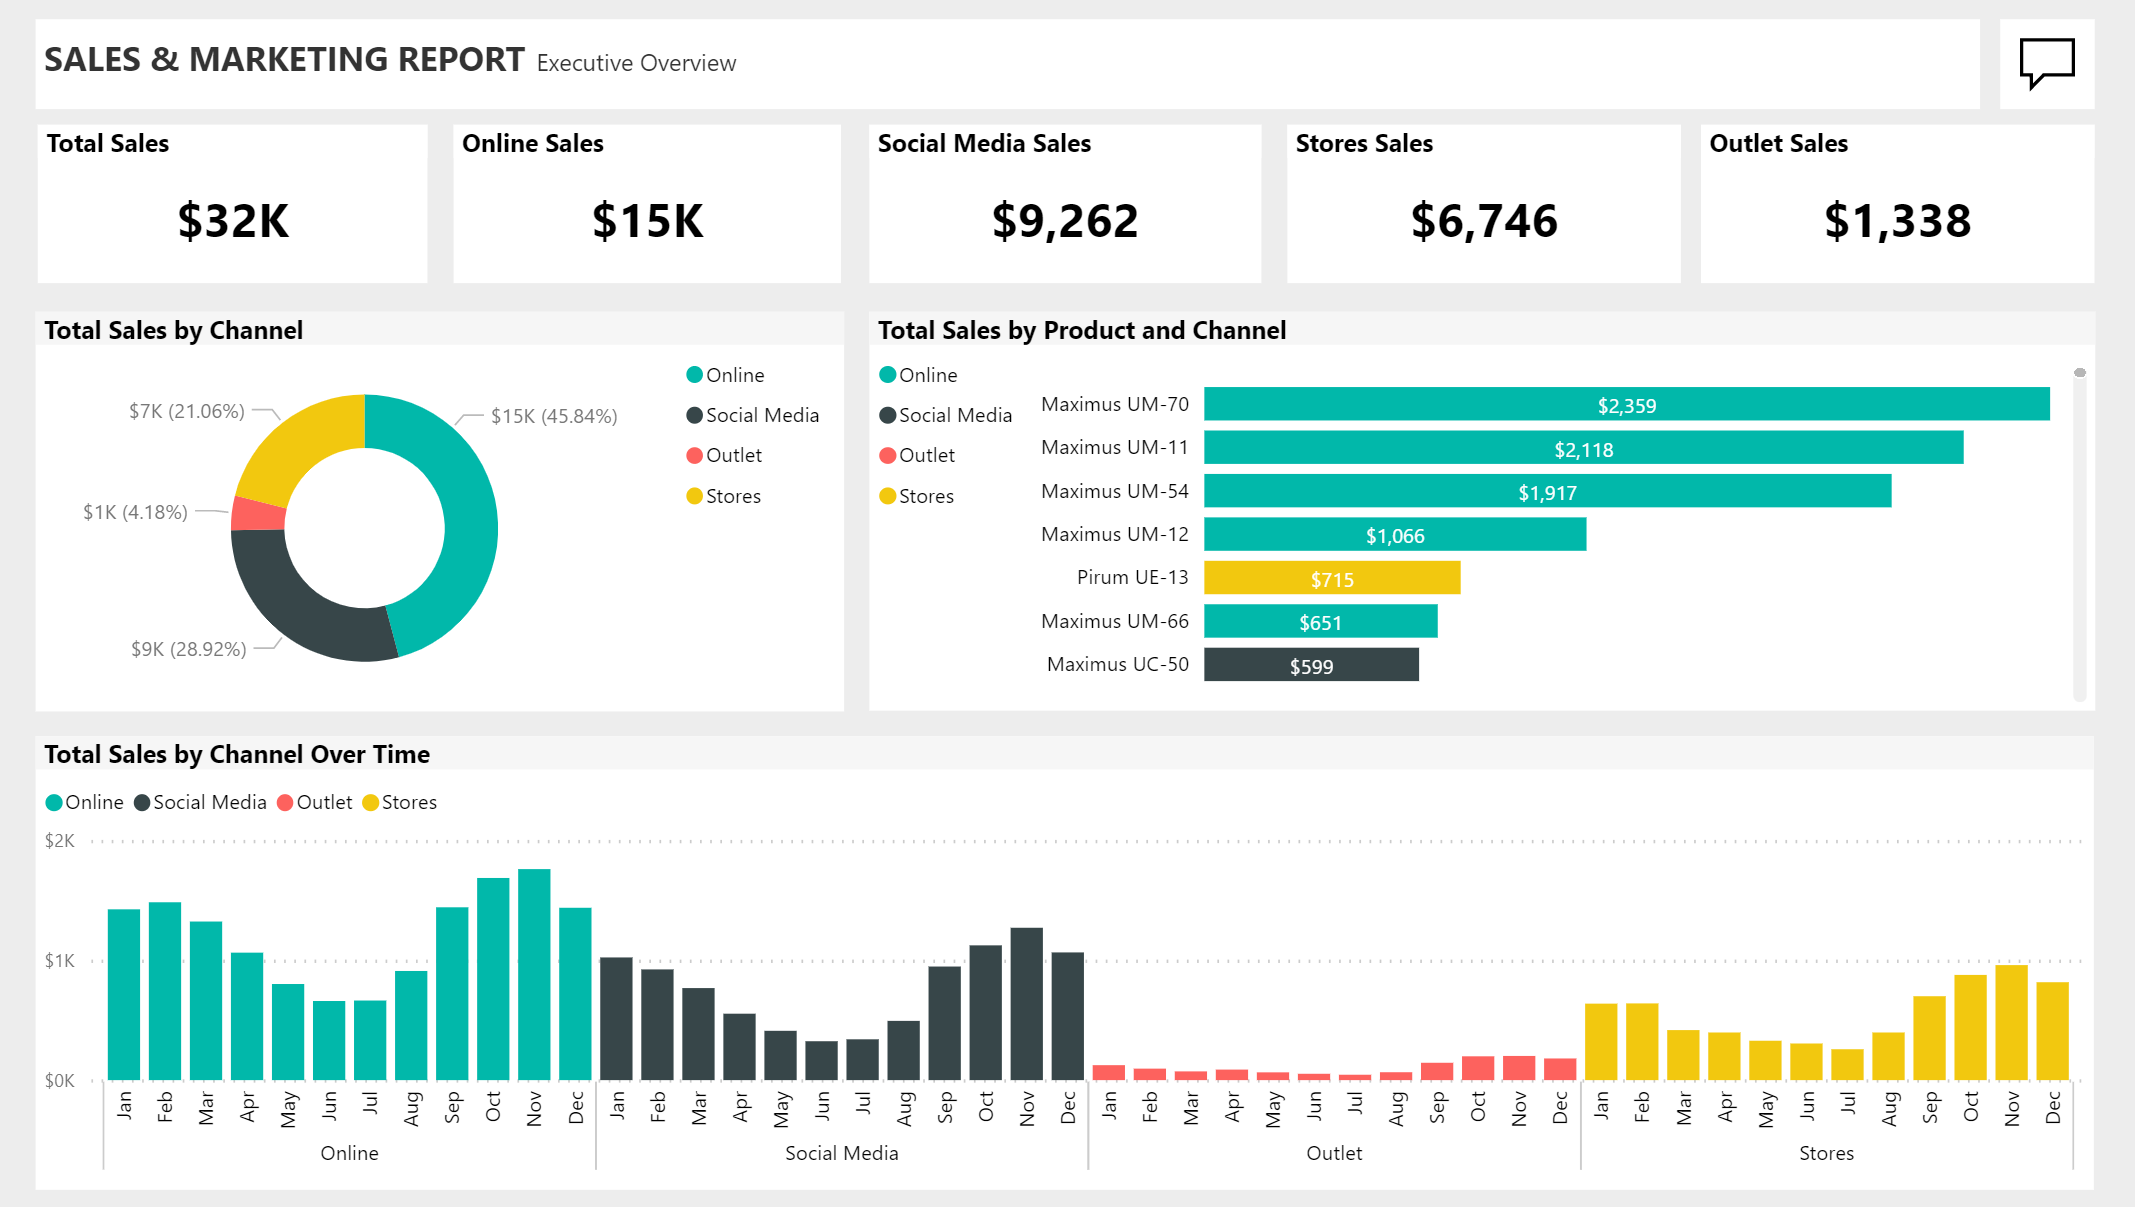
For Tailwind Traders, this means building a dashboard that breaks down total sales by channel and product. The dashboard shows that online sales account for nearly half of all revenue, with social media as the second-largest channel. Stores and outlet contribute significantly less. Monthly trends confirm the VP's concern: sales fluctuate seasonally but show no overall growth.
The following image shows a sales and marketing dashboard that gives stakeholders an at-a-glance view of performance through cards, donut charts, bar charts, and trend lines across channels and products.
Diagnostic analytics: why did it happen?
The goal is always to move from symptom to cause.
The dashboard confirmed that sales aren't growing, but the VP now needs to know what drives the deals that do close. The diagnostic process follows three steps:
- Identify what to investigate — close rates vary significantly across products and sales teams.
- Collect related data — discount levels, product categories, campaign types, sales owners.
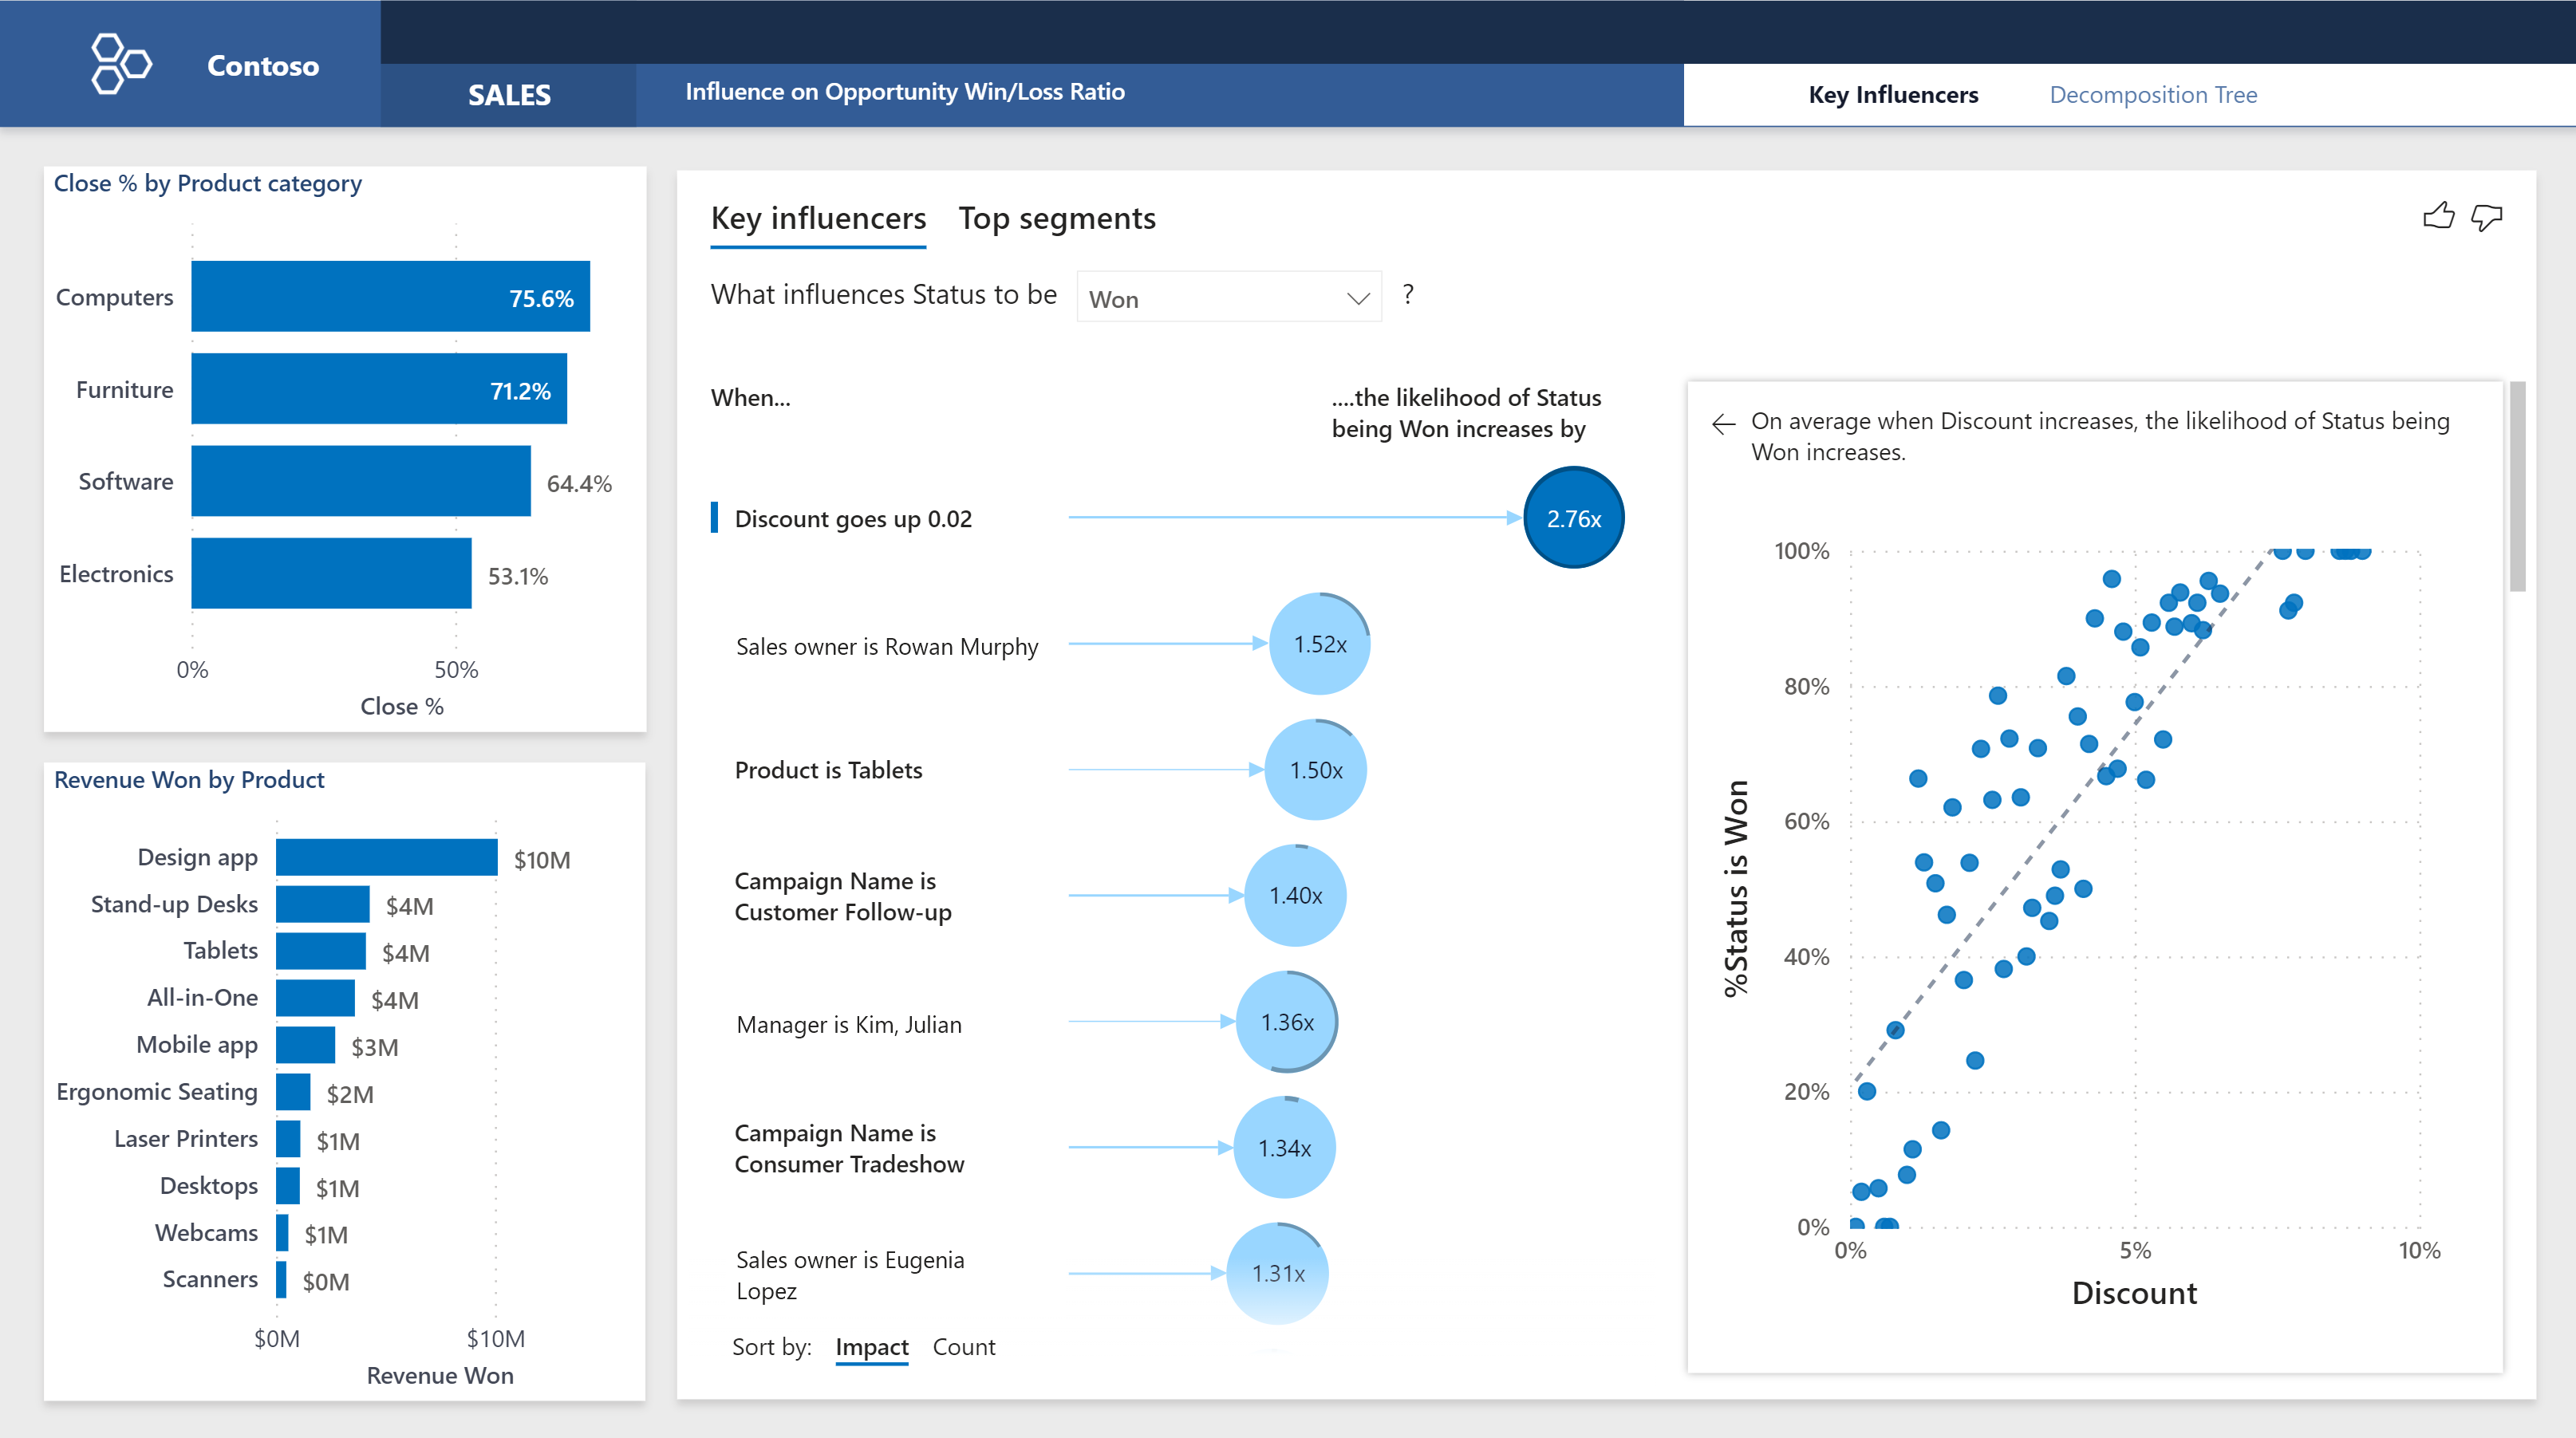
- Find the pattern — discount levels have the biggest impact on whether a deal closes, nearly tripling the likelihood. Product type and sales team also influence outcomes.
This analysis surfaces a deeper insight: the team might be relying on heavy discounting to close deals, which drives volume but erodes margins.
The following image shows an example of a Key Influencers visual in Power BI. This type of visual automatically identifies which factors most strongly drive a specific outcome, ranks them by impact, and shows the relationship in a scatter plot so you can validate the pattern visually.
Predictive analytics: what's likely to happen next?
Predictive analytics uses historical patterns to estimate future outcomes before they happen.
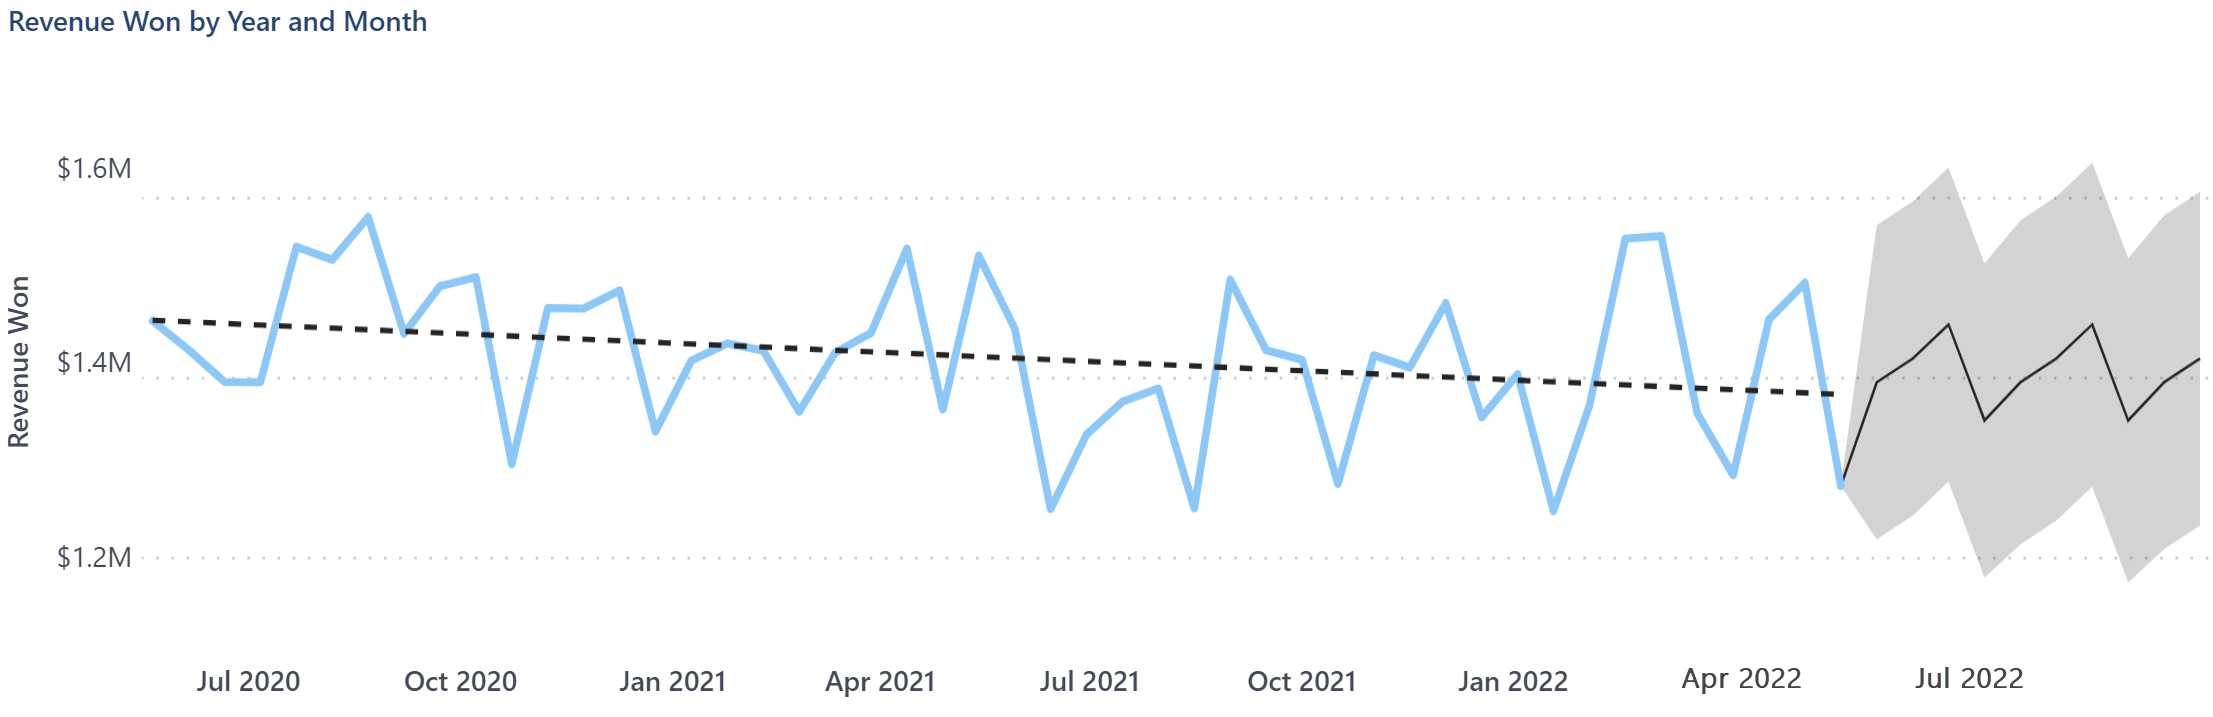
Now that the team understands what's driving results, the VP wants to know where revenue is heading. The team plots monthly revenue over the past two years and adds a forecast. The trend line shows a slight downward trajectory, and the forecast projects that pattern continuing over the coming months.
The following image shows a line chart with a built-in forecast. The gray shaded area projects where the trend is heading based on historical patterns, giving teams a visual range of likely future values.
Prescriptive analytics: what should we do?
The core question is always: "If we do this versus that, what's the likely result?"
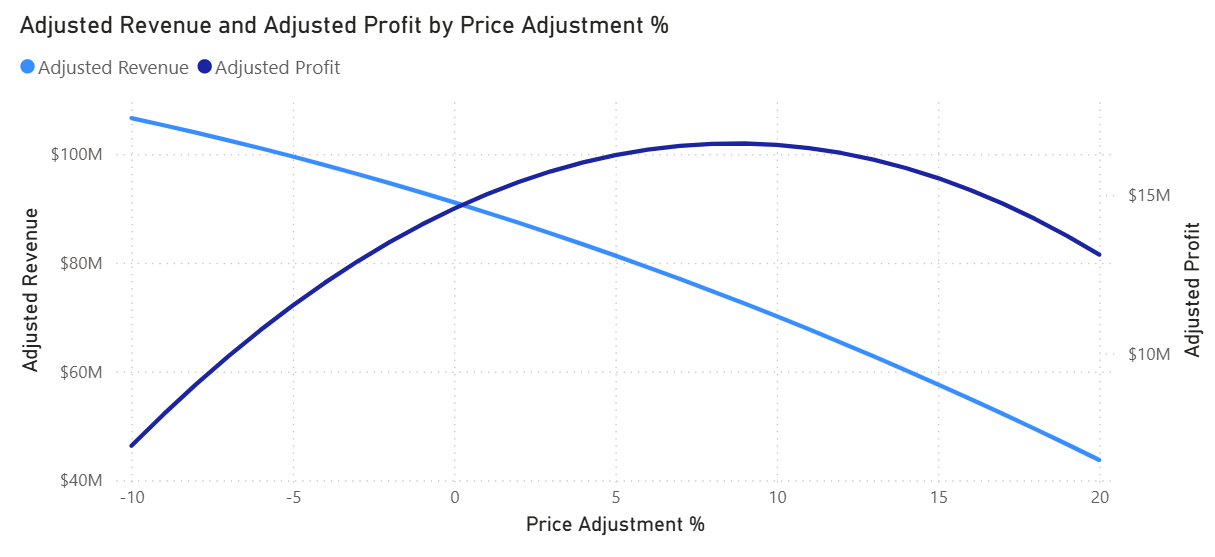
The diagnostic analysis revealed that heavy discounting drives closures but hurts margins, and the forecast shows revenue gradually declining. The VP now needs to determine the right pricing strategy. The team models the impact of adjusting prices from a 10% decrease to a 20% increase and discovers a clear trade-off: lowering prices boosts revenue but shrinks profit, while moderate increases around 7-10% maximize profit before customer resistance causes both metrics to drop.
The following image shows a dual-axis chart comparing adjusted revenue against adjusted profit at different price points, letting decision-makers see exactly where the trade-off tips from favorable to unfavorable.
Cognitive analytics: what can AI help us understand?
Cognitive analytics answers questions that require processing beyond human capacity, not just faster versions of work you could do manually.
Tailwind Traders also collects thousands of customer reviews, support tickets, and social media mentions. Cognitive analytics uses AI to process this unstructured data at a scale manual analysis can't match — categorizing feedback by theme and sentiment, identifying unexpected correlations across hundreds of variables, and surfacing patterns that would take analysts significantly longer to discover.
AI in analytics
Beyond cognitive analytics as a method, AI tools also help analysts work more effectively across all four traditional types. AI can generate initial data summaries, suggest which factors to investigate, detect anomalies, and translate natural-language questions into analytical queries.
The analyst's role in each case remains the same: confirm that the right analytics type is applied, validate that the output answers the question being asked, and determine whether the data is trustworthy enough to act on.
Tip
Looking back at the Tailwind Traders scenario: the VP wanted to understand why sales aren't growing. Which analytics type would you start with, and which would you apply next?