Core analytics tasks
The VP's dashboard is the visible result of a much larger process. The reports and dashboards stakeholders see are a small fraction of the analytics work. The majority of effort goes into preparing and modeling data before a single visual is built. If that foundation is flawed, every insight built on top of it is unreliable, and no visualization technique fixes it.
The analytics process follows a repeatable cycle of five tasks: prepare, model, visualize, analyze, and manage.
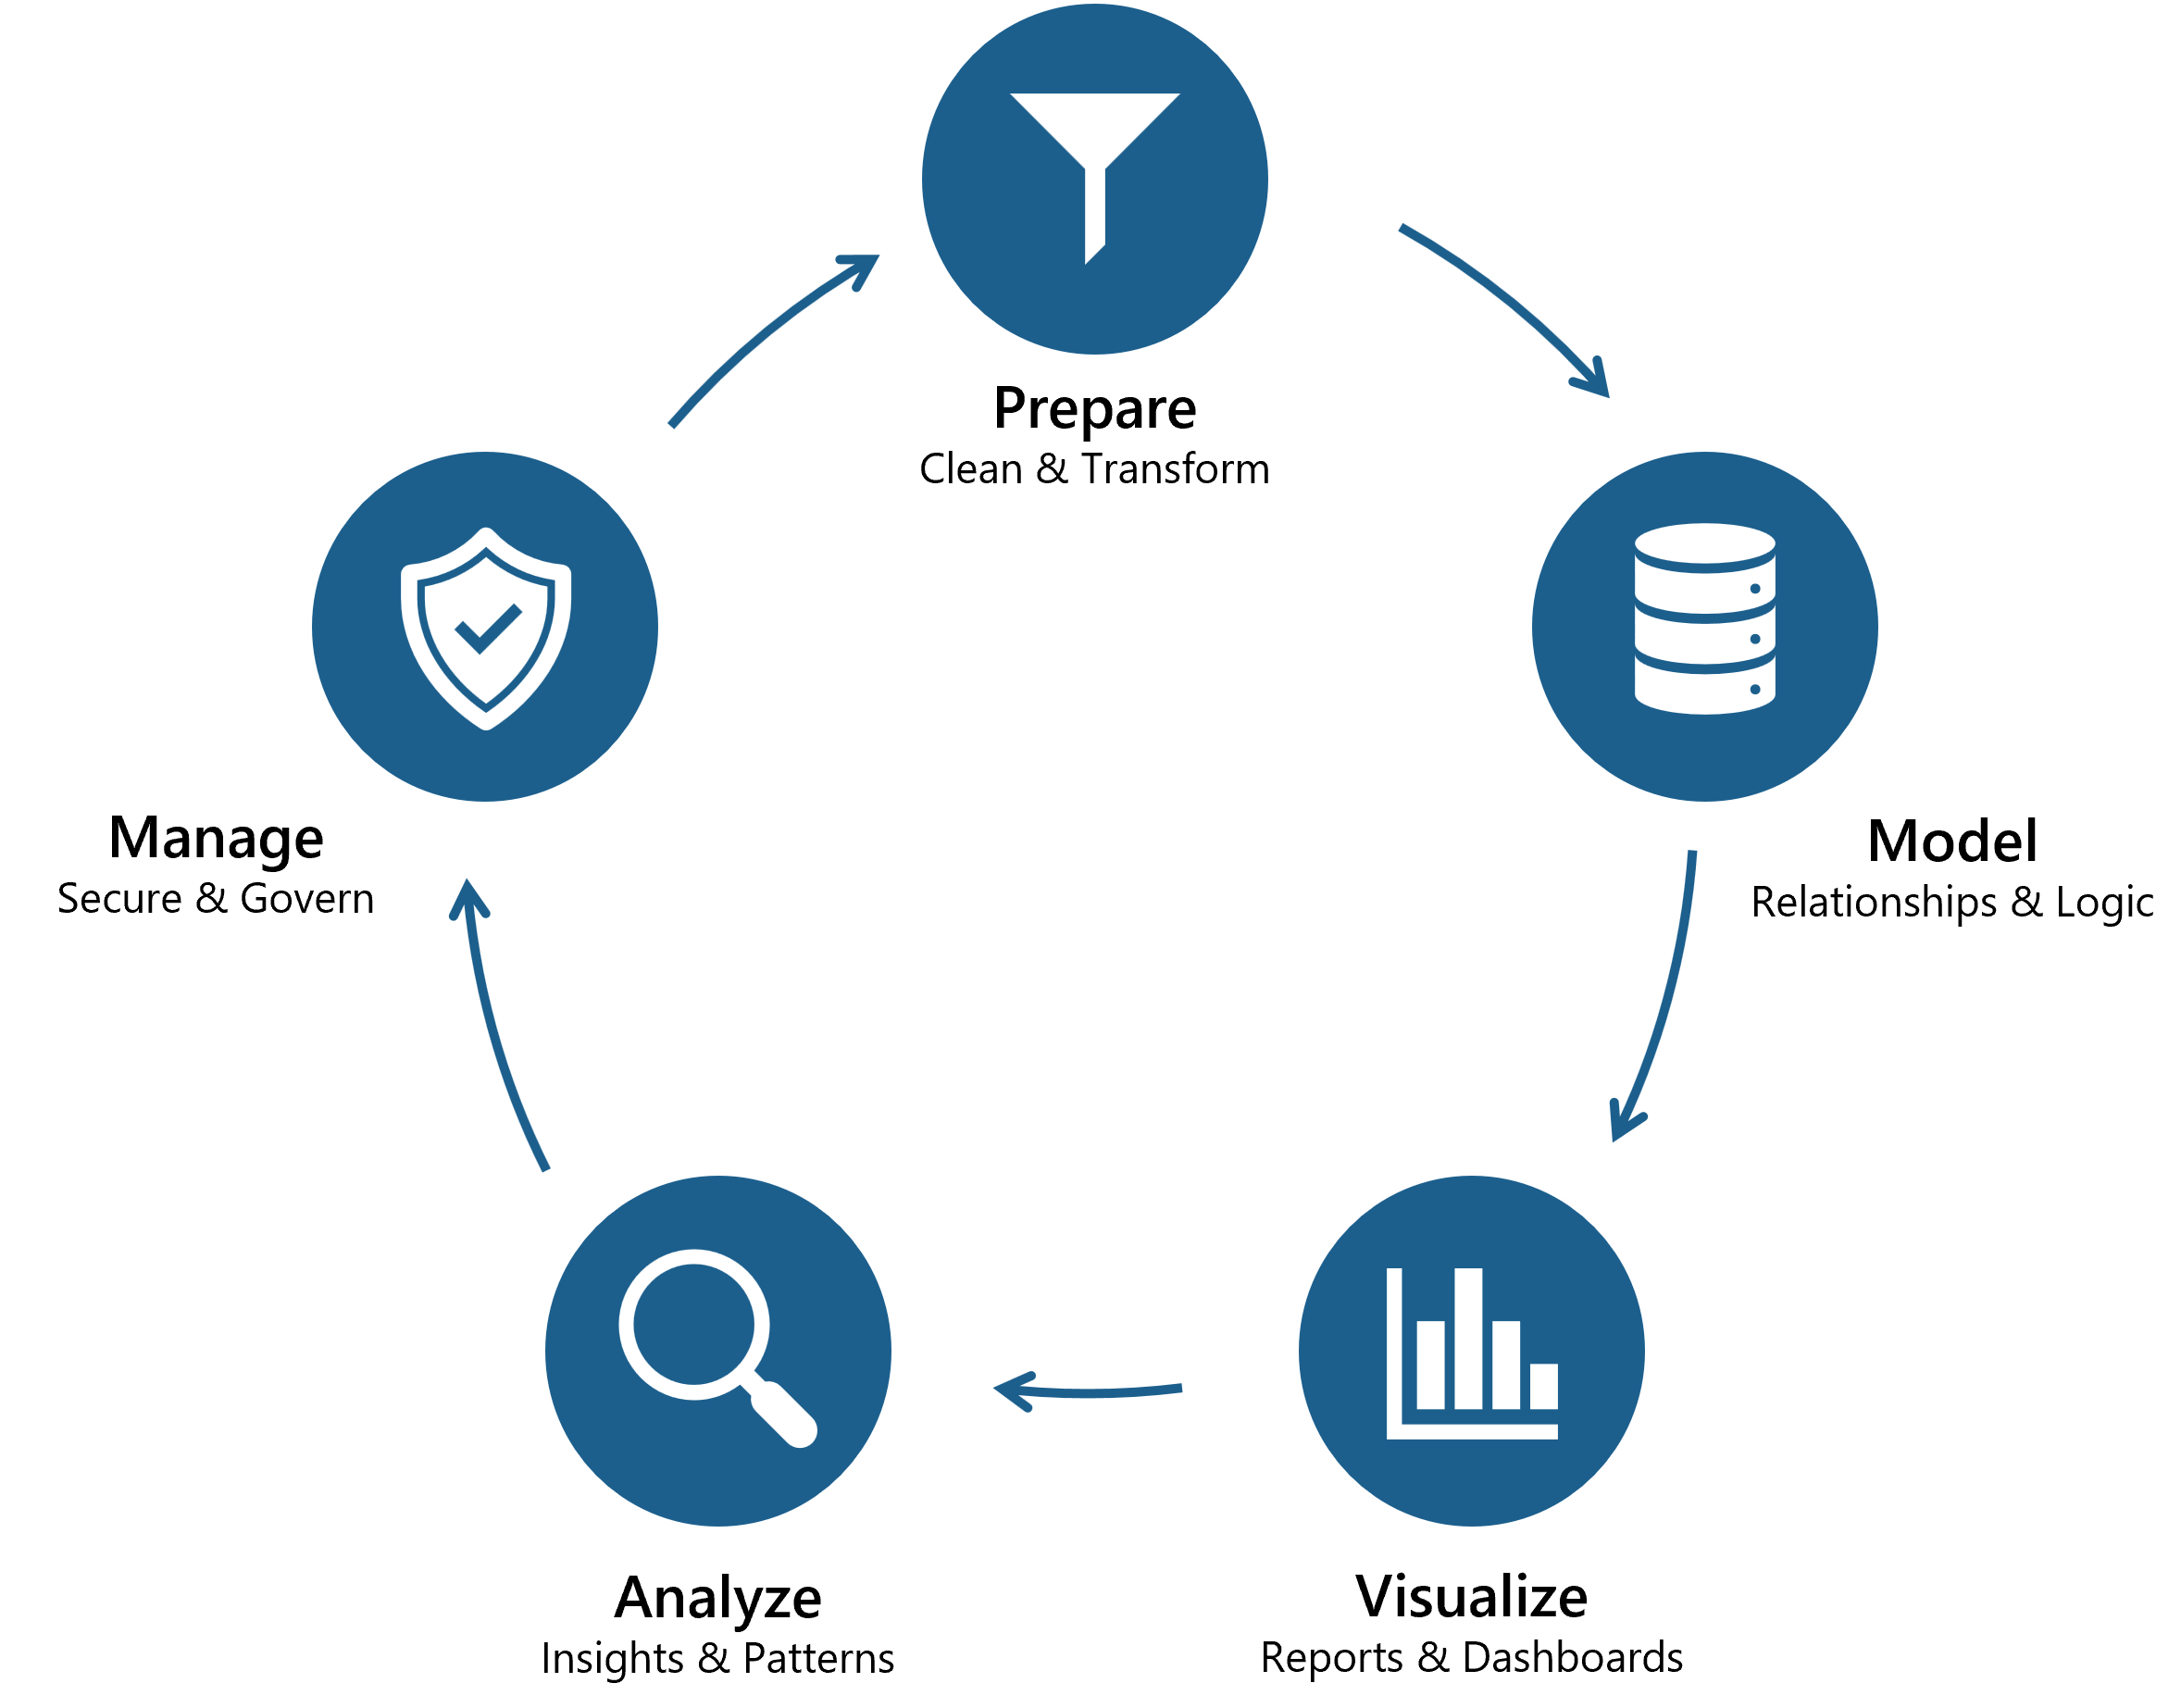
Prepare the data
At Tailwind Traders, the data analyst discovers that the point-of-sale system records dates as MM/DD/YYYY while the e-commerce platform uses YYYY-MM-DD. Product names don't match either - "TW Alpine Pack" in one system is "Alpine Backpack" in another. Without cleaning these inconsistencies, a report splits the same product's sales across two rows, hiding the real numbers.
If the underlying data is inconsistent or incomplete, every insight coming out is unreliable. Preparation turns raw data into a clean, consistent state before any analysis can begin.
Model the data
Next, the data analyst creates relationships between the sales fact table and dimension tables for products, stores, and dates. They define calculations like "net revenue" and "year-over-year growth" and build a date hierarchy that enables drill-down from year to quarter to month.
If two people build reports on the same data and get different numbers, the model is the problem. Modeling means defining how tables relate and how calculations produce consistent results across every report.
Visualize the data
Now the data is brought to life in the VP's dashboard. For the sales investigation, they use a pie chart for channel composition, a bar chart to compare products across channels, a line chart for monthly sales trends, and cards for headline totals.
The wrong visual answers a different question than the one being asked. Just as different business questions require different analytics types, they also require different visual formats to communicate the answer clearly.
Analyze the data
At Tailwind Traders, the data analyst uses a Key Influencers visual to identify which factors most strongly influence deal outcomes, discovering that discount levels and product category are the dominant drivers. AI capabilities in modern analytics tools support this work by detecting anomalies, surfacing key influencers, and generating narrative explanations.
A dashboard full of numbers without context is just data. Analyzing means going beyond what the data shows to what it means and what action it suggests. The data analyst's role is to validate these outputs and determine whether the insight is actionable and trustworthy.
Manage the assets
The VP's dashboard needs to stay accurate after it's published. The data analyst monitors data source connections for changes that could break the report, verifies that calculations and visuals still return correct results, and ensures the data refreshes on schedule so stakeholders always see current numbers.
If nobody maintains the reports after publishing, teams build their own versions with slightly different numbers. Ongoing management ensures everyone works from the same trusted source.
Tip
Think about a report you see regularly. Can you trace the path from raw data to the finished visual?