Examine filter context
The VALUES function lets your formulas determine what values are in filter context.
The VALUES function syntax is as follows:
VALUES(<TableNameOrColumnName>)
The function requires passing in a table reference or a column reference. When you pass in a table reference, it returns a table object with the same columns that contain rows for what's in filter context. When you pass in a column reference, it returns a single-column table of unique values that are in filter context.
The function always returns a table object and it's possible for a table to contain multiple rows. Therefore, to test whether a specific value is in filter context, your formula must first test that the VALUES function returns a single row. Two functions can help you accomplish this task: the HASONEVALUE and the SELECTEDVALUE functions.
The HASONEVALUE function returns TRUE when a given column reference has been filtered down to a single value.
The SELECTEDVALUE function simplifies the task of determining what a single value could be. When the function is passed a column reference, it returns a single value, or when more than one value is in filter context, it returns BLANK (or an alternate value that you pass to the function).
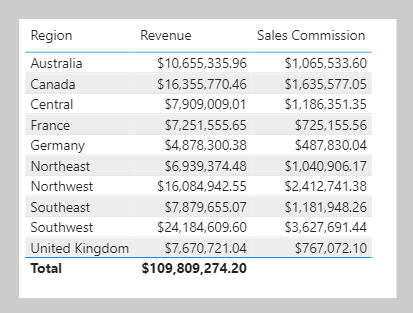
In the following example, you use the HASONEVALUE function. Add the following measure, which calculates sales commission, to the Sales table. At Adventure Works, the commission rate is 10 percent of revenue for all countries/regions except the United States. In the United States, salespeople earn 15 percent commission. Format the measure as currency with two decimal places, and then add it to the table that is found on Page 3 of the report.
Sales Commission =
[Revenue]
    * IF(
        HASONEVALUE('Sales Territory'[Country]),
        IF(
            VALUES('Sales Territory'[Country]) = "United States",
            0.15,
            0.1
        )
    )
Notice that the total Sales Commission measure result is BLANK. The reason is because multiple values are in filter context for the Country column in the Sales Territory table. In this case, the HASONEVALUE function returns FALSE, which results in the Revenue measure being multiplied by BLANK (a value multiplied by BLANK is BLANK). To produce a total, you need to use an iterator function, which is explained later in this module.
Three other functions that you can use to test filter state are:
ISFILTERED- ReturnsTRUEwhen a passed-in column reference is directly filtered.ISCROSSFILTERED- ReturnsTRUEwhen a passed-in column reference is indirectly filtered. A column is cross-filtered when a filter that is applied to another column in the same table, or in a related table, affects the reference column by filtering it.ISINSCOPE- ReturnsTRUEwhen a passed-in column reference is the level in a hierarchy of levels.
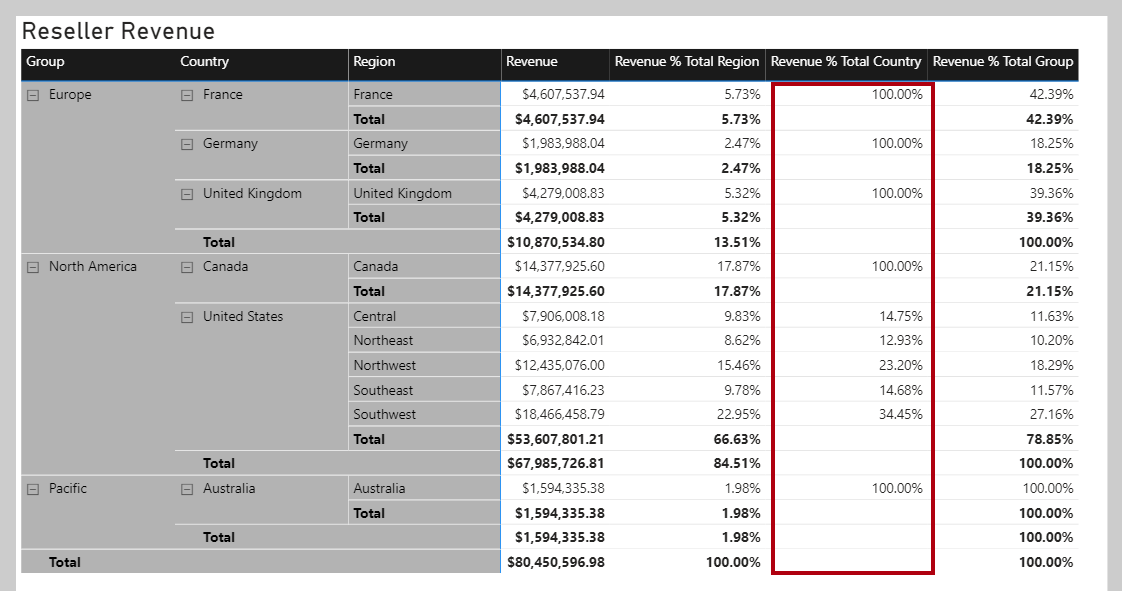
Return to Page 2 of the report, and then modify the Revenue % Total Country measure definition to test that the Region column in the Sales Territory table is in scope. If it's not in scope, the measure result should be BLANK.
Revenue % Total Country =
VAR CurrentRegionRevenue = [Revenue]
VAR TotalCountryRevenue =
    CALCULATE(
        [Revenue],
        REMOVEFILTERS('Sales Territory'[Region])
    )
RETURN
    IF(
        ISINSCOPE('Sales Territory'[Region]),
        DIVIDE(
            CurrentRegionRevenue,
            TotalCountryRevenue
        )
    )

