Health states, metrics, and thresholds
- 7 minutes
A crucial part of health modeling is quantifying healthy, degraded, and unhealthy states for the application in the context of key business requirements. The traffic light model is a common way to represent health states.
- Green: Healthy state. Key nonfunctional requirements are fully satisfied and resources are optimally utilized.
- Yellow: Degraded state. The application is operational but user experience might be affected. An administrator's attention is required to mitigate this state.
- Red: Unhealthy state. The application isn't working or performing as expected. Unhealthy states impact the users.
In the layered health model, start defining states with user flows at the top and move down to platform resources. The following diagram shows an example layered health model. The diagram demonstrates how a change in health state for a foundational component can have a cascading impact on user flows and overall application health:
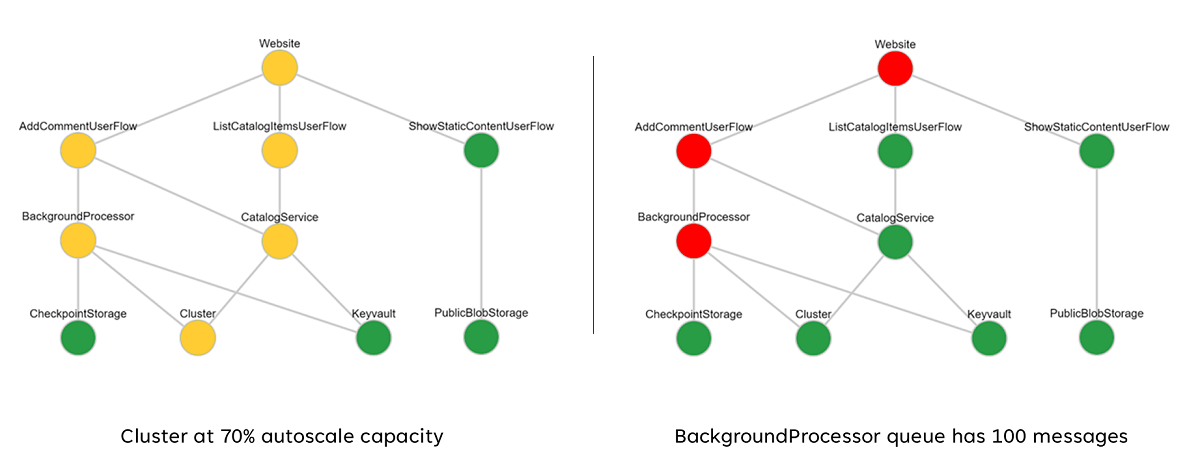
Each layer should use metrics and metric thresholds for components to represent healthy and unhealthy states based on the application functionality and nonfunctional requirements. Define health states for components based on their distinct operational characteristics, steady states, and expected behaviors in a production workload.
For example, metrics might include the number of exceptions, response time, and service metrics. Application components can have dependencies on Azure resources, and even on other components. You need to factor in those health states.
Here are some best practices for calculating health scores:
- Represent health states of a user flow by aggregating granular health scores for components that participate in the flow. It should include the application component and all the mapped dependencies. Consider key nonfunctional requirements as coefficients.
- Represent the health score for a user flow by using the lowest score across all mapped components. Factor in relative attainment against nonfunctional requirements for the user flow.
- Ensure that the health scores consistently reflect operating health. If it doesn't, adjust and redeploy the model to reflect new information.
- Define health score thresholds to reflect a component's health status.
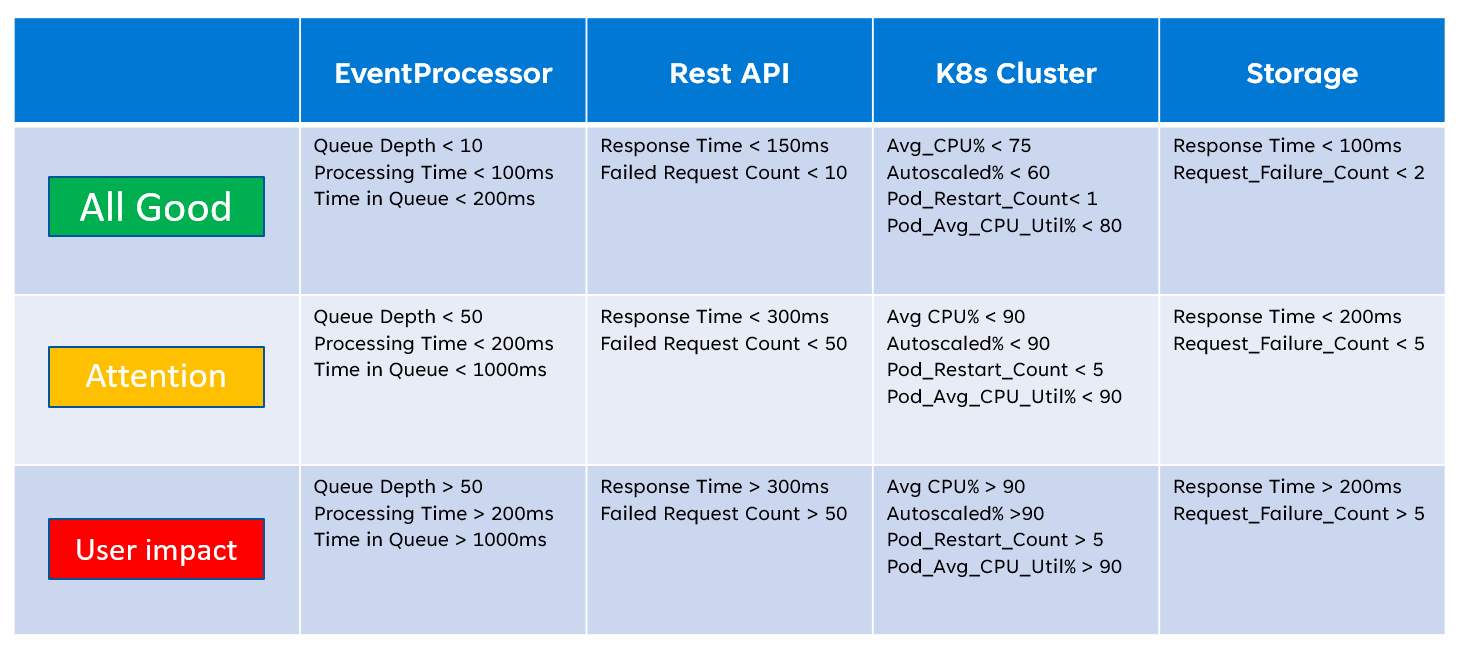
Performance testing is a key in establishing those states. The granular health score of individual components is the key resource-level metrics. The following table shows an example of how you can use resource metrics to define health states:
In the next exercise, we quantify health states for the example application. The exercise helps you understand the expected values for a standard production workload.