Collect, query, and visualize health states
- 15 minutes
To accurately represent a health model, you must gather various datasets from the system. The datasets include logs and performance metrics from application components and underlying Azure resources. It's important to correlate data between the datasets to build a layered representation of health for the system.
Instrumenting code and infrastructure
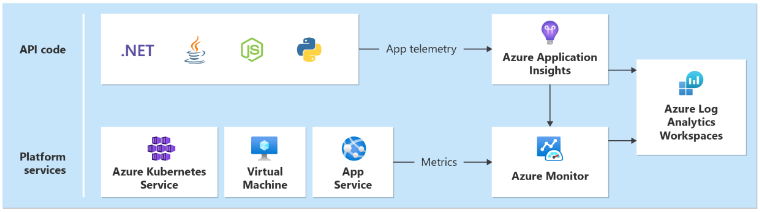
A unified data sink is required to ensure that all operational data is stored and available in a single location where all telemetry is collected. For example, when an employee creates a comment in their web browser, you can track this operation and see that the request went through the Catalog API to Azure Event Hubs. From there, the background processor picked up the comment and stores it in Azure Cosmos DB.
Azure Monitor Log Analytics serves as the core Azure-native unified data sink to store and analyze operational data:
Application Insights is the recommended Application Performance Monitoring (APM) tool across all application components to collect application logs, metrics, and traces. Application Insights is deployed in a workspace-based configuration in each region.
In the example application, Azure Functions is used on Microsoft .NET 6 for its back-end services for native integration. Because the back-end applications already exist, Contoso Shoes creates only a new Application Insights resource in Azure and configures the
APPLICATIONINSIGHTS_CONNECTION_STRINGsetting on both function apps. The Azure Functions runtime registers the Application Insights logging provider automatically, so telemetry appears in Azure without extra effort. For more customized logging, you can use theILoggerinterface.Centralized dataset is an antipattern for mission-critical workloads. Each region must have its dedicated Log Analytics workspace and an Application Insights instance. For global resources, separate instances are recommended. To see the core architecture pattern, see Architecture pattern for mission-critical workloads on Azure.
Each layer should send data to the same Log Analytics workspace, to make analysis and health calculations easier.
Health monitoring queries
Log Analytics, Application Insights, and Azure Data Explorer all use Kusto Query Language (KQL) for their queries. You can use KQL to build queries and use functions to fetch metrics and calculate health scores.
For individual services that calculate the health status, see the following sample queries.
Catalog API
The following sample demonstrates a Catalog API query:
let _maxAge = 2d; // Include data only from the last two days
let _timespanStart = ago(_maxAge); // Start time for the time span
let _timespanEnd = now(-2m); // Account for ingestion lag by stripping the last 2m
// For time frame, compare the averages to the following threshold values
let Thresholds=datatable(MetricName: string, YellowThreshold: double, RedThreshold: double) [
    "failureCount", 10, 50, // Failed requests, anything non-200, allow a few more than 0 for user-caused errors like 404s
    "avgProcessingTime", 150, 500 // Average duration of the request, in ms
    ];
// Calculate average processing time for each request
let avgProcessingTime = AppRequests
| where AppRoleName startswith "CatalogService"
| where OperationName != "GET /health/liveness" // Liveness requests don't do any processing, including them would skew the results
| make-series Value = avg(DurationMs) default=0 on TimeGenerated from _timespanStart to _timespanEnd step 1m
| mv-expand TimeGenerated, Value
| extend TimeGenerated = todatetime(TimeGenerated), Value=toreal(Value), MetricName= 'avgProcessingTime';
// Calculate failed requests
let failureCount = AppRequests
| where AppRoleName startswith "CatalogService" // Liveness requests don't do any processing, including them would skew the results
| where OperationName != "GET /health/liveness"
| make-series Value=countif(Success != true) default=0 on TimeGenerated from _timespanStart to _timespanEnd step 1m
| mv-expand TimeGenerated, Value
| extend TimeGenerated = todatetime(TimeGenerated), Value=toreal(Value), MetricName= 'failureCount';
// Union all together and join with the thresholds
avgProcessingTime
| union failureCount
| lookup kind = inner Thresholds on MetricName
| extend IsYellow = iff(todouble(Value) > YellowThreshold and todouble(Value) < RedThreshold, 1, 0)
| extend IsRed = iff(todouble(Value) > RedThreshold, 1, 0)
| project-reorder TimeGenerated, MetricName, Value, IsYellow, IsRed, YellowThreshold, RedThreshold
| extend ComponentName="CatalogService"
Azure Key Vault
The following sample demonstrates an Azure Key Vault query:
let _maxAge = 2d; // Include data only from the last two days
let _timespanStart = ago(_maxAge); // Start time for the time span
let _timespanEnd = now(-2m); // Account for ingestion lag by stripping the last 2m
// For time frame, compare the averages to the following threshold values
let Thresholds = datatable(MetricName: string, YellowThreshold: double, RedThreshold: double) [
    "failureCount", 3, 10 // Failure count on key vault requests
    ];
let failureStats = AzureDiagnostics
| where TimeGenerated > _timespanStart
| where ResourceProvider == "MICROSOFT.KEYVAULT"
// Ignore authentication operations that have a 401. This is normal when using Key Vault SDK. First an unauthenticated request is made, then the response is used for authentication
| where Category=="AuditEvent" and not (OperationName == "Authentication" and httpStatusCode_d == 401)
| where OperationName in ('SecretGet','SecretList','VaultGet') or '*' in ('SecretGet','SecretList','VaultGet')
// Exclude Not Found responses because these happen regularly during 'Terraform plan' operations, when Terraform checks for the existence of secrets
| where ResultSignature != "Not Found"
// Create ResultStatus with all the 'success' results bucketed as 'Success'
// Certain operations like StorageAccountAutoSyncKey have no ResultSignature; for now, also set to 'Success'
| extend ResultStatus = case ( ResultSignature == "", "Success",
                               ResultSignature == "OK", "Success",
                               ResultSignature == "Accepted", "Success",
                               ResultSignature);
failureStats
| make-series Value=countif(ResultStatus != "Success") default=0 on TimeGenerated from _timespanStart to _timespanEnd step 1m
| mv-expand TimeGenerated, Value
| extend TimeGenerated = todatetime(TimeGenerated), Value=toreal(Value), MetricName="failureCount", ComponentName="Keyvault"
| lookup kind = inner Thresholds on MetricName
| extend IsYellow = iff(todouble(Value) > YellowThreshold and todouble(Value) < RedThreshold, 1, 0)
| extend IsRed = iff(todouble(Value) > RedThreshold, 1, 0)
Catalog Service health score
Eventually, you can tie together various health status queries to calculate a health score of a component. The following sample query shows how to calculate a Catalog Service health score:
CatalogServiceHealthStatus()
| union AksClusterHealthStatus()
| union KeyvaultHealthStatus()
| union EventHubHealthStatus()
| where TimeGenerated < ago(2m)
| summarize YellowScore = max(IsYellow), RedScore = max(IsRed) by bin(TimeGenerated, 2m)
| extend HealthScore = 1 - (YellowScore * 0.25) - (RedScore * 0.5)
| extend ComponentName = "CatalogService", Dependencies="AKSCluster,Keyvault,EventHub" // These values are added to build the dependency visualization
| order by TimeGenerated desc
Tip
See more query examples in the Azure Mission-Critical Online GitHub repository.
Set up query-based alerts
Alerts raise immediate attention to issues that reflect or affect health state. Whenever there's a change in health state, either to a degraded (yellow) state or to an unhealthy (red) state, notifications should be sent to accountable team. Set alerts at the root node of the health model to immediately become aware of any business-level change in the health state of the solution. Then, you can look at health model visualizations to get more information and to troubleshoot.
The example uses Azure Monitor alerts to drive automated actions in response to changes in application health state.
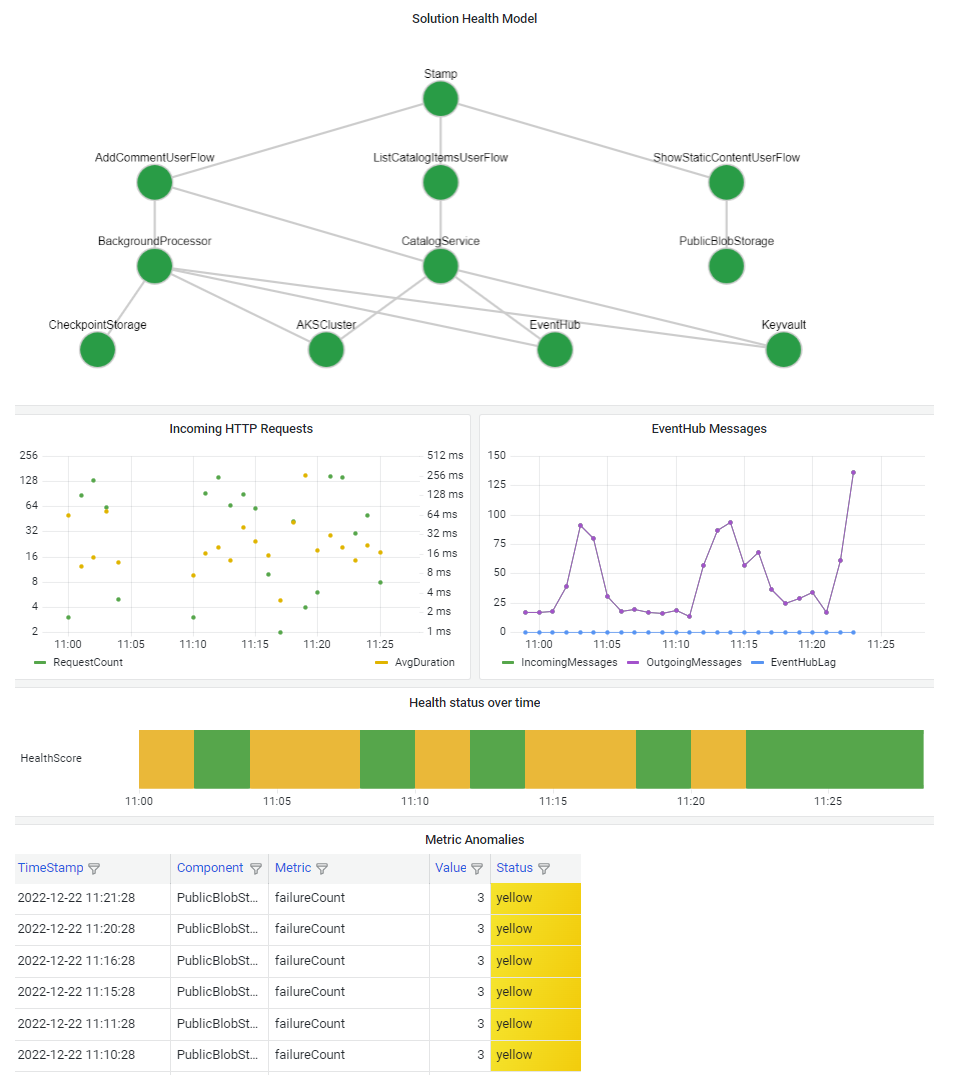
Use dashboards for visualization
It's important to visualize your health model so that you can quickly understand the effect of a component outage on the whole system. The ultimate goal of a health model is to facilitate swift diagnosis by providing informed view into deviations from steady state.
A common way to visualize system health information is to combine a layered health model view with telemetry drill-down capabilities in a dashboard.
The dashboard technology should be able to represent the health model. Popular options include Azure Dashboards, Power BI, and Azure Managed Grafana.