Monitor your networks using Azure Network Watcher
- 9 minutes
Azure Network Watcher
Azure Network Watcher is a regional service that enables you to monitor and diagnose network conditions. Network diagnostic and visualization tools help you understand, diagnose, and gain insights to your network in Azure. Network Watcher is designed to monitor and repair the network health of IaaS products which includes virtual machines, virtual networks, Application Gateways, and Load Balancers.
Azure Network Watcher (video)
Note
Network Watcher is automatically enabled when you create a virtual network.
Azure Network Watcher tools
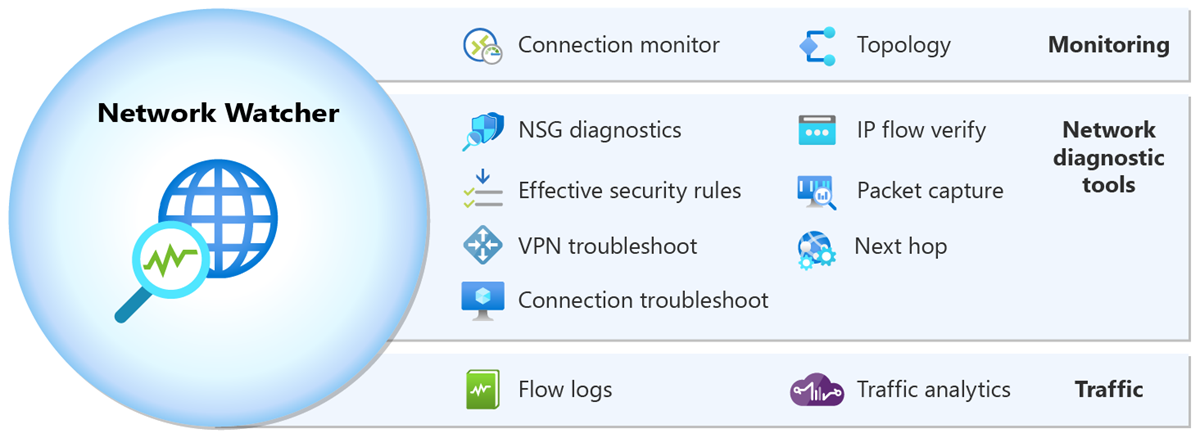
Monitoring tools
- Network Topology generates a visualization of the entire network for understanding network configuration.
- Connection monitor provides end-to-end connection monitoring for Azure and hybrid endpoints.
Diagnostic tools
IP Flow Verify helps you to detect traffic filtering issues at a virtual machine level. It checks if a packet is allowed or denied to or from an IP address (IPv4 or IPv6 address). It also tells you which security rule allowed or denied the traffic.
Next Hop helps you detect routing issues. It checks if traffic is routed correctly to the intended destination.
Effective security rules shows you all security rules applied to the network interface, the subnet the network interface is in, and the aggregate of both.
Connection troubleshoot tests connections between resources. For example, a virtual machine, a virtual machine scale set, or an application gateway.
Packet Capture lets you remotely create packet capture sessions to record all network traffic to and from a virtual machine (VM) or a virtual machine scale set.
VPN troubleshoot enables you to troubleshoot virtual network gateways and their connections.
Traffic tools
Flow logs allows you to log information about your Azure IP traffic and stores the data in Azure storage. You can log IP traffic flowing through a network security group or Azure virtual network.
Traffic analytics provides rich visualizations of flow logs data.
Tip
Learn more about Azure Network Watcher in the Introduction to Network Watcher training module.