Visual Studio debugging tips and tricks
Debugging tips and tricks
Once you're comfortable debugging in Visual Studio, there are many different tips and tricks that can speed up your debugging workflows. The following are useful features to improve your productivity.
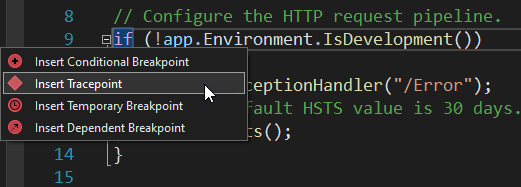
You can right-click in the breakpoint gutter area to set advanced breakpoints more quickly.
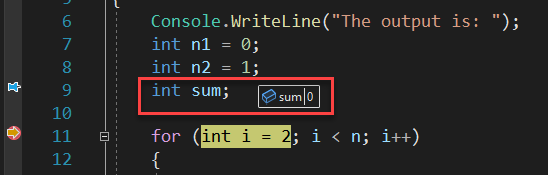
Pin DataTips you're interested in by hovering over a variable and clicking the pin icon. DataTips allow you to easily inspect your variables and still navigate to other code. Pinned DataTips persist across debugging sessions and Visual Studio restarts.
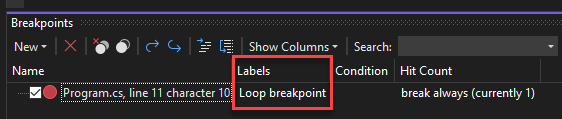
You can label your breakpoints from the breakpoint window or by right-clicking them. Labels make it easier to organize and export breakpoints to an XML file.
You can drag and drop or copy and paste code expressions from the Visual Studio Editor to the watch window to explore their values and properties. This feature works with multiple watch windows.
You can drag and drop your breakpoints from one location to another to reuse the breakpoint. This feature also works with advanced breakpoint options.
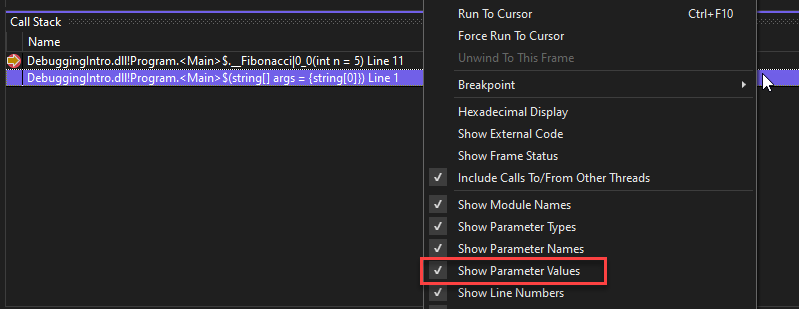
Right-click in the Call Stack window and select the Show Parameter Values option. Once selected, the parameter values are displayed in the Call Stack window along with parameter names and types.
With the debugger paused on a line of code, use the mouse to grab the yellow arrow pointer inside the red breakpoint circle. You can then move the yellow arrow pointer to a different line of code to manually set the next statement for execution.
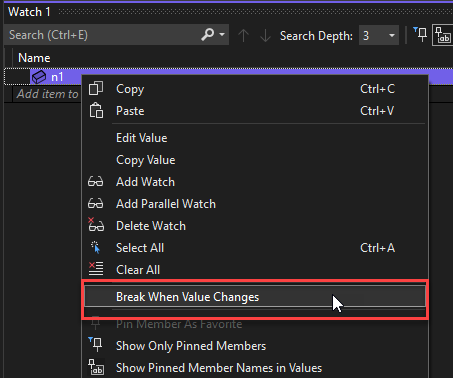
In the Autos, Watch, or Locals window, right-click a property and select Break When Value Changes in the context menu. This data breakpoint breaks execution when the specific object's property changes.
To view return values for your functions, look at the functions that appear in the Autos window while you're stepping through your code.
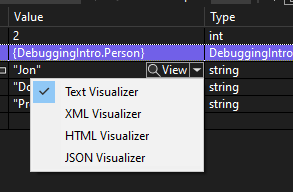
You can use the Visualizer to display the contents of a variable or object in a way that's meaningful for the data type. Select the magnifying glass icon that appears next to a variable in DataTips. The visualizer is also available in the Watch, Autos, Locals, or Quick Watch windows.