Exercise - Debug with Visual Studio Code
It's time to put your newly acquired debugging knowledge into practice. It's your first day on the job, and it's time to put your .NET debugging skills to work by fixing a bug in the company's flagship product, a Fibonacci calculator.
Create a sample .NET project for debugging
To set up Visual Studio Code for .NET debugging, we'll first need a .NET project. Visual Studio Code includes an integrated terminal, which makes creating a new project easy.
In Visual Studio Code, select File > Open Folder.
Create a new folder named
DotNetDebuggingin the location of your choice. Then choose Select Folder.Open the integrated terminal from Visual Studio Code by selecting View > Terminal from the main menu.
In the terminal window, copy and paste the following command:
dotnet new consoleThis command creates a Program.cs file in your folder with a basic "Hello World" program already written. It also creates a C# project file named DotNetDebugging.csproj.
In the terminal window, copy and paste the following command to run the "Hello World" program.
dotnet runThe terminal window displays "Hello World!" as output.
Set up Visual Studio Code for .NET debugging
Open Program.cs by selecting it.
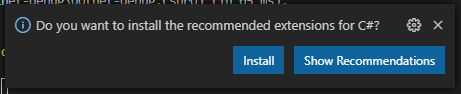
The first time you open a C# file in Visual Studio Code, you'll receive a prompt to install recommended extensions for C#. If you see this prompt, select the Install button in the prompt.
Visual Studio Code will install the C# extension and show another prompt to add required assets to build and debug your project. Select the Yes button.
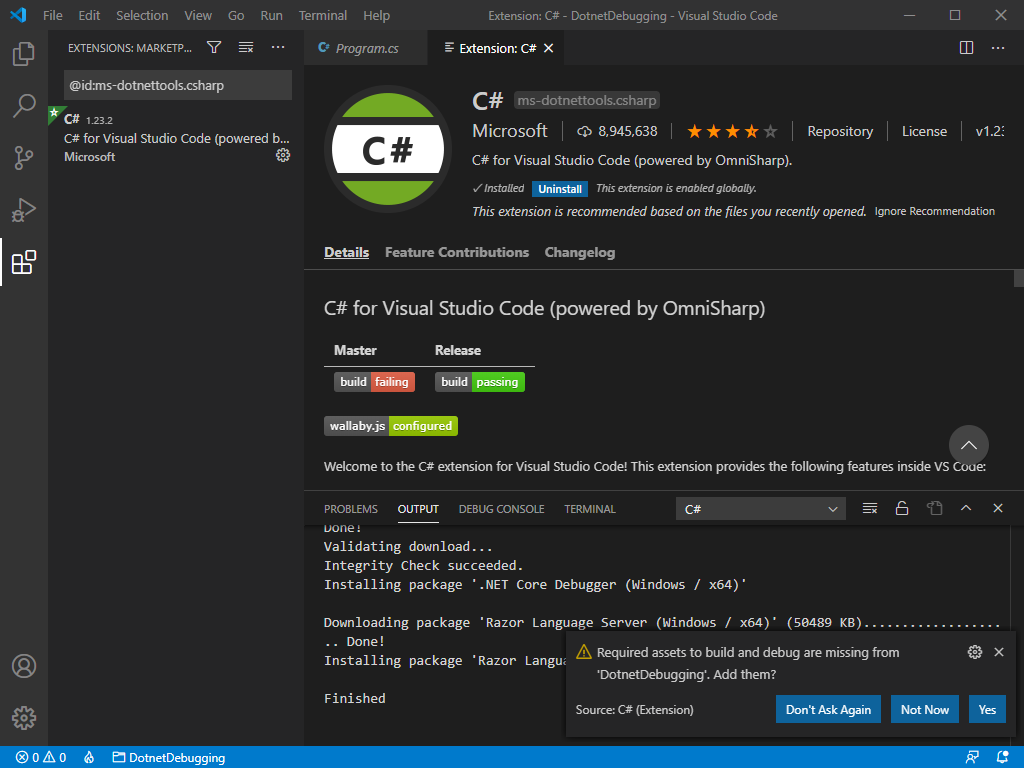
You can close the Extension: C# tab to focus on the code we'll be debugging.
Add the Fibonacci program logic
Our current project writes a "Hello World" message to the console, which doesn't give us much to debug. Instead, you'll use a short .NET program to compute the Nth number of the Fibonacci sequence.
The Fibonacci sequence is a suite of numbers that starts with the numbers 0 and 1, with every other following number being the sum of the two previous ones. The sequence continues as shown here:
0, 1, 1, 2, 3, 5, 8, 13, 21...
Open Program.cs by selecting it.
Replace the contents of Program.cs with the following code:
int result = Fibonacci(5);
Console.WriteLine(result);

static int Fibonacci(int n)
{
    int n1 = 0;
    int n2 = 1;
    int sum;

    for (int i = 2; i < n; i++)
    {
        sum = n1 + n2;
        n1 = n2;
        n2 = sum;
    }

    return n == 0 ? n1 : n2;
}
Note
This code contains an error, which we'll debug later in this module. We don't recommend that you use it in any mission-critical Fibonacci applications until we get that bug fixed.
Save the file by selecting Ctrl+S for Windows and Linux. Select Cmd+S for Mac.
Let's take a look at how the updated code works before we debug it. Run the program by entering the following command in the terminal:
dotnet run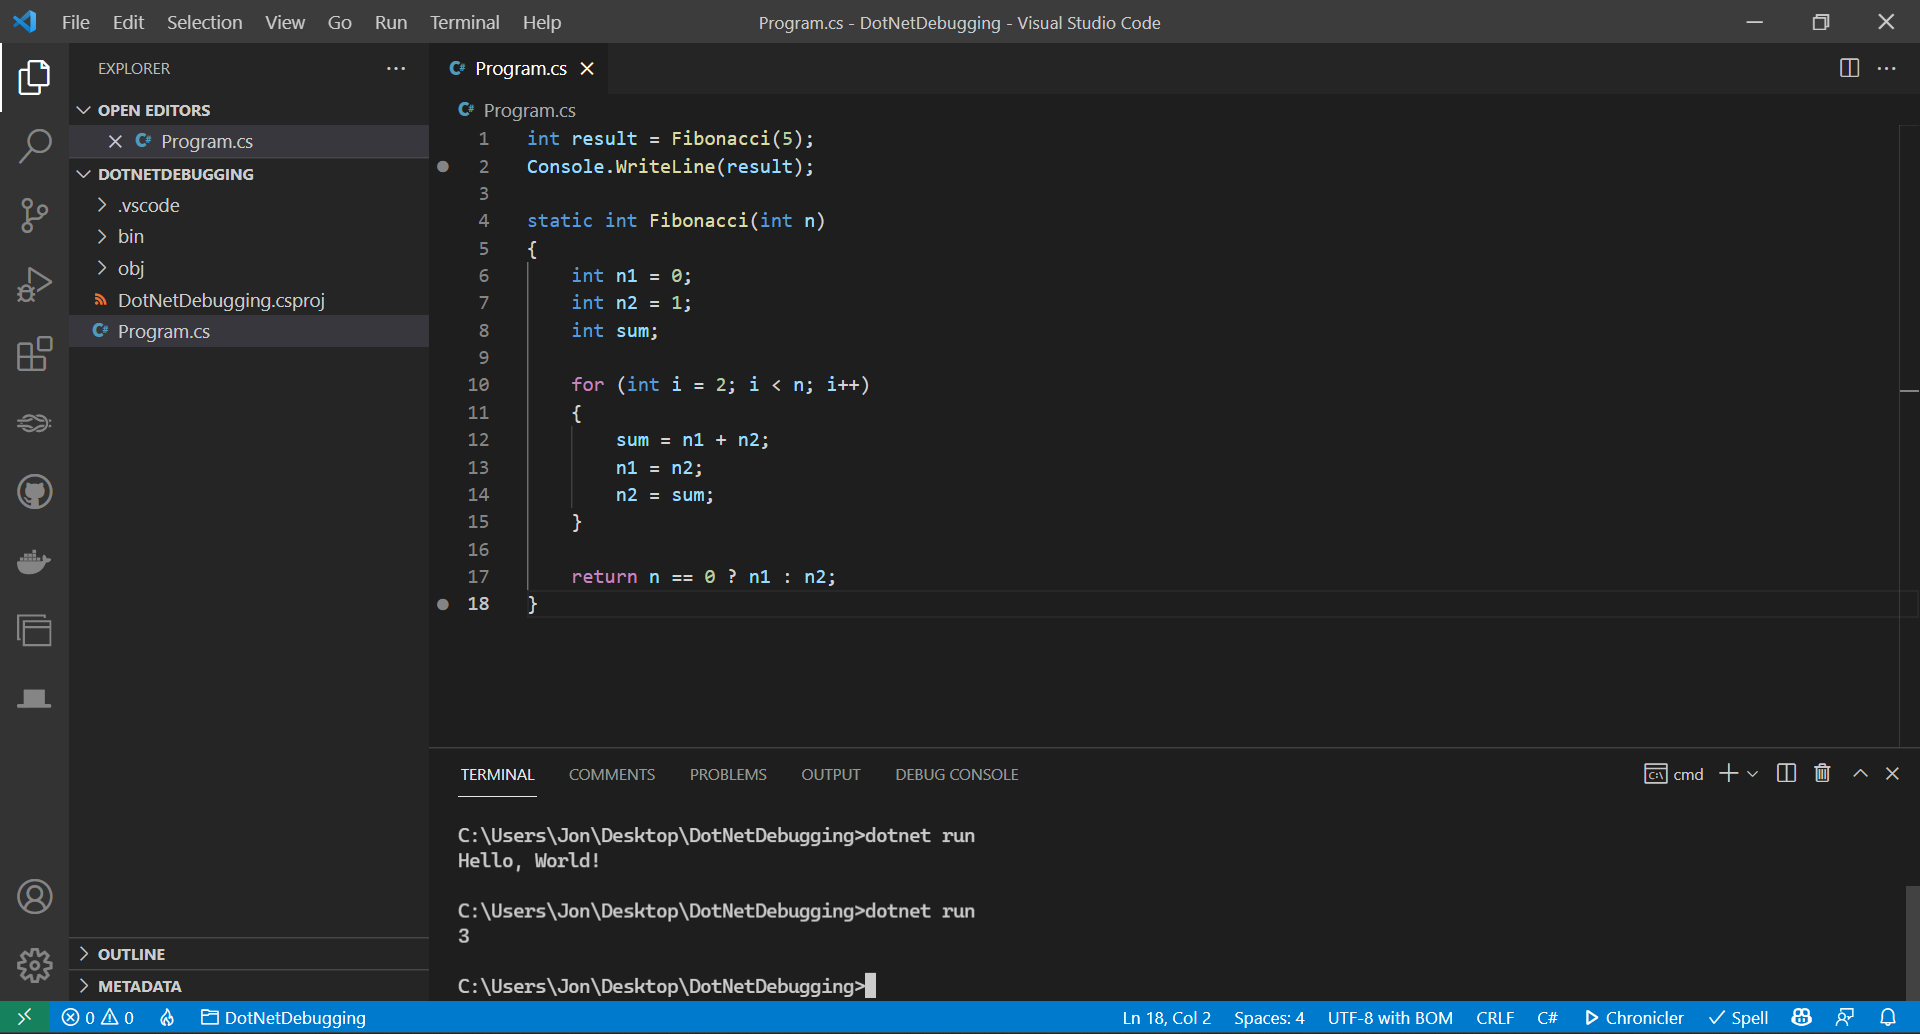
The result, 3, is shown in the terminal output. When you consult this Fibonacci sequence chart that shows the zero-based sequence position for each value in parenthesis, you'll see that the result should have been 5. It's time to get familiar with the debugger and fix this program.
0 (0), 1 (1), 1 (2), 2 (3), 3 (4), 5 (5), 8 (6), 13 (7), 21 (8)...
Analyze the issues
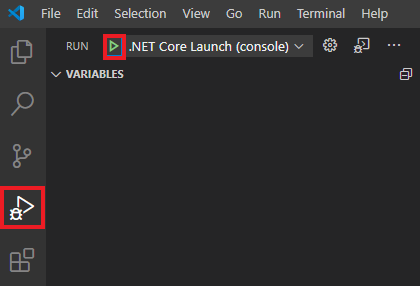
Start the program by selecting the Run and Debug tab on the left, then selecting the Start debugging button. You might need to select the Run and Debug button first, then select the Program.cs file.
You should see the program finish quickly. That's normal because you haven't added any breakpoints yet.
If the debug console doesn't appear, select Ctrl+Shift+Y for Windows and Linux or Cmd+Shift+Y for Mac. You should see several lines of diagnostic information, followed by these lines at the end:
...
Loaded 'C:\Program Files\dotnet\shared\Microsoft.NETCore.App\6.0.0\System.Threading.dll'. Skipped loading symbols. Module is optimized and the debugger option 'Just My Code' is enabled.
Loaded 'C:\Program Files\dotnet\shared\Microsoft.NETCore.App\6.0.0\System.Text.Encoding.Extensions.dll'. Skipped loading symbols. Module is optimized and the debugger option 'Just My Code' is enabled.
3
The program '[88820] DotNetDebugging.dll' has exited with code 0 (0x0).
The lines at the top tell you that the default debugging settings enable the "Just My Code" option. This means the debugger will only debug your code and won't step into the source code for .NET unless you disable this mode. This option allows you to focus on debugging your code.
At the end of the debug console output, you'll see the program writes 3 to the console and then exits with code 0. Usually a program exit code of 0 indicates that the program ran and exited without crashing. However, there's a difference between crashing and returning the correct value. In this case, we asked the program to calculate the fifth value of the Fibonacci sequence:
0 (0), 1 (1), 1 (2), 2 (3), 3 (4), 5 (5), 8 (6), 13 (7), 21 (8)...
The fifth value in this list is 5, but our program returned 3. Let's use the debugger to diagnose and fix this error.
Use breakpoints and step-by-step execution
Add a breakpoint by clicking in the left margin at line 1 on
int result = Fibonacci(5);.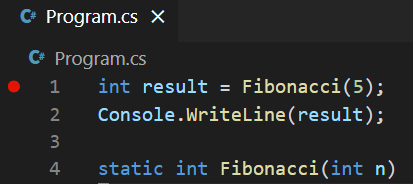
Start debugging again. The program begins to execute. It breaks (pauses execution) on line 1 because of the breakpoint you set. Use the debugger controls to step into the
Fibonacci()function.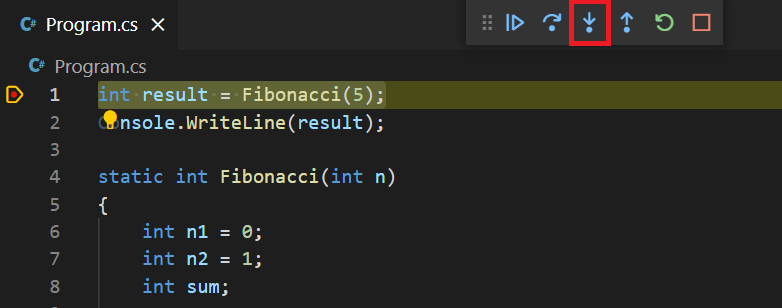
Check the variables state
Now, take some time to inspect the different variables' values by using the Variables panel.
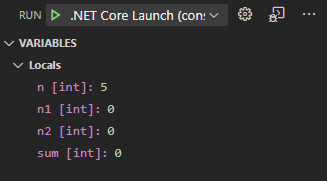
- What is the value shown for the
nparameter? - At the beginning of the function's execution, what are the values for the local variables
n1,n2, andsum?
Next, we'll advance into the
forloop by using the Step Over debugger control.
Continue advancing until you hit the first line inside of the
forloop, on the line that reads:sum = n1 + n2;
Note
You might have noticed that to move through the for(...) {} line requires multiple steps in commands. This situation occurs because there are multiple statements on this line. When you step, you move on to the next statement in your code. Usually, there's one statement per line. If that's not the case, you need multiple steps to move on to the next line.
Think about the code
An important part of debugging is to stop and take some informed guesses about what you think portions of the code (both functions and blocks, such as loops) are trying to do. It's okay if you're not sure, that's part of the debugging process. But being actively engaged in the debugging process will help you locate bugs a lot more quickly.
Before we dig in further, let's remember that the Fibonacci sequence is a series of numbers that starts with the numbers 0 and 1, with every other following number being the sum of the two previous ones.
That means that:
Fibonacci(0) = 0
Fibonacci(1) = 1
Fibonacci(2) = 1 (0 + 1)
Fibonacci(3) = 2 (1 + 1)
Fibonacci(4) = 3 (1 + 2)
Fibonacci(5) = 5 (2 + 3)
Understanding that definition and looking at this for loop, we can deduce that:
- The loop counts from 2 to
n(the Fibonacci sequence number we're looking for). - If
nis less than 2, the loop will never run. Thereturnstatement at the end of the function will return 0 ifnis 0, and 1 ifnis 1 or 2. These are the zero, first, and second values in the Fibonacci series, by definition. - The more interesting case is when
nis greater than 2. In those cases, the current value is defined as the sum of the previous two values. So for this loop,n1andn2are the previous two values, andsumis the value for the current iteration. Because of that, each time we figure out the sum of the previous two values and set it tosum, we update ourn1andn2values.
Okay, we don't need to overthink it past that. We can lean on our debugger a bit. But it's worth thinking about the code to see if it does what we expect and be more informed when it doesn't.
Locate the bug with breakpoints
Stepping through your code can be helpful but tedious, especially when you're working with loops or other code that's called repeatedly. Rather than stepping through the loop over and over, we can set a new breakpoint on the first line of the loop.
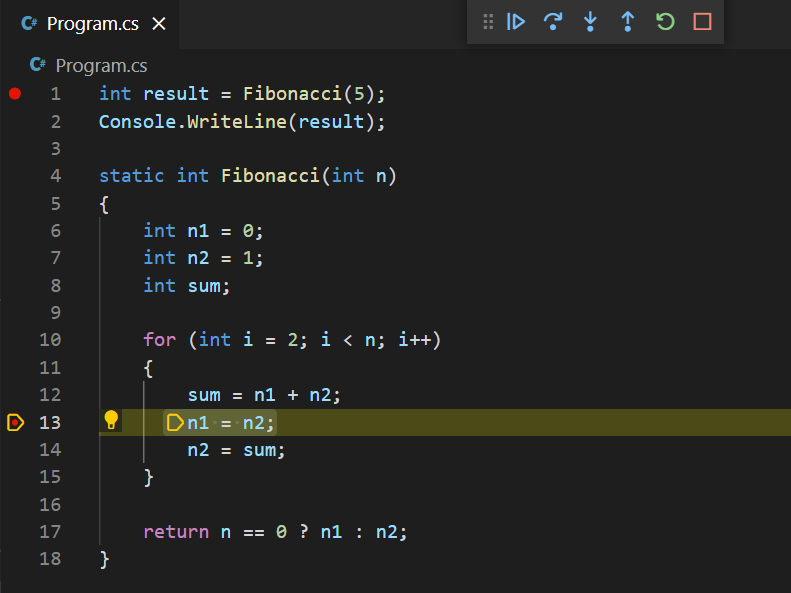
When we're doing this, it's important to be strategic about where we put our breakpoints. We're especially interested in the value of sum, because it represents the current maximum Fibonacci value. Because of that, let's put our breakpoint on the line after sum is set.
Add a second breakpoint on line 13.
Note
If you notice that you keep running your code and then stepping a line or two, you can easily update your breakpoints to more efficient lines.
Now that we have a good breakpoint set in the loop, use the Continue debugger control to advance until the breakpoint is hit. Looking at our local variables, we see the following lines:
n [int]: 5
n1 [int]: 0
n2 [int]: 1
sum [int]: 1
i [int]: 2
These lines all seem correct. The first time through the loop, the
sumof the previous two values is 1. Rather than stepping through line by line, we can take advantage of our breakpoints to jump to the next time through the loop.Select Continue to continue program flow until the next breakpoint is hit, which will be on the next pass through the loop.
Note
Don't be too worried about skipping over the bug when you use Continue. You should expect that you'll often debug through the code several times to find the issue. It's often faster to run through it a few times as opposed to being too cautious when you step through.
This time, we see the following values:
n [int]: 5
n1 [int]: 1
n2 [int]: 1
sum [int]: 2
i [int]: 3
Let's think about it. Do these values still make sense? It seems like they do. For the third Fibonacci number, we're expecting to see our
sumequal to 2, and it is.Okay, let's select Continue to loop it again.
n [int]: 5
n1 [int]: 1
n2 [int]: 2
sum [int]: 3
i [int]: 4
Again, things are looking good. The fourth value in the series is expected to be 3.
At this point, you might start wondering if the code was correct all along and you imagined the bug! Let's keep with it for the last time through the loop. Select Continue one more time.
Wait a minute. The program finished running and printed out 3! That's not right.
Okay, not to worry. We haven't failed, we've learned. We now know that the code runs through the loop correctly until
iequals 4, but then it exits out before computing the final value. I'm starting to get some ideas about where the bug is. Are you?Let's set one more breakpoint on line 17, which reads:
return n == 0 ? n1 : n2;This breakpoint will let us inspect the program state before the function exits. We've already learned all we can expect to from our previous breakpoints on lines 1 and 13, so we can clear them.
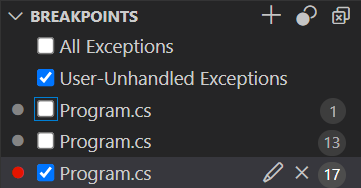
Remove the previous breakpoints on lines 1 and 13. You can do that by clicking them in the margin next to the line numbers, or by clearing the breakpoint check boxes for lines 1 and 13 in the Breakpoints pane in the lower left.
Now that we understand what's going on a lot better and have set a breakpoint designed to catch our program in the act of misbehaving, we should be able to catch this bug!
Start the debugger one last time.
n [int]: 5
n1 [int]: 2
n2 [int]: 3
sum [int]: 3
Well, that's not right. We specifically asked for Fibonacci(5), and we got Fibonacci(4). This function returns
n2, and each loop iteration calculates thesumvalue and setsn2equal tosum.Based on this information, and our previous debug run, we can see that the loop exited when
iwas 4, not 5.Let's look at the first line of the
forloop a little closer.for (int i = 2; i < n; i++)Okay, wait a minute! That means that it will exit as soon as the top of the for loop sees that
iis no longer less thann. That means that the loop code won't run for the case whereiequalsn. It seems like what we wanted was to run untili <= n, instead:for (int i = 2; i <= n; i++)So with that change, your updated program should look like this example:
int result = Fibonacci(5);
Console.WriteLine(result);

static int Fibonacci(int n)
{
    int n1 = 0;
    int n2 = 1;
    int sum;

    for (int i = 2; i <= n; i++)
    {
        sum = n1 + n2;
        n1 = n2;
        n2 = sum;
    }

    return n == 0 ? n1 : n2;
}
Stop the debugging session if you haven't already.
Next, make the preceding change to line 10 and leave our breakpoint on line 17.
Restart the debugger. This time, when we hit the breakpoint on line 17, we'll see the following values:
n [int]: 5
n1 [int]: 3
n2 [int]: 5
sum [int]: 5
Hey! It looks like we got it! Great job, you've saved the day for Fibonacci, Inc.!
Select Continue just to make sure the program returns the correct value.
5
The program '[105260] DotNetDebugging.dll' has exited with code 0 (0x0).
And that returns the correct output.
You did it! You've debugged some code you didn't write by using the .NET debugger in Visual Studio Code.
In the next unit, you'll learn how to make the code you write easier to debug by using the logging and tracing features that are built into .NET.