Track adoption and value
Governance without measurement is guesswork. To demonstrate that your platform investment delivers value, you need a structured approach to tracking adoption signals and translating them into business outcomes that stakeholders understand.
Understand the measurement hierarchy
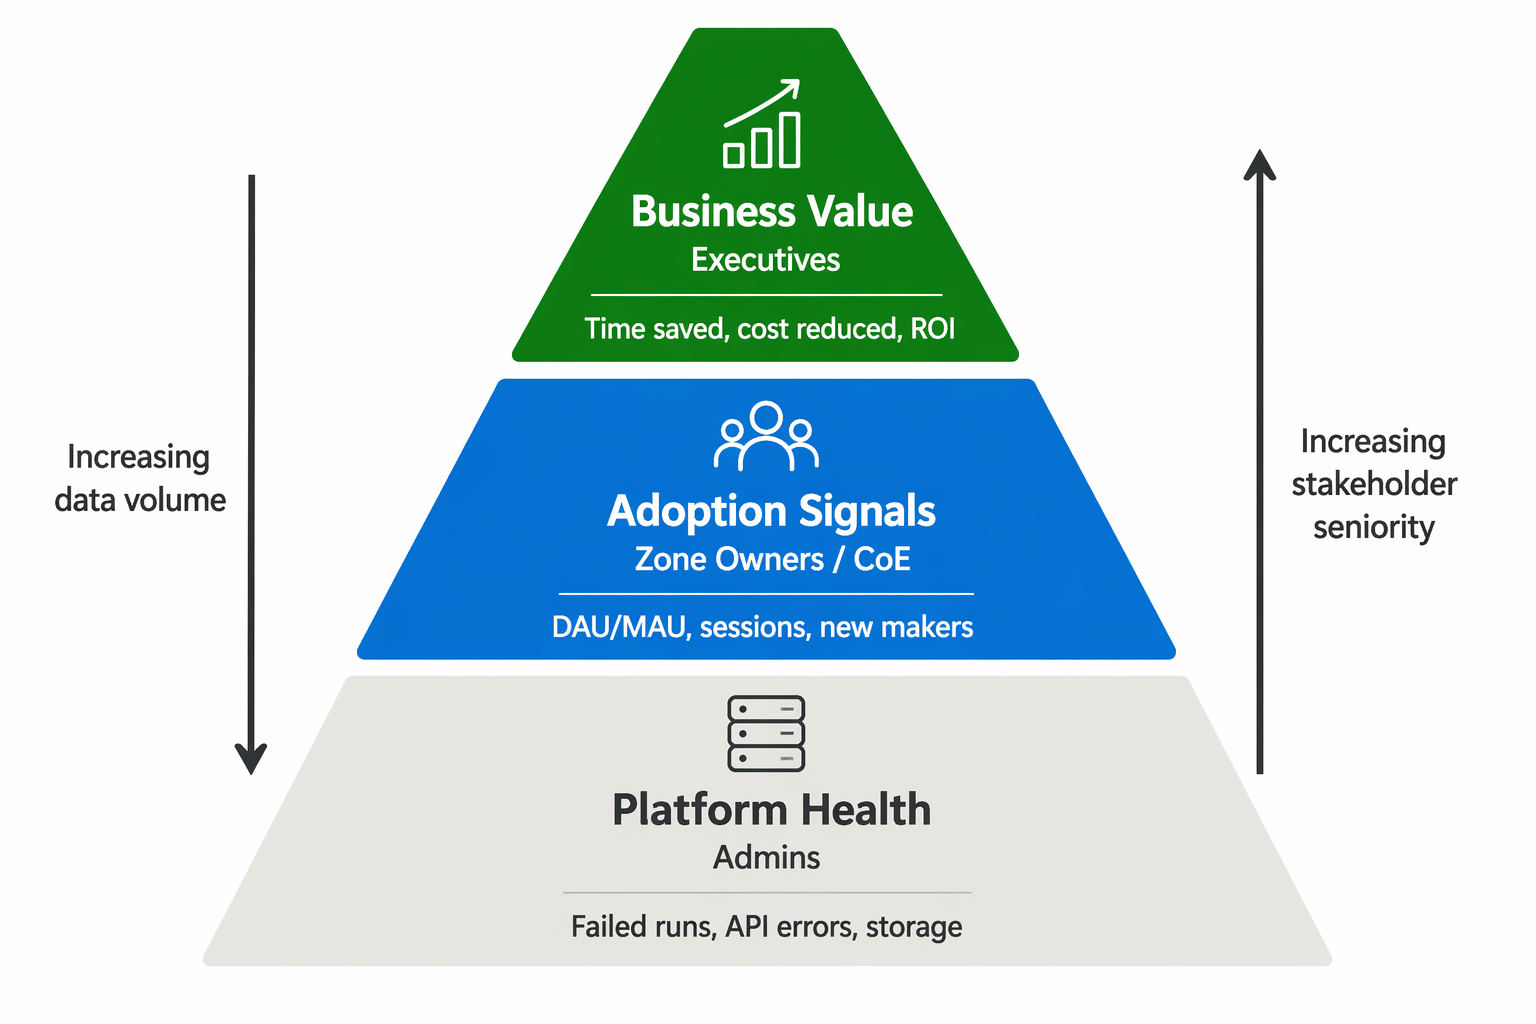
Adoption measurement operates at three levels, each serving a different audience:
| Level | What it measures | Who needs it | Example metrics |
|---|---|---|---|
| Platform health | Is the estate running smoothly? | Platform admins | Failed flow runs, API errors, storage utilization |
| Adoption signals | Are people using what we built? | Zone owners, CoE leads | DAU/MAU, sessions, new makers, app launches |
| Business value | Is the organization getting return? | Executive sponsors | Time saved, cost reduced, error rate improvements |
Most organizations get stuck at the first level. Moving to levels two and three requires intentional configuration of the admin center's analytics capabilities and a framework for connecting usage data to business outcomes.
Configure tenant-level analytics
The Power Platform admin center provides built-in analytics across all products at no extra cost. These reports aggregate data from environments across all regions in your tenant.
To enable tenant-level analytics:
- Sign in to the Power Platform admin center as a Power Platform admin, Global admin, or Delegated admin.
- Go to Analytics and select the product you want to monitor (Power Apps, Power Automate, or Copilot Studio).
- If prompted, enable data collection. Data appears within approximately 24 hours.
Power Apps analytics
The tenant-level Power Apps reports track:
- Unique users - Distinct users with activity in the reporting window.
- Total sessions - App sessions initiated across the tenant.
- Apps used - Count of apps with at least one session.
- New users - First-time app users (growth signal).
- Maker activity - Apps created, connections referenced, and active makers.
Power Automate analytics
Flow-level reports provide operational and adoption visibility:
- Total flows - Cloud flows with usage events in the past 30 days.
- Total runs and successful runs - Volume and success rate.
- Failed runs - Recurring failures that indicate quality issues.
- Shared flows - Collaboration indicator showing team adoption.
Copilot Studio analytics
The Copilot Hub in the admin center provides a centralized view of AI agent adoption:
- Message consumption - Total messages processed across agents.
- Active agents - Agents with sessions in the last 28 days
- Agent session success rate - Completion percentage
- Top 10 agents by monthly active sessions - Identifies high-value agents
Note
Analytics data refreshes approximately every 24 hours and retains up to 28 days of history. For longer retention or custom reporting, export data to Power BI or Azure Data Lake through Azure Synapse Link.
Use the Usage page for cross-product visibility
The Usage page in the admin center (generally available August 2026) provides a single location to track engagement across Power Apps, Power Automate, and Copilot Studio. Unlike individual product analytics, this page highlights your highest-impact resources in one view.
The Usage page tracks:
| Product | Key metrics |
|---|---|
| Power Apps | Total distinct users, per-app distinct users, daily active usage trendline |
| Power Automate | Total flow runs, per-flow distinct runs, daily active runs trendline |
| Copilot Studio | Total agent sessions, per-agent sessions, daily active sessions trendline |
Use this page for executive briefings and adoption reviews. The trendlines reveal whether adoption is growing, plateauing, or declining - signals that inform your community and enablement investments.
Define a business value framework
Usage metrics alone don't prove value. Stakeholders want to know: "What did we get for the investment?" A structured value framework connects platform activity to business outcomes.
Identify value drivers
Every Power Platform solution delivers value through one or more of these drivers:
| Driver | What it means | Example KPIs |
|---|---|---|
| Performance improvement | Better outcomes, faster delivery, higher satisfaction | Time-to-market reduction, customer satisfaction score |
| Cost savings | Automating manual work, reducing errors, optimizing resources | Hours saved per month, reduced contractor spend |
| Risk mitigation | Improved compliance, fewer outages, better data security | Compliance audit pass rate, mean time to recovery |
| Business transformation | New capabilities, market adaptation, legacy replacement | New revenue streams enabled, systems retired |
Measure tangible and intangible value
Not all value appears on a balance sheet, but both types matter:
| Tangible (quantifiable) | Intangible (qualitative) |
|---|---|
| Revenue growth | Risk mitigation and compliance posture |
| Reduced maintenance cost | Fewer operational disruptions |
| Reduced paperwork and admin time | Improved employee experience |
| Resource optimization | Improved data security awareness |
Apply the four-step measurement process
- Centralize objectives - Document what each team is trying to achieve with their Power Platform solutions. Align these to organizational OKRs (Objectives and Key Results).
- Identify metrics - Choose metrics aligned with those objectives. Good metrics are expressed as time, rate, scale, number, or percentage.
- Collect and analyze data - Gather data from admin center analytics, solution-specific telemetry, and stakeholder interviews. Analyze trends in Power BI.
- Report and present - Tailor reports to your audience. Executives want business impact; zone owners want adoption trends; makers want feature-level engagement.
Tip
Start small. Pick two or three high-value solutions and measure their before-and-after impact. Use those proof points to build the business case for broader measurement investment.
Build adoption dashboards
Combine admin center data with business context in Power BI dashboards that serve different audiences:
- Executive dashboard - Monthly active users, solutions in production, estimated hours saved, cost avoidance
- Platform health dashboard - Failed runs, storage trends, environment count, security score
- Maker engagement dashboard - New makers per month, apps published, community event attendance, training completion rates
The admin center's built-in reports provide the raw signals. Power BI lets you layer in business context (like cost-per-hour assumptions or solution ownership data) that converts usage numbers into value narratives.