Explore Query Store
The SQL Server Query Store is a per-database feature that automatically captures a history of queries, plans, and runtime statistics, simplifying performance troubleshooting and query tuning. It also provides insights into database usage patterns and resource consumption.
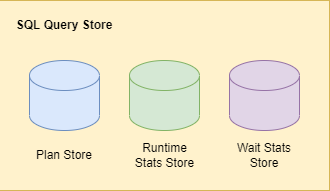
The Query Store consists of three stores:
- Plan store: Stores estimated execution plan information.
- Runtime stats store: Stores execution statistics information.
- Wait stats store: Persists wait statistics information.
Enable the Query Store
The Query Store is enabled by default in Azure SQL databases. If you want to use it with SQL Server and Azure Synapse Analytics, you need to enable it first. To enable the Query Store feature, use the following query valid for your environment:
-- SQL Server
ALTER DATABASE <database_name> SET QUERY_STORE = ON (OPERATION_MODE = READ_WRITE);

-- Azure Synapse Analytics
ALTER DATABASE <database_name> SET QUERY_STORE = ON;
How the Query Store collects data
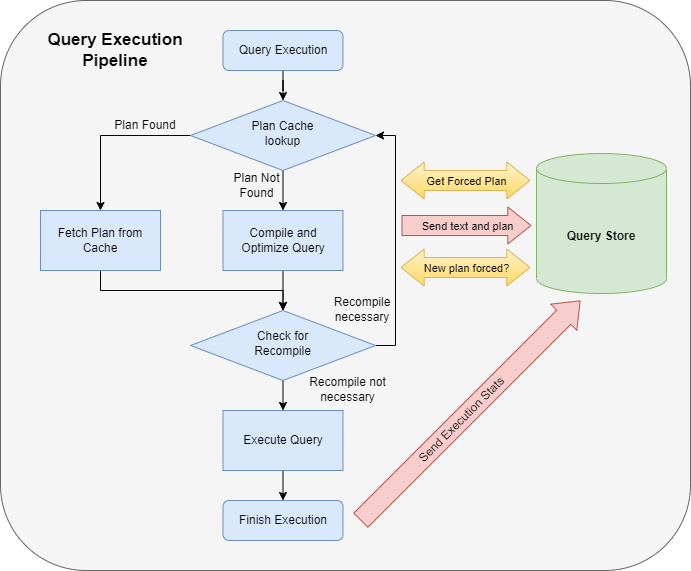
The Query Store integrates with the query processing pipeline at multiple stages. At each integration point, data is collected in memory and written to disk asynchronously to minimize I/O overhead. The integration points are as follows:
When a query executes for the first time, its query text and initial estimated execution plan are sent to the Query Store and persisted.
The plan updates in the Query Store when a query recompile. If the recompile results in a newly generated execution plan, it also persists in the Query Store to augment the previous plans. Additionally, the Query Store keeps track of the execution statistics for each query plan for comparison purposes.
During the compile and check for recompile phases, the Query Store identifies if there's a forced plan for the query to be executed. The query is recompiled if the Query Store provides a forced plan different from the plan in the procedure cache.
When a query executes, its runtime statistics persist in the Query Store. The Query Store aggregates this data to ensure an accurate representation of every query plan.
To learn more about how Query Store collects data, see How Query Store collects data.
Common scenarios
The SQL Server Query Store provides valuable insights into the performance of database operations. Common scenarios include:
- Identifying and fixing performance regressions due to inferior query execution plan selection.
- Identifying and tuning the highest resource consumption queries.
- A/B testing to evaluate the impacts of database and application changes.
- Ensuring performance stability after SQL Server upgrades.
- Determining the most frequently used queries.
- Auditing the history of query plans for a query.
- Identifying and improving unplanned workloads.
- Understanding the prevalent wait categories of a database and the contributing queries and plans affecting wait times.
- Analyzing database usage patterns over time in terms of resource consumption (CPU, I/O, Memory).
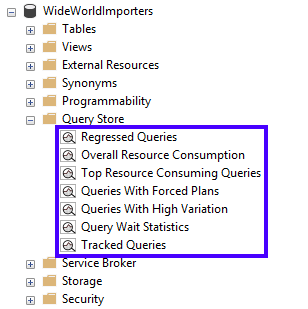
Discover the Query Store views
Once Query Store is enabled on a database, the Query Store folder is visible for the database in Object Explorer. For Azure Synapse Analytics, the Query Store views are displayed under System Views. The Query Store views provide aggregated, quick insights into the performance aspects of the SQL Server database.
Regressed Queries
A regressed query experiences performance degradation over time due to execution plan changes. Estimated execution plans can change due to various factors, including schema changes, statistics changes, and index changes. Investigating the procedure cache might be the first instinct, but it only stores the latest execution plan for a query, and plans can be evicted based on the system's memory demands. The Query Store, however, persists multiple execution plans for each query, allowing the flexibility to choose a specific plan through plan forcing to address query performance regression caused by plan changes.
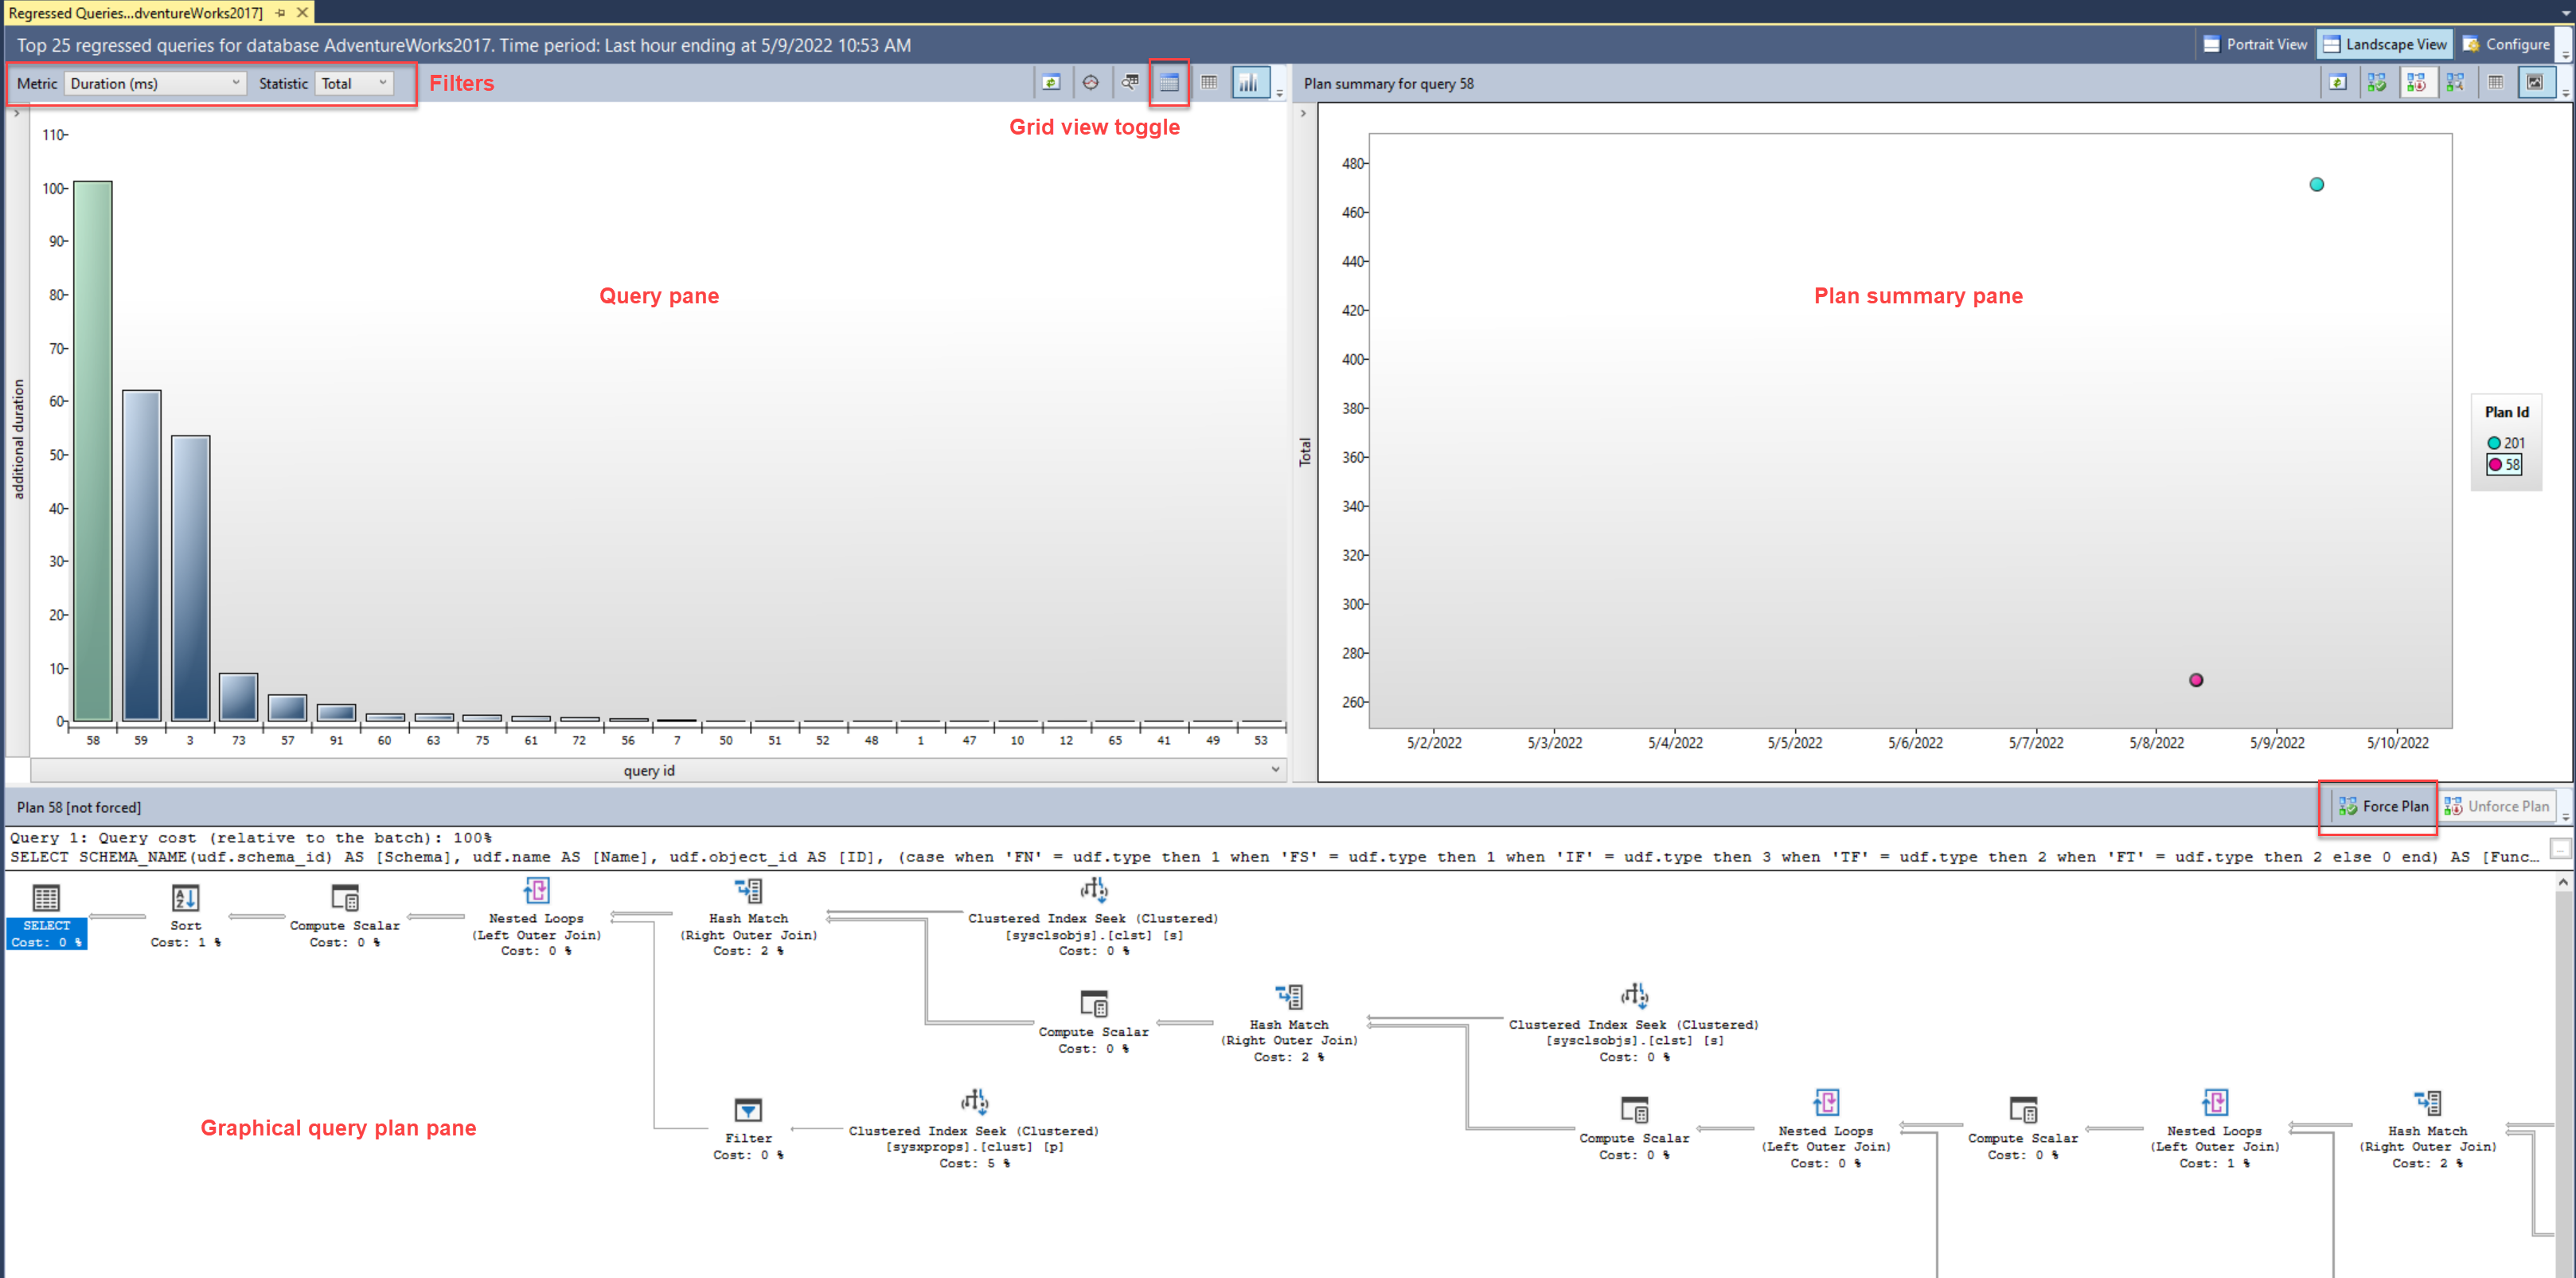
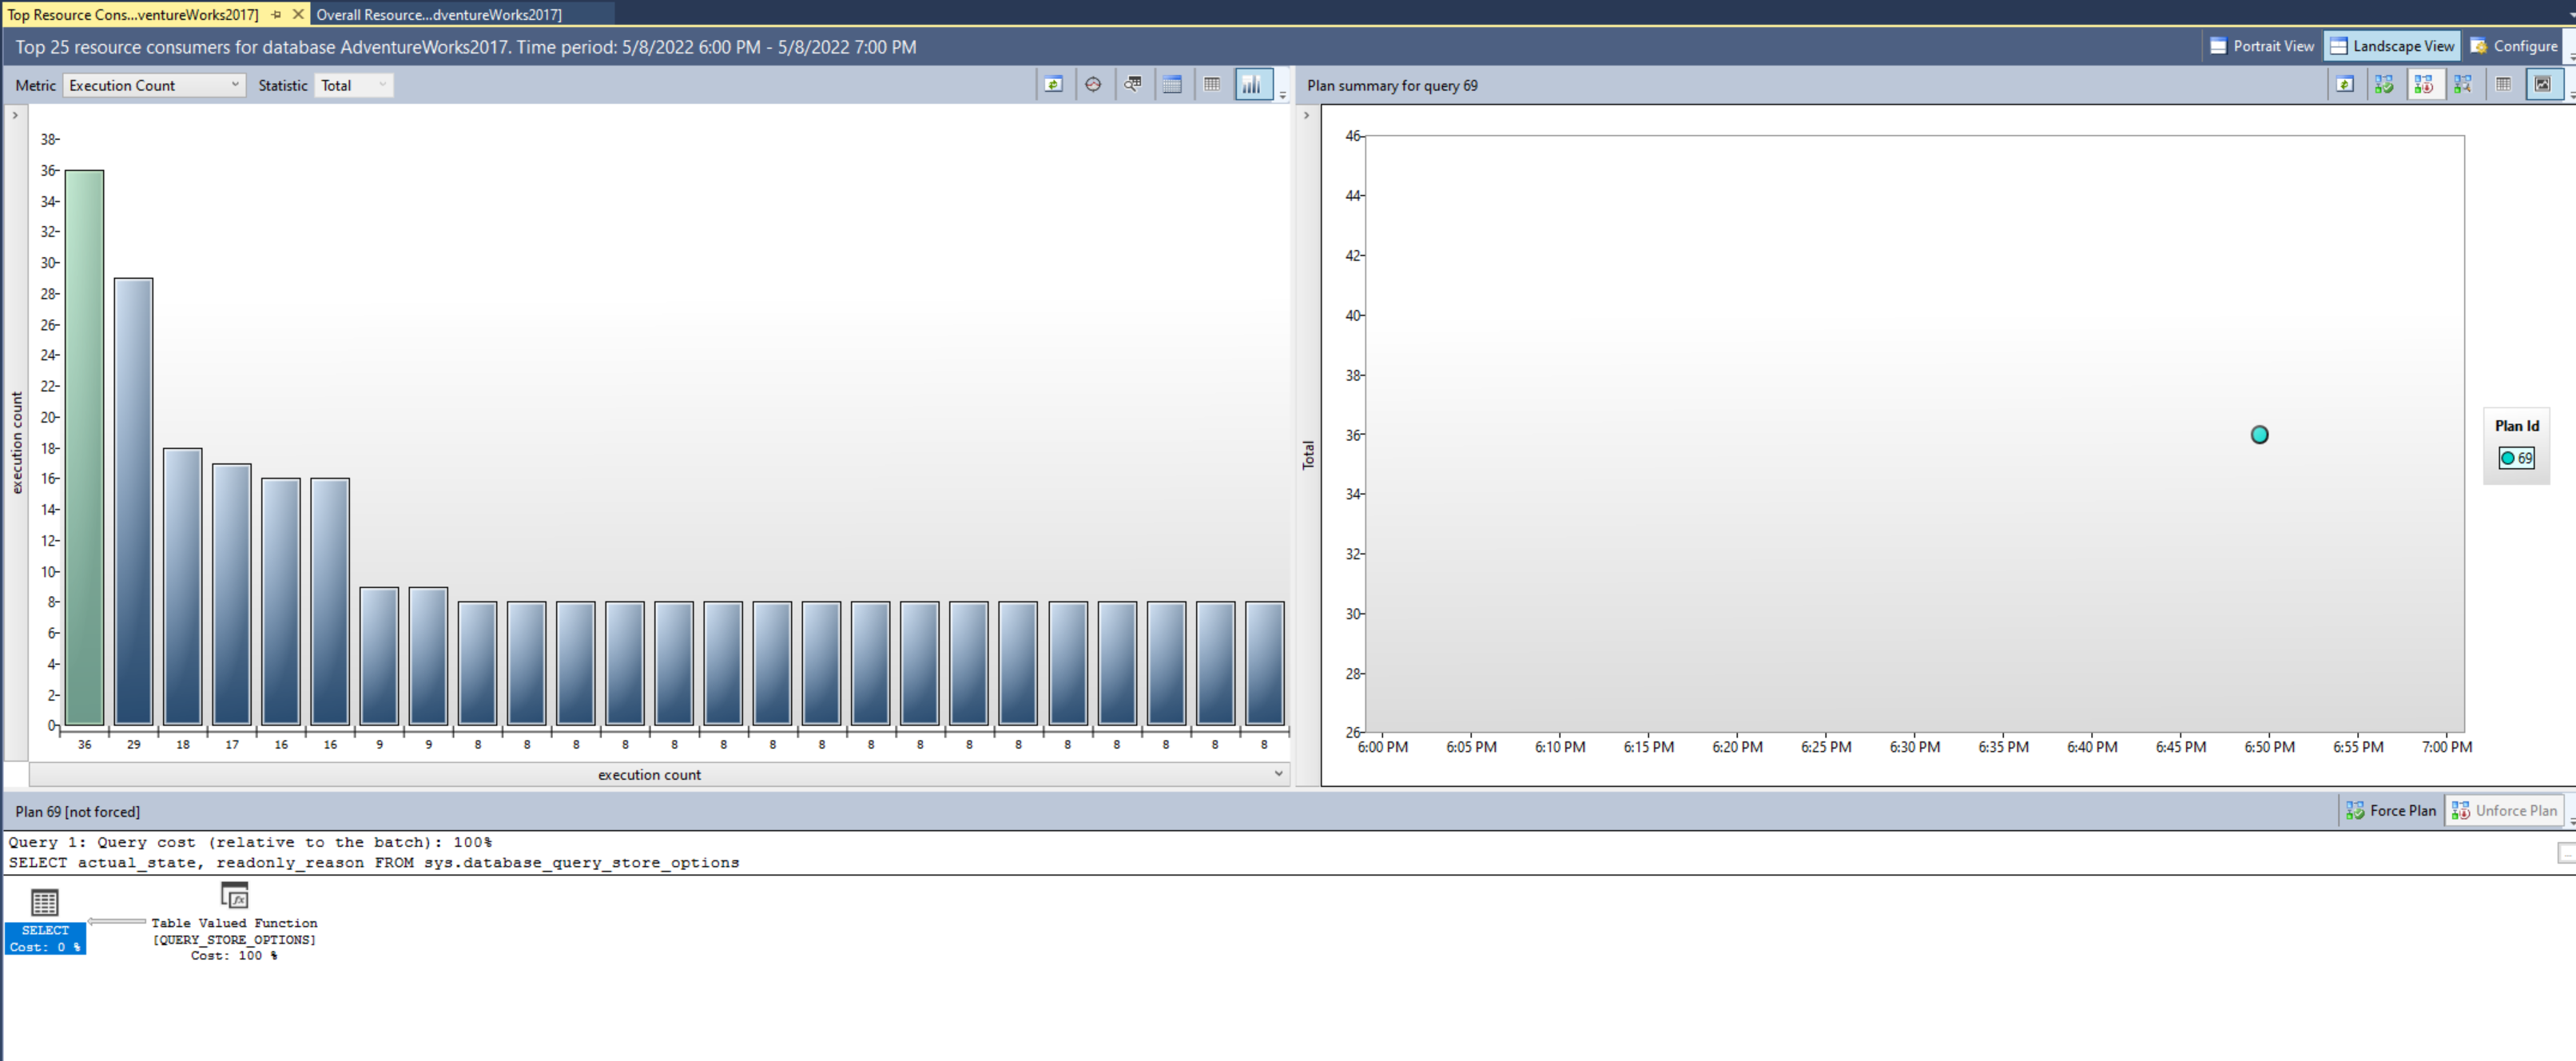
The Regressed Queries view can pinpoint queries whose execution metrics are regressing due to execution plan changes over a specified timeframe. This view allows filtering based on a selected metric (such as duration, CPU time, row count, and more) and a statistic (total, average, min, max, or standard deviation). It then lists the top 25 regressed queries based on the provided filter. By default, a graphical bar chart view of the queries is displayed, but you can optionally view the queries in a grid format.
After selecting a query from the top-left query pane, the plan summary pane displays the persisted query plans associated with the query over time. Selecting a query plan in the Plan Summary pane shows a graphical query plan in the bottom pane. Toolbar buttons in both the plan summary pane and graphical query plan pane allow you to force the selected plan for the selected query. This pane structure and behavior are consistently used across all SQL Query views.
Alternatively, you can use the sp_query_store_force_plan stored procedure to use plan forcing.
EXEC sp_query_store_force_plan @query_id=73, @plan_id=79
Overall Resource Consumption
The Overall Resource Consumption view allows for analyzing total resource consumption for multiple execution metrics (such as execution count, duration, wait time, and more) for a specified timeframe. The rendered charts are interactive; when selecting a measure from one of the charts, a drill through view displaying the queries associated with the chosen measure displays in a new tab.
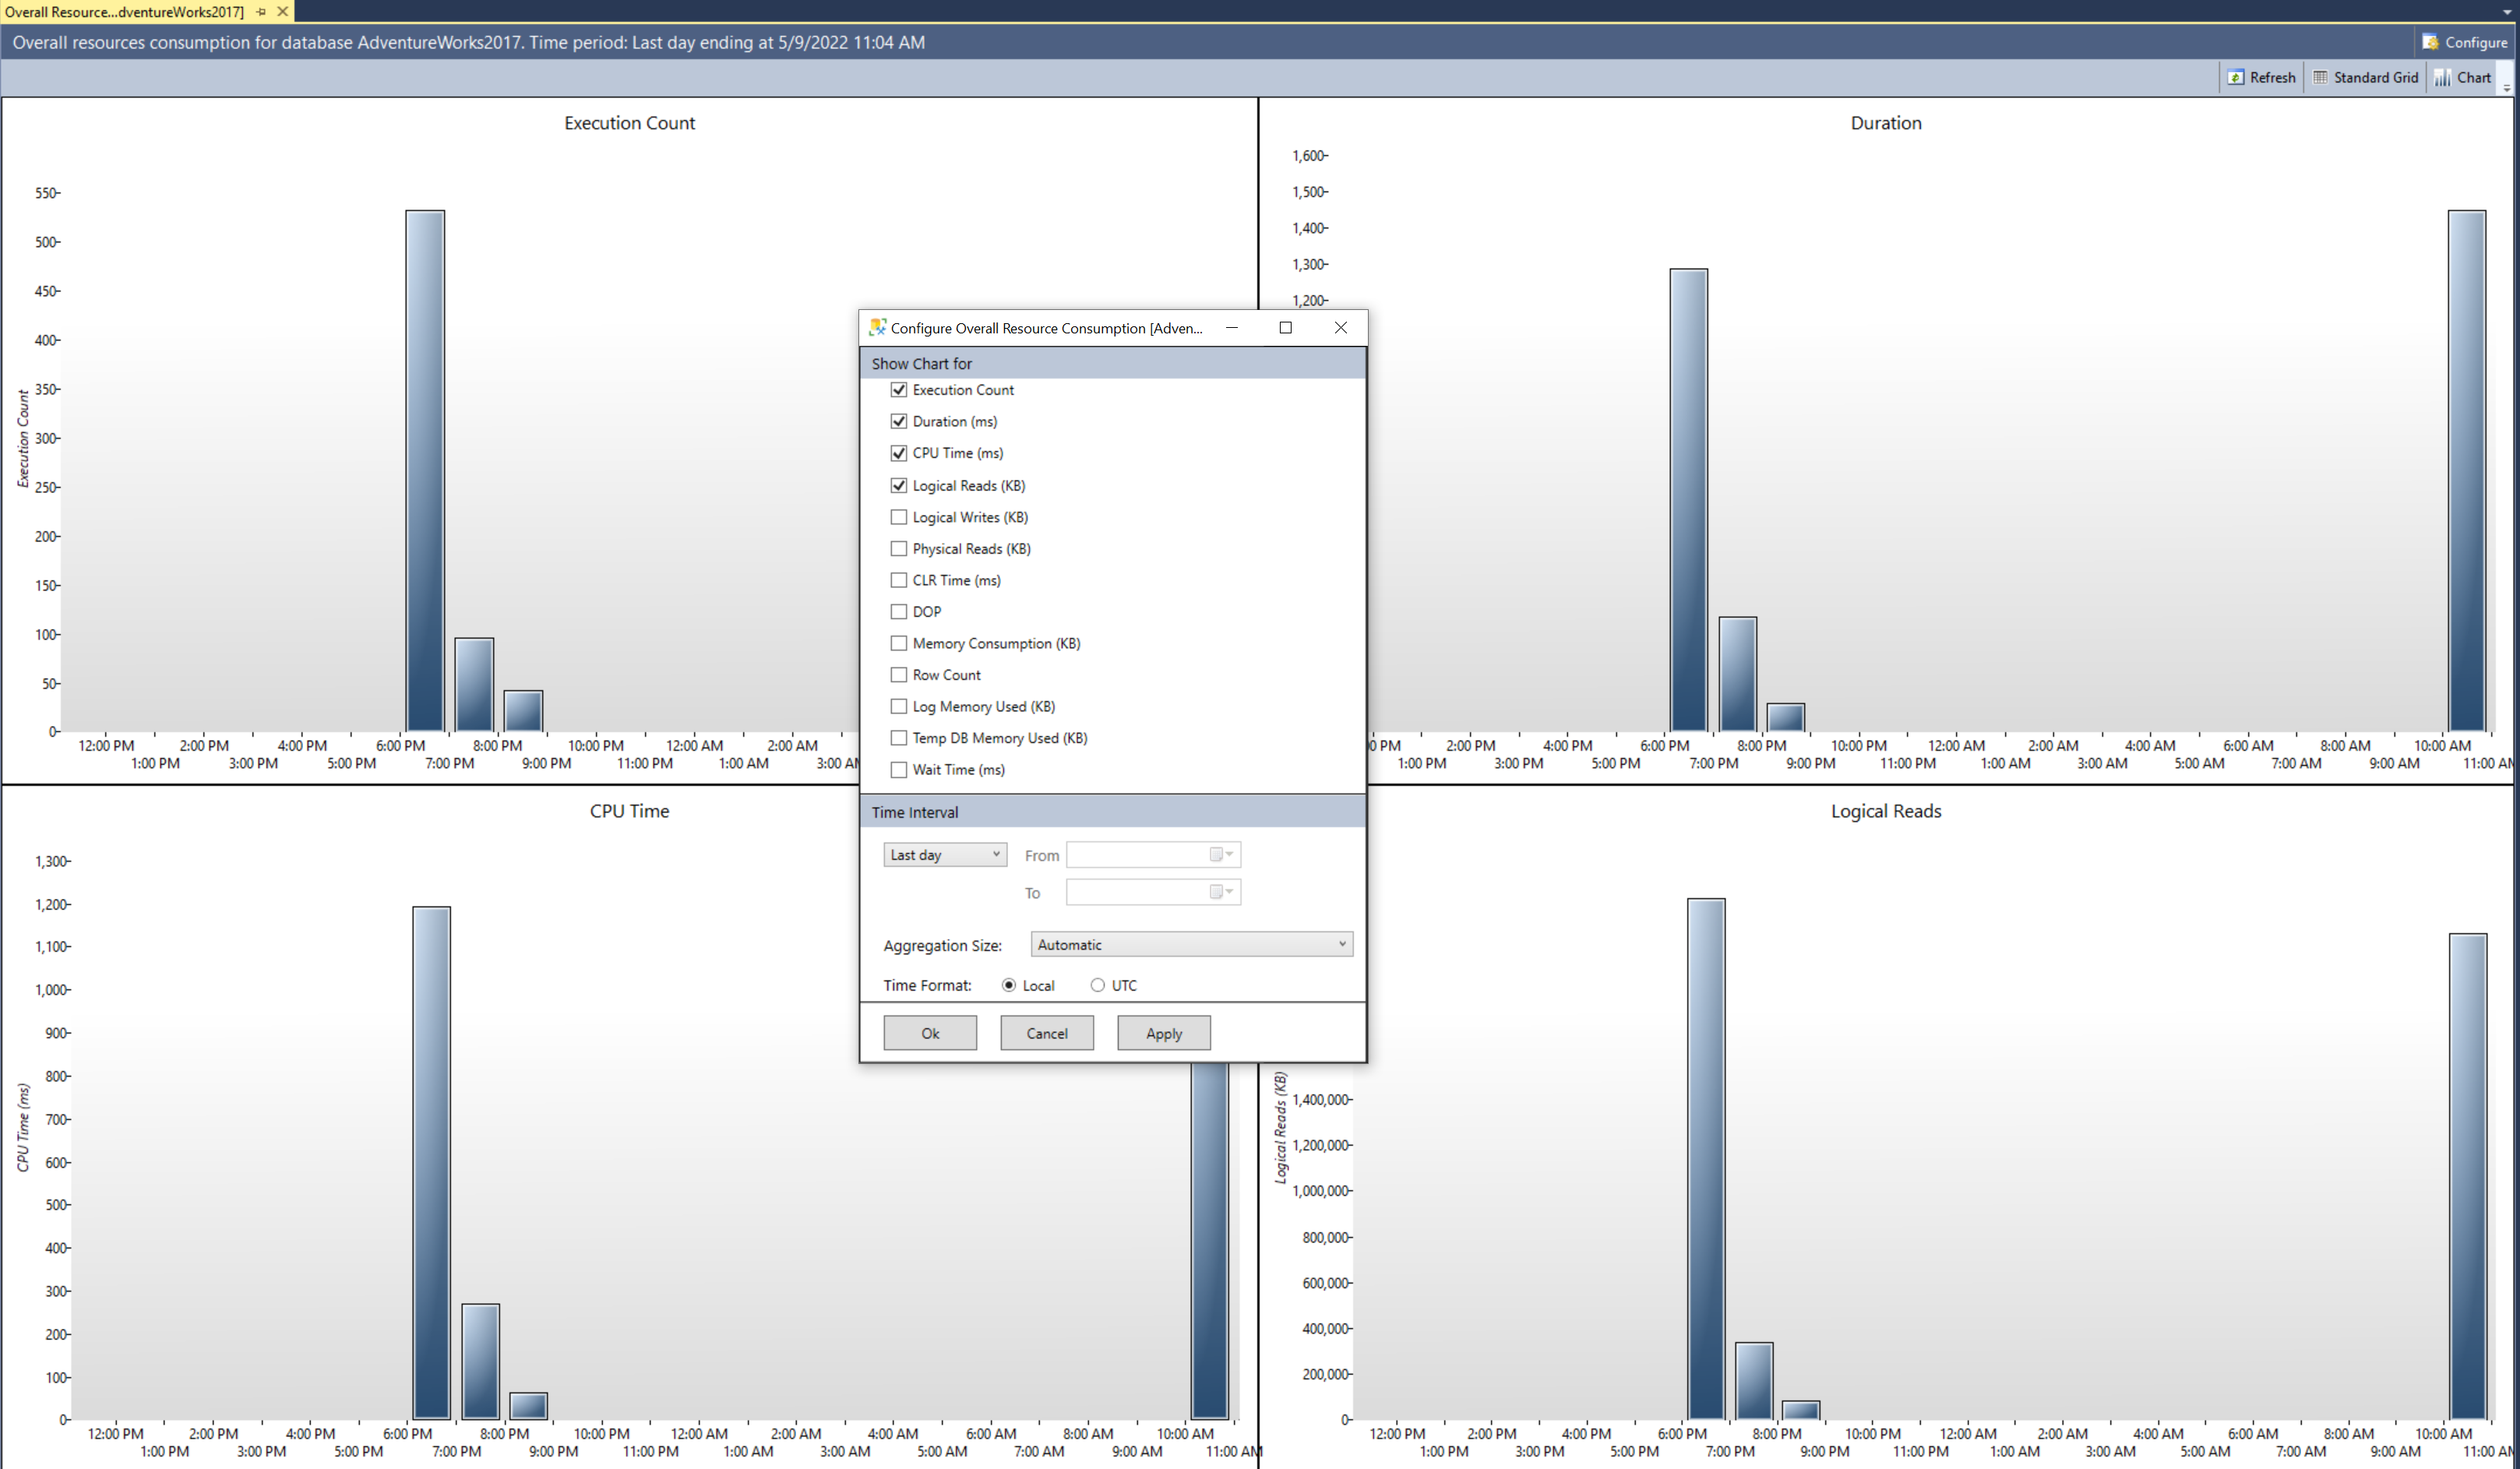
The details view provides the top 25 resource consumer queries that contributed to the metric that was selected. This details view uses the consistent interface that allows for the inspection of the associated queries and their details, evaluate saved estimated query plans, and optionally use plan forcing to improve performance. This view is valuable when system resource contention becomes an issue, such as when CPU usage reaches capacity.
Top Resource Consuming Queries
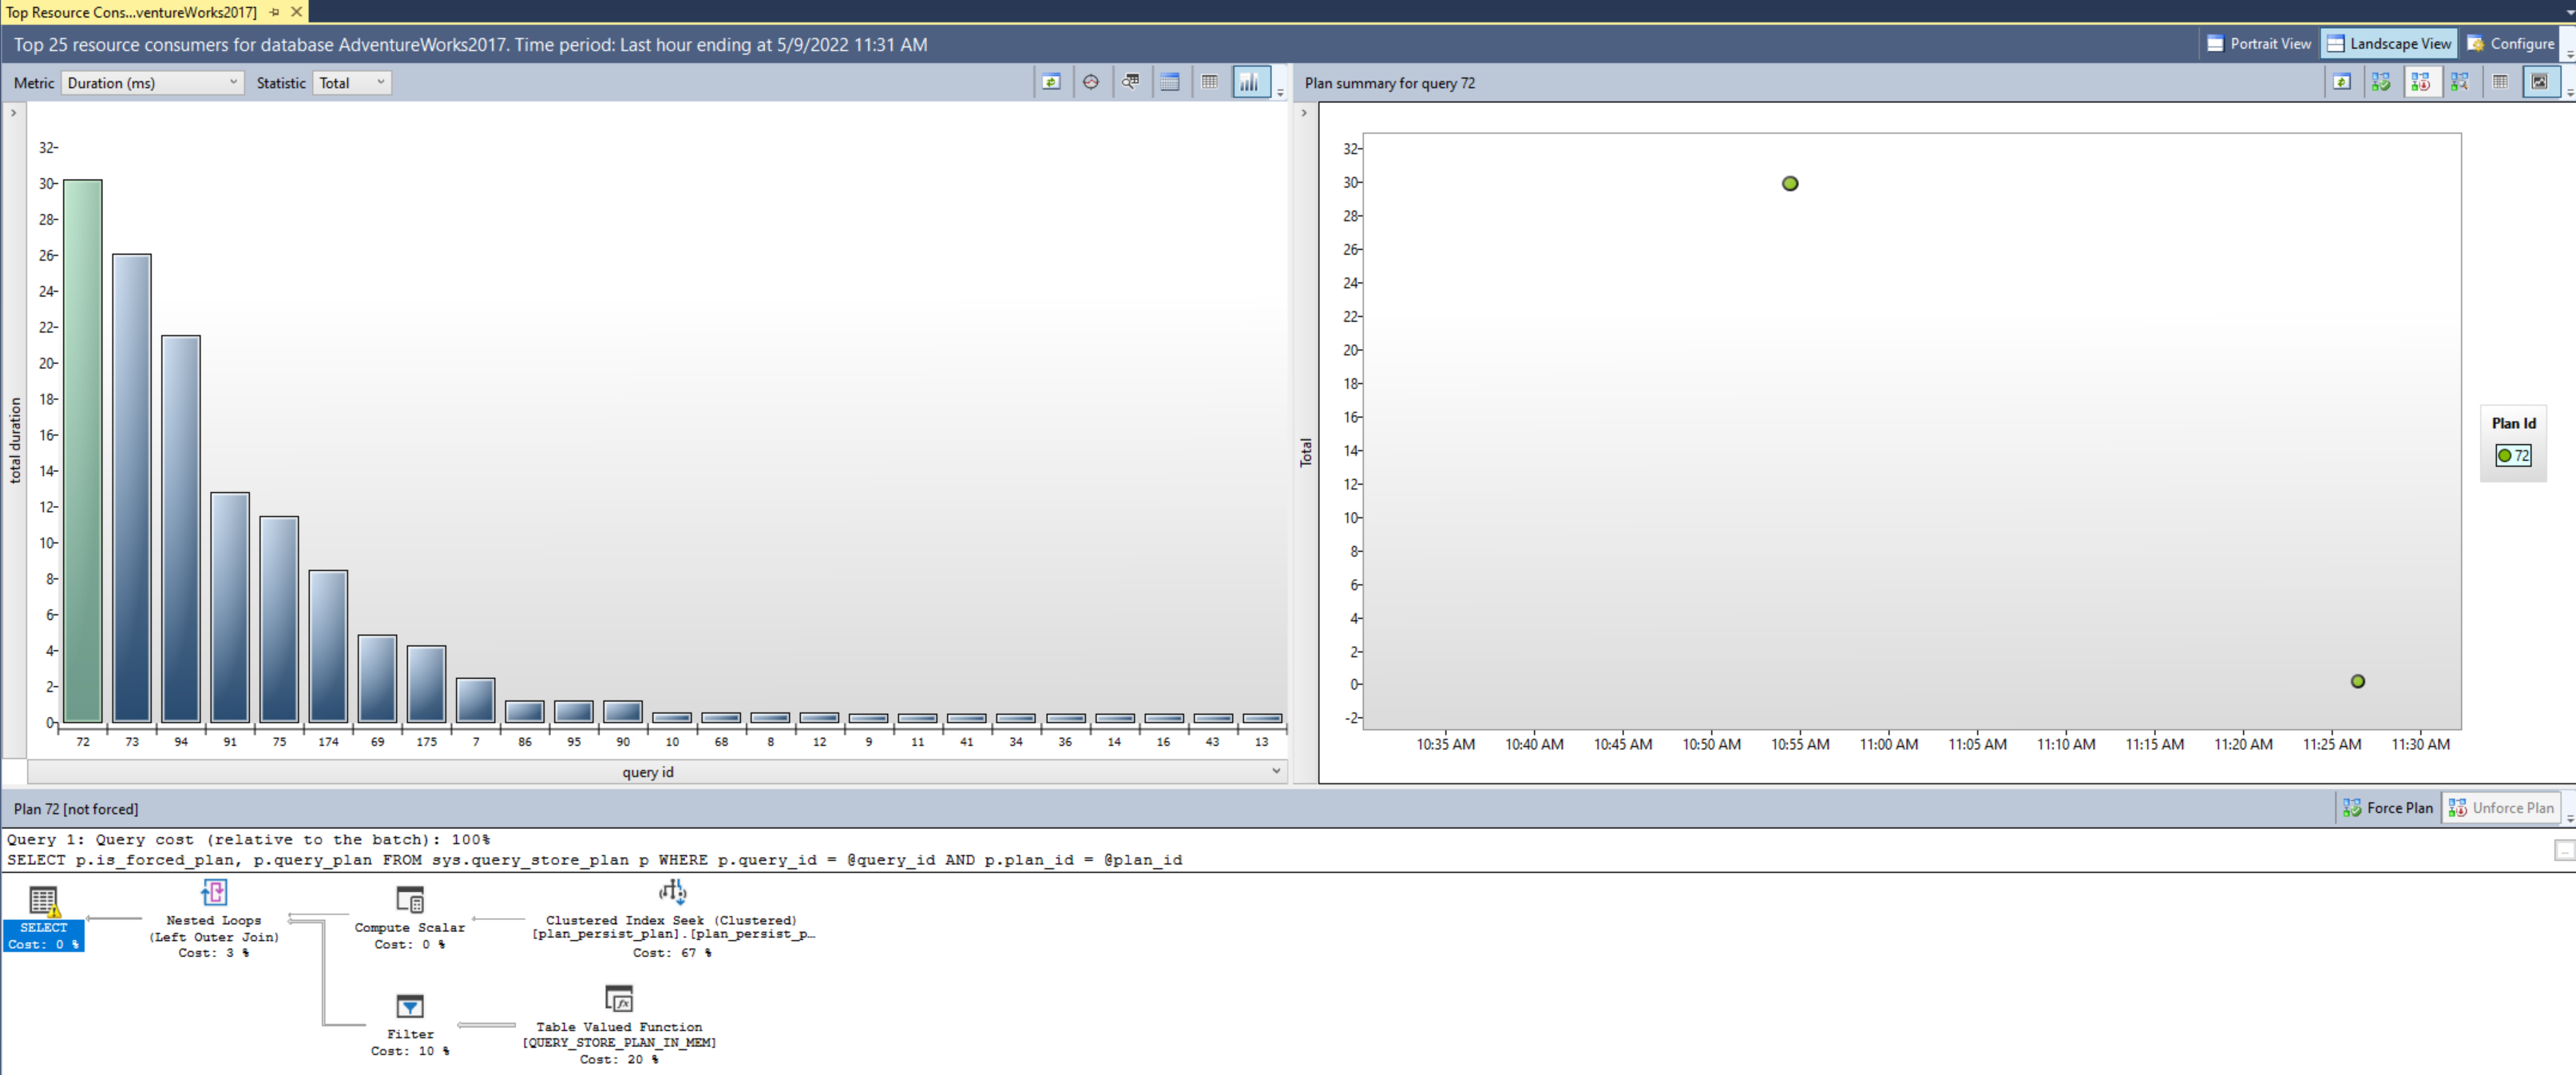
The Top Resource Consuming Queries view is similar to the details drill down of the Overall Resource Consumption view. It also allows for selecting a metric and a statistic as a filter. However, the queries it displays are the top 25 most impactful queries based on the chosen filter and timeframe.
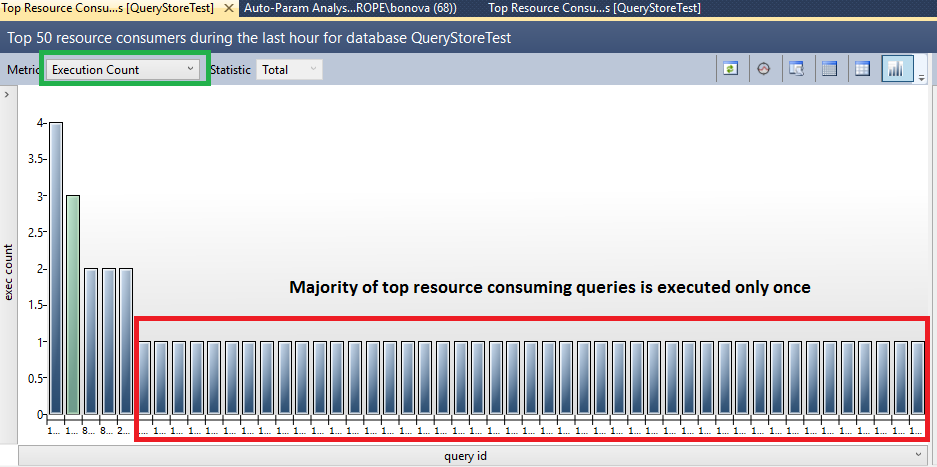
The Top Resource Consuming Queries view provides the first indication of the unplanned nature of the workload when identifying and improving unplanned workloads. For example, in the following image, the Execution Count metric and the Total statistic are selected to unveil that approximately 90% of the top resource-consuming queries are only executed once.
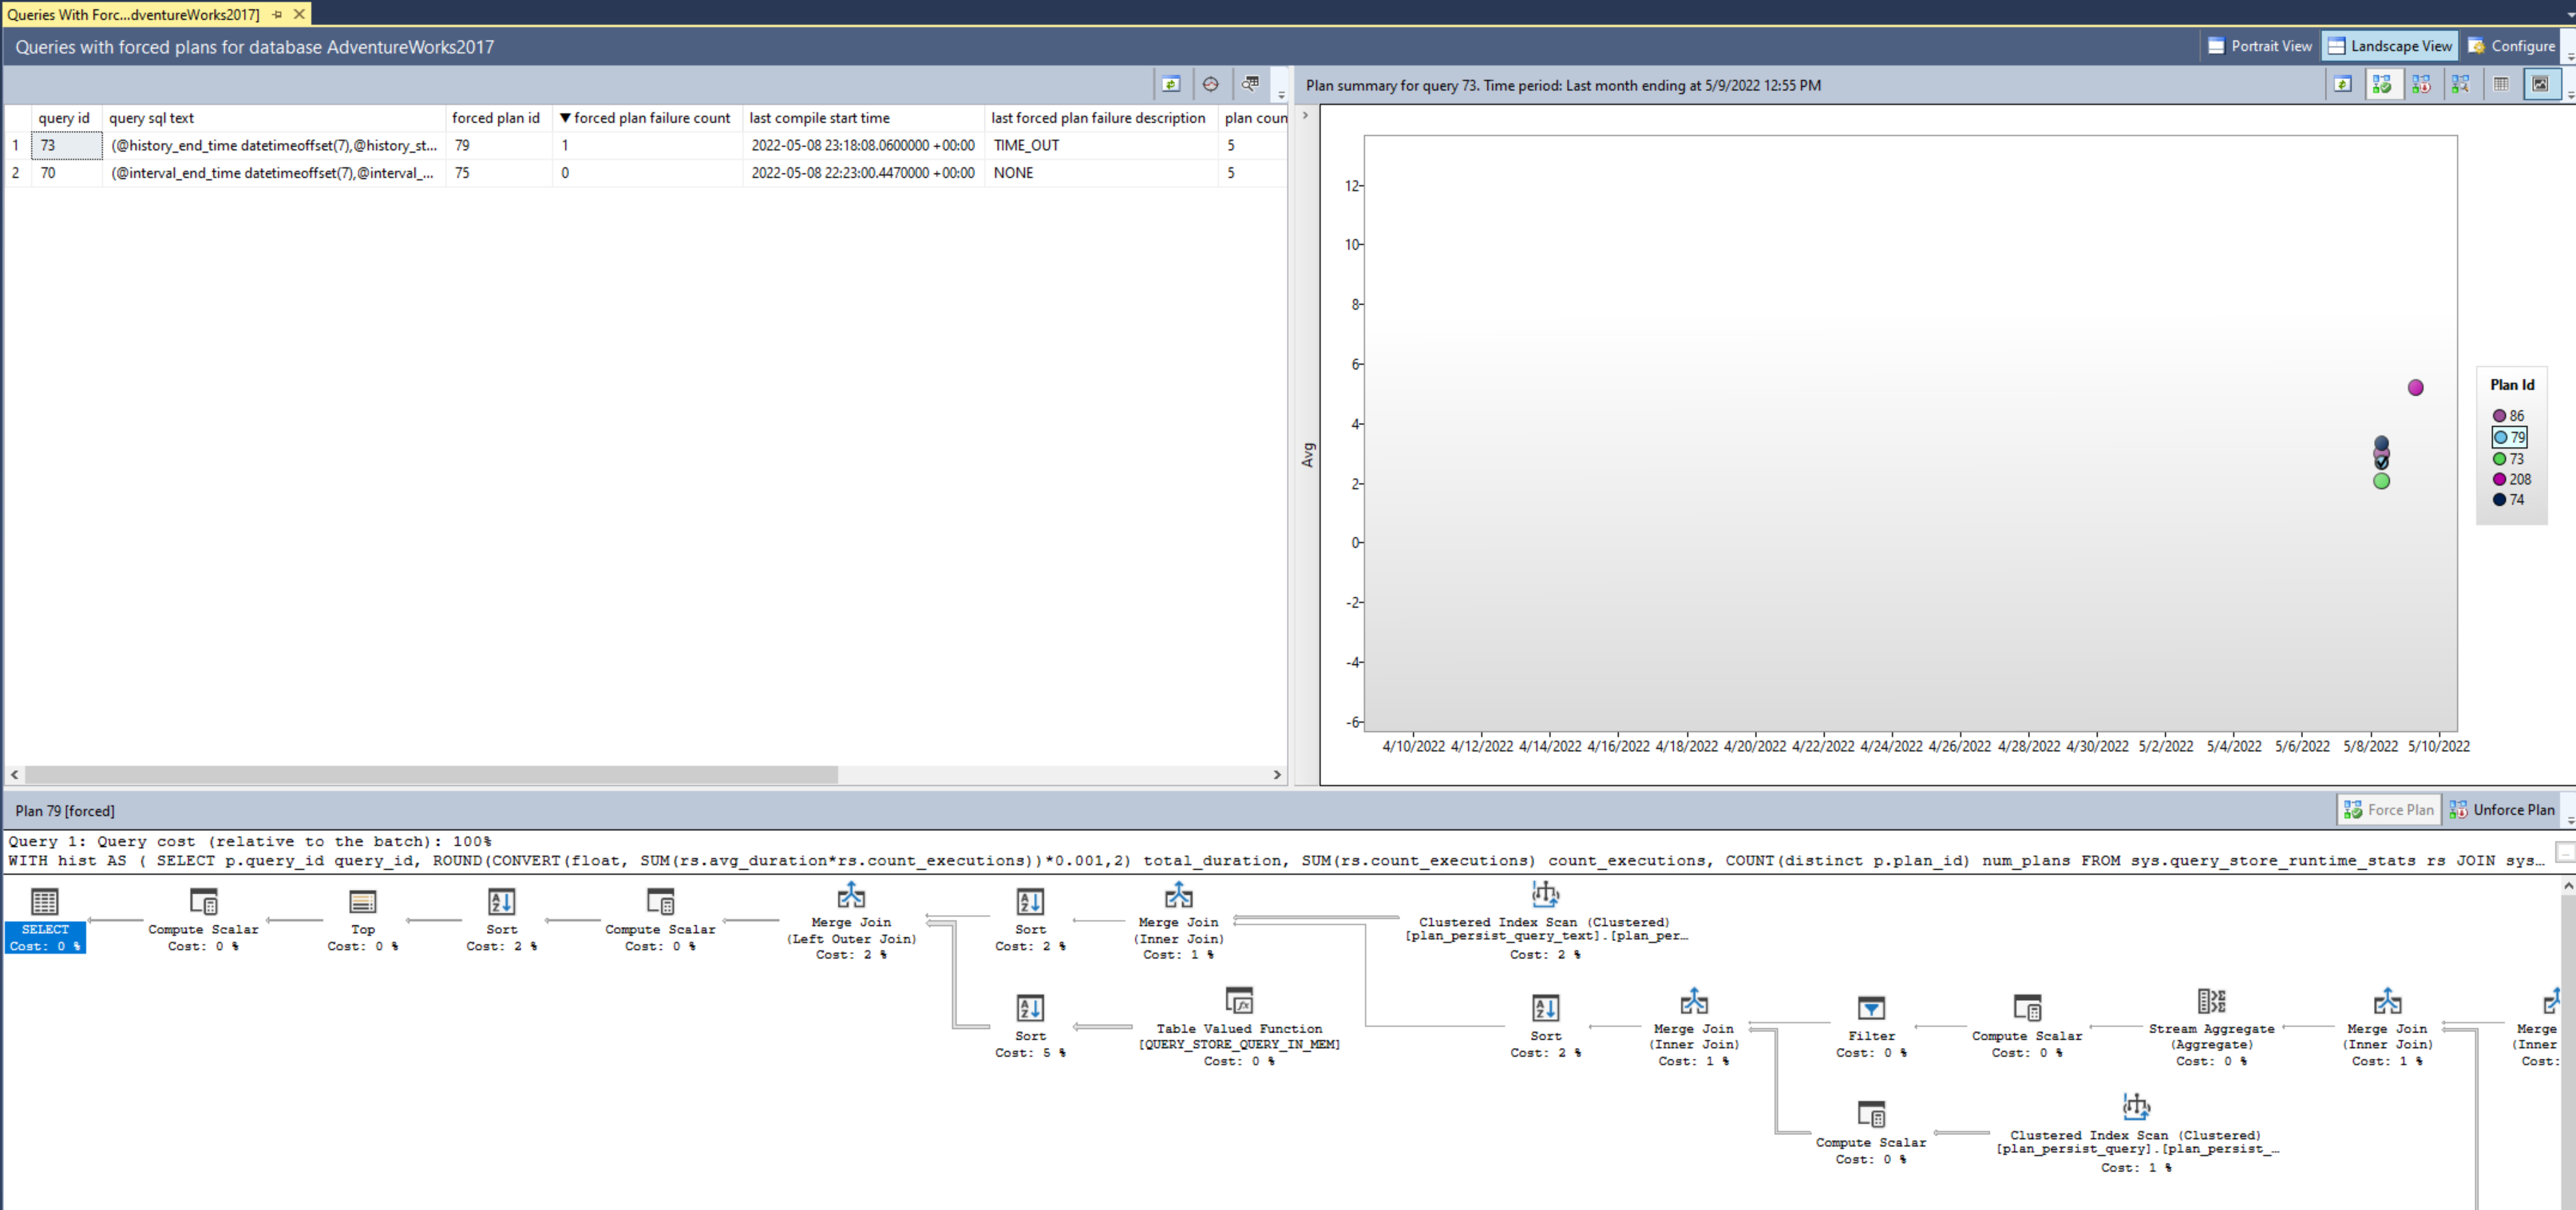
Queries With Forced Plans
The Queries With Forced Plans view provides a quick look into the queries that have forced query plans. This view becomes relevant if a forced plan no longer performs as expected and needs to be reevaluated. This view provides the ability to review all persisted estimated execution plans for a selected query easily determining if another plan is now better suited for performance. If so, toolbar buttons are available to unforce a plan as required.
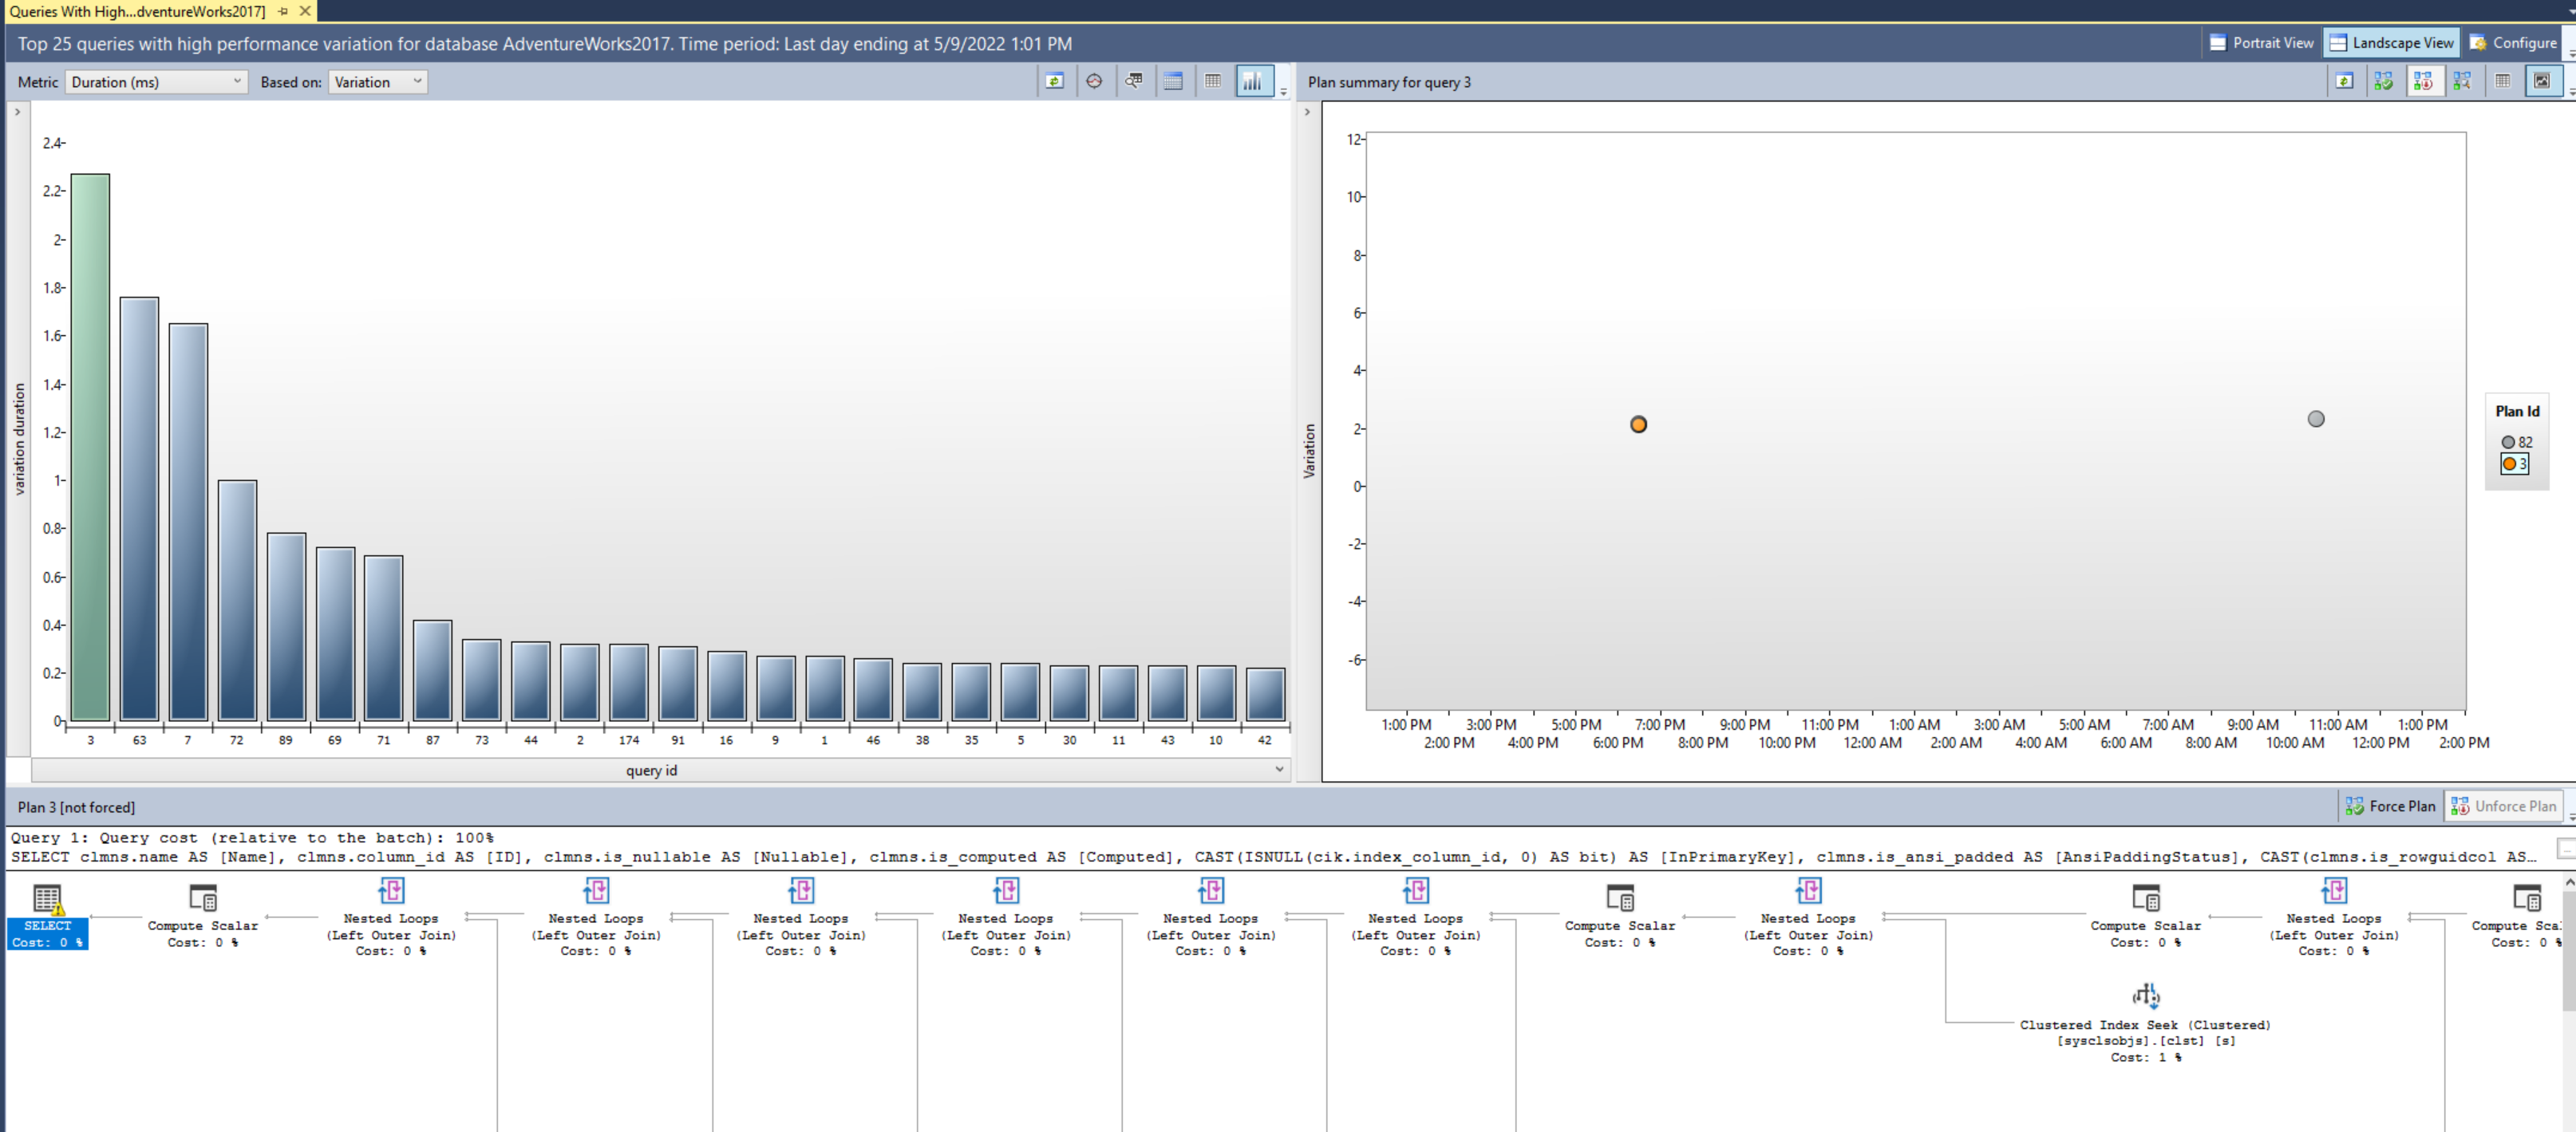
Queries With High Variation
Query performance can vary between executions. The Queries with High Variation view contains an analysis of queries that have the highest variation or standard deviation for a selected metric. The interface is consistent with most Query Store views allowing for query detail inspection, execution plan evaluation, and optionally forcing a specific plan. Use this view to tune unpredictable queries into a more consistent performance pattern.
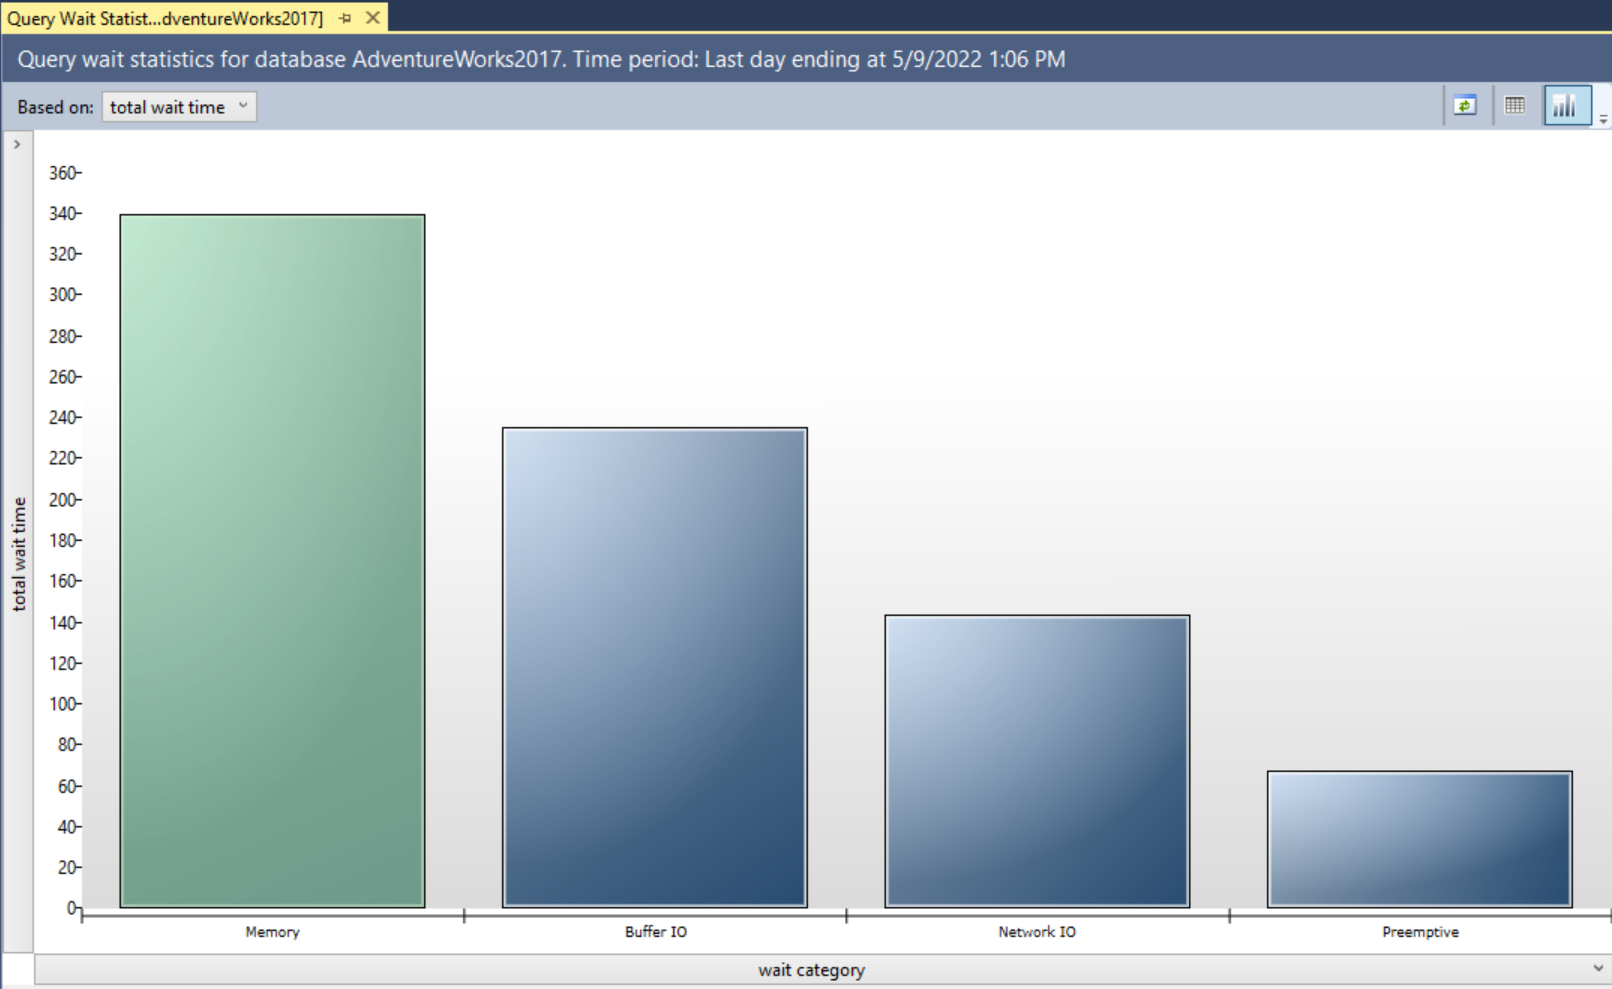
Query Wait Statistics
The Query Wait Statistics view analyzes the most active wait categories for the database and renders a chart. This chart is interactive; selecting a wait category drills into the details of the queries that contribute to the wait time statistic.
The details view interface is also consistent with most query store views allowing for query detail inspection, execution plan evaluation, and optionally forcing a specific plan. This view helps identify queries that are affecting user experience across applications.
Tracking Query
The Tracking Query view allows analyzing a specific query based on an entered query ID value. Once run, the view provides the complete execution history of the query. A checkmark on an execution indicates a forced plan was used. This view can provide insight into queries such as those with forced plans to verify that query performance is remaining stable.

Using the Query Store to find query waits
When the performance of a system begins to degrade, it makes sense to consult query wait statistics to potentially identify a cause. In addition to identifying queries that need to tune, it can also shed light on potential infrastructure upgrades that would be beneficial.
The SQL Query Store provides the Query Wait Statistics view to provide insight into the top wait categories for the database. Currently, there are 23 wait categories.
A bar chart displays the most impactful wait categories for the database when you open the Query Wait Statistics view. In addition, a filter located in the toolbar of the wait categories pane allows for the wait statistics to be calculated based on total wait time (default), average wait time, minimum wait time, maximum wait time, or standard deviation wait time.

Selecting a wait category drills through to the details of the queries that contribute to that wait category. From this view, you have the ability to investigate individual queries that are the most impactful. You can access the persisted estimated execution plans display in the Plan summary pane by selecting a query in the query pane. Selecting a query plan from the Plan summary pane displays the graphical query plan in the bottom pane. From this view, you have the ability to force or unforce a query plan for the query to improve performance.

Automatic plan correction
SQL Server 2017 and Azure SQL Database introduced the concept of automatic plan correction by analyzing data in the Query Store. When you enable the Query Store with a database in SQL Server 2017 (or later) and in Azure SQL Database, the SQL Server engine looks for query plan regressions and provides recommendations. You can see these recommendations in the sys.dm_db_tuning_recommendations dynamic management view (DMV). These recommendations include T-SQL statements to manually force a query plan when performance was in a good state.
If you gain confidence in these recommendations, you can enable SQL Server to force plans automatically when regressions are encountered. Enable automatic plan correction by using ALTER DATABASE and the AUTOMATIC_TUNING argument.
For Azure SQL Database, you can also enable automatic plan correction through automatic tuning options in the Azure portal or REST APIs. Automatic plan correction recommendations are always enabled for any database where Query Store is enabled (which is the default for Azure SQL Database and Azure SQL Managed Instance). For new databases, automatic plan correction (FORCE_PLAN) is enabled by default for Azure SQL Database.