Exercise - Introduce variables using the let statement
We've used a meteorological dataset to aggregate and visualize data. Here, you'll learn how to use let statements to introduce variables and organize complex queries.
let statements are useful for breaking up a complex expression into multiple parts, defining constants outside of the query body for readability, or defining a variable once and using it multiple times within a query. You can use let statements to create well-organized complex queries. You can use multiple let statements; each statement must be followed by a semicolon (;).
You can use let statements in different kinds of situations. On the simplest level, you can define scalar values that will later be referenced in a query, such as an int, string, date/time, or any other value. You can create a tabular filtered view of a table that will be used as the tabular input for the query. You can also create a function using a let statement.
Define a scalar with a let statement
Recall that previous queries filtered on locations or minimum damage. Let's define these boundary values using a let statement at the beginning of the query.
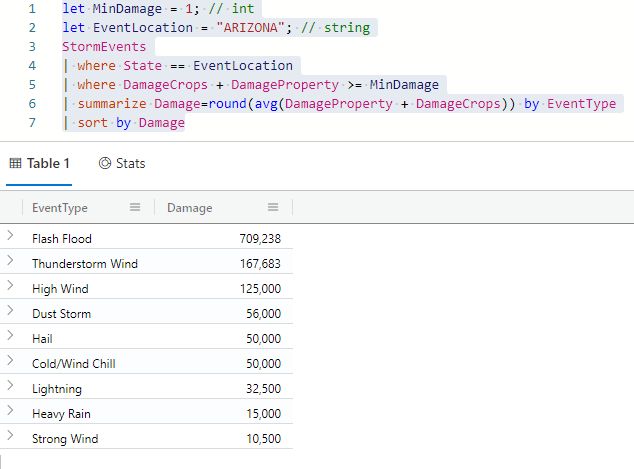
The following query uses two let statements to define scalar values that will later be used as input parameters in the query. The first defined value is a number and the second is a string. The let statements end with a semicolon.
Notice the commented-out portions of the query that begin with double forward slashes (//). Double forward slashes indicate a beginning of a comment until the end of the line. These are comments that are ignored when running queries.
Run the following query:
let MinDamage = 1; // int
let EventLocation = "ARIZONA"; // string
StormEvents
| where State == EventLocation
| where DamageCrops + DamageProperty >= MinDamage
| summarize Damage=round(avg(DamageProperty + DamageCrops)) by EventType
| sort by Damage
You should get results that look like the following image:
Try changing the state name or the minimum damage numbers and rerunning the query. How do the results change?
Convert a tabular result to a scalar value using toscalar within a let statement
Next, let's look at a count of the most frequent event type as a function of time. First, you need to figure out which is the most frequent event type. Then, you'll use this value in a query. Use the StormEvents table to find the top EventType by counting the number of events within each type. Use the project operator to return only the EventType column.
Before starting to construct the let statement, run the query to find out what this event actually is. This allows you to verify that your query is producing the expected results.
StormEvents
| summarize count() by EventType
| top 1 by count_
| project EventType
You should get results that look like the following image:
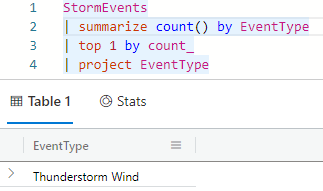
You'll notice that the query produced a tabular result with one column and one row. However, you'll want to convert this to a scalar value to use as a filter value in your main query. First, define the variable name we want to introduce as MostFrequentEventType. Next, you want to convert the tabular result to a scalar value by putting the whole query inside the toscalar() function.
The previous steps are summarized in the following let statement:
let MostFrequentEventType = toscalar(
    StormEvents
    | summarize count() by EventType
    | top 1 by count_
    | project EventType);
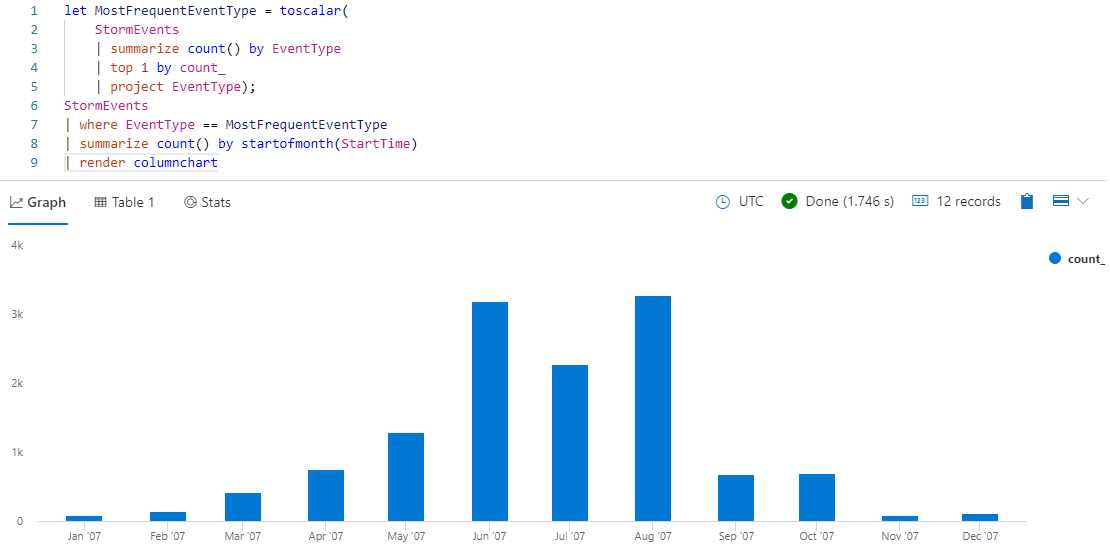
Notice that this statement by itself isn't a valid query, because a valid query must contain at least one statement that's not a let statement. You can, however, use this stored scalar value in a query. Recall that you want to look at a count of the most frequent event time as a function of time. You'll filter on MostFrequentEventType, then summarize the count by a certain time bin.
In this case, let's look at the results per month. You'll use the startofmonth() function, which returns a datetime representing the start of the month for the given date value. In this query, you'll use the StartTime column as the input for the startofmonth() function.
Finally, render the results as a column chart to get a histogram of the count of the most frequent event type binned by month.
Run the following query:
let MostFrequentEventType = toscalar(
    StormEvents
    | summarize count() by EventType
    | top 1 by count_
    | project EventType);
StormEvents
| where EventType == MostFrequentEventType
| summarize count() by startofmonth(StartTime)
| render columnchart
You should get results that look like the following image:
Try changing the query to show a histogram of the least frequent event type binned by month and rerunning the query.

Construct a let statement with tabular output
The previous examples created a stored scalar value to be used as an input parameter in a query. However, it's also possible to use a let statement to create tabular data that's then used as the input to a query.
Filter the StormEvents table on events that indirectly or directly caused deaths. Then, return a subset of the columns using the
projectoperator. This statement gives a tabular output called KillerStorms. Use thisletstatement as the beginning input for your query.let KillerStorms = StormEvents | where DeathsDirect + DeathsIndirect > 0 | project State, EventType, Deaths=DeathsDirect + DeathsIndirect;Then, you can use some of the aggregation functions you've learned in previous units. Run the following query:
let KillerStorms = StormEvents | where DeathsDirect + DeathsIndirect > 0 | project State, EventType, Deaths=DeathsDirect + DeathsIndirect; KillerStorms | summarize DistinctKillerEventTypes=dcount(EventType), TotalDeaths=sum(Deaths) by State | sort by TotalDeathsYou should get results that look like the following image:
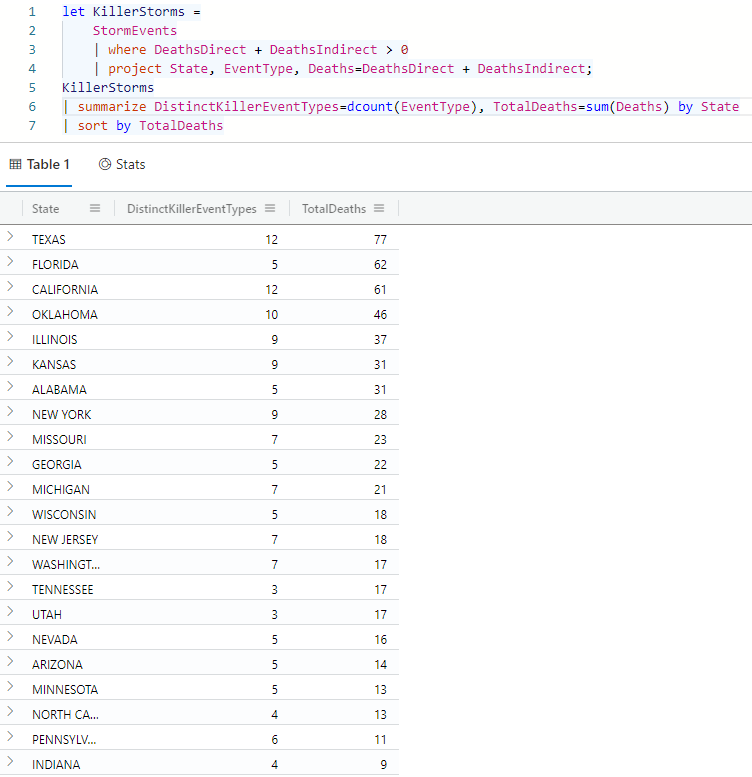
Look at the results. Are all events summarized in the DistinctKillerEventTypes column so-called "killer storms?"
Create a user-defined function with the let statement
You can also use let statements to define user-defined functions, which are reusable subqueries. Suppose you want to figure out what percent of each event type caused damage. You'll create a user-defined function that calculates percentages, and later call this function and specify which columns are to be used to calculate percentage.
Within a let statement, you'll declare function name, arguments, and body using the following general syntax:
let function=(argument1:datatype, argument2:datatype) {functionbody};
Specifically, you'll use a user-defined function to calculate percentages. First, define the data type and input arguments. For this example, you'll use the following arguments:
| Argument name | Data type | Description |
|---|---|---|
| portion | real |
The portion of the total events that you want to calculate the percentage of. |
| total | real |
The total number of events. |
You'll round the answer to two decimal places using the round() function.
Taken altogether, the user-defined function described by the let statement is:
let Pcent = (portion:real, total:real){round(100 * portion / total, 2)};
Use this
letstatement in the following query:let Pcent = (portion: real, total: real) { round(100 * portion / total, 2) }; StormEvents | extend Damage = DamageCrops + DamageProperty | summarize TotalEvents = count(), TotalDamagingEvents = countif(Damage > 0) by EventType | project EventType, TotalDamagingEvents, TotalEvents, Percentage = Pcent(TotalDamagingEvents, TotalEvents) | sort by EventType ascYou should get results that look like the following image:
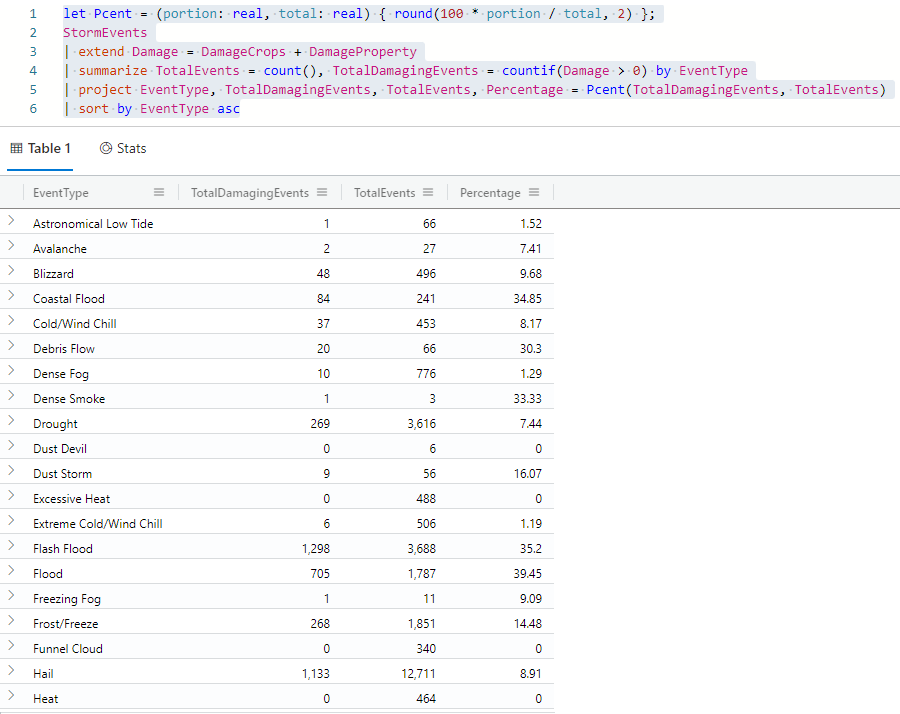
Take a moment to understand the results. Try modifying the query to show a breakdown of the percentage by damage type and rerunning the query.
Take a look at the results. What does the percentage mean? Notice that the query calls the Pcent function, which we defined in the let statement. The inputs used in this function are TotalDamagingEvents and TotalEvents, meaning you're looking for the percent of events that caused damage.