Install and use the add-in to create and manage your business plans from Excel
The Microsoft Excel add-in for Business performance planning is a tool that helps you create and manage budgets, forecasts, and scenarios for your business. You can use the add-in to:
- Connect your data that's imported in the Business performance planning application.
- Create and modify budget and forecast data directly from an Excel PivotTable.
- Create and compare different scenarios and what-if analyses to evaluate the impact of changes on your business performance.
- Visualize and communicate your results by using charts, dashboards, and reports.
Prerequisites
Before you can work with the Excel add-in, make sure that you have the following prerequisites in place:
- The Business performance planning app is installed. For more information, see Install business performance planning.
- The dimensions and cubes are created. For more information, see Business performance planning dimensions and Business performance planning cubes.
- The supported web browser is Microsoft Edge.
Note
Updates for add-ins don't happen automatically. Select the Install add-in tile on the home page to get the latest update.
Follow these steps to install the add-in:
- Sign in to the Business performance planning app.
- On the home page, on the Plan in Excel tile, select Install add-in.
- Accept the terms and conditions.
- Select Download to open the add-in installer.
- When the app downloads, select Install.
Configure and use the Excel add-in for Business performance planning
To configure and use the Excel add-in, complete these tasks:
- Prepare your Excel file.
- Connect to Microsoft Dataverse and then load your data model into your Excel file.
- Create a PivotTable that's based on your data model.
- Begin planning in Excel.
Prepare your Excel file
To prepare an Excel file to use the add-in, follow these steps:
- Confirm that the Excel add-in is installed.
- In Business performance planning, go to the cube of your choice.
- Select Plan in Excel to download the Excel file that sets the context for the cube.
- Open the file and select Enable editing. A Planning tab displays on the Excel ribbon.
Connect to Dataverse and load your data model
To connect to Dataverse and load a data model, follow these steps:
On the Excel ribbon, on the Data tab, select Get data.
Select From database and then select SQL server database.
In the Environment URL field, enter your server. You can find this information in the Details section in the Microsoft Power Platform environment or in the URL of your Business performance planning application (for example, XXXX.crmXX.dynamics.com).
Select OK.
Enter the same credentials that you use to sign in to the Business performance planning app and then select Connect. After the connection is made, a Navigator window shows all Dataverse tables in the environment.
Select the Select multiple items checkbox.
Search for and select your cube name.
Select the Select related tables option for the system to automatically select all dimensions that are related to your cube.
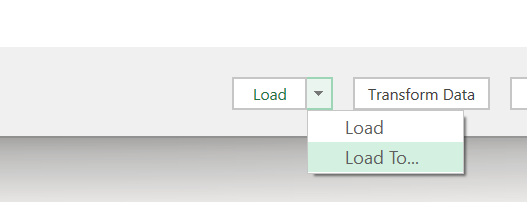
Select the arrow next to Load and then select Load To.
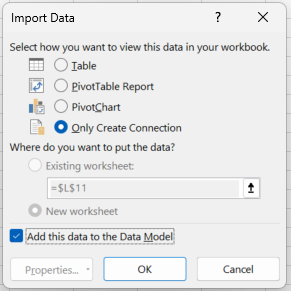
Select Only Create Connection on the Import Data page and then select the Add this data to the Data Model option to avoid the data being stored in an Excel sheet and to help improve the performance.
Your data model should now load, and the system should bring data from Dataverse into your Excel workbook. The data load might take some time, depending on the volume of data in Dataverse.
We recommend that you save your workbook at this point.


Create a PivotTable based on your data model
To create a PivotTable that's based on a data model, follow these steps:
On the Excel ribbon, on the Insert tab, select Pivot table from data model. Your cube and dimension tables should appear.
Configure the PivotTable by bringing fact data, amounts, or values from your cube into the Values section.
Bring in dimensions that describe the fact data as rows, columns, and filters of your PivotTable. Examples of these dimensions include cost centers, scenarios, regions, or years.
Auto detect relationships between cube and dimension tables.
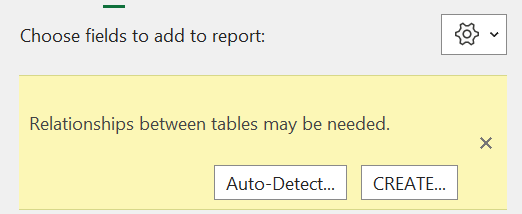
A message in the upper part of the PivotTable pane notifies you that no relationships exist between the tables. It prompts you to auto detect the relationships or manually create them. Confirm that auto detect relationships can accurately set up the relationships. The relationships are based on the primary key (ID field) in dimension tables.
Occasionally, you might need to manually create the relationships by selecting Create and selecting the table and column between which you want to create the relationship.
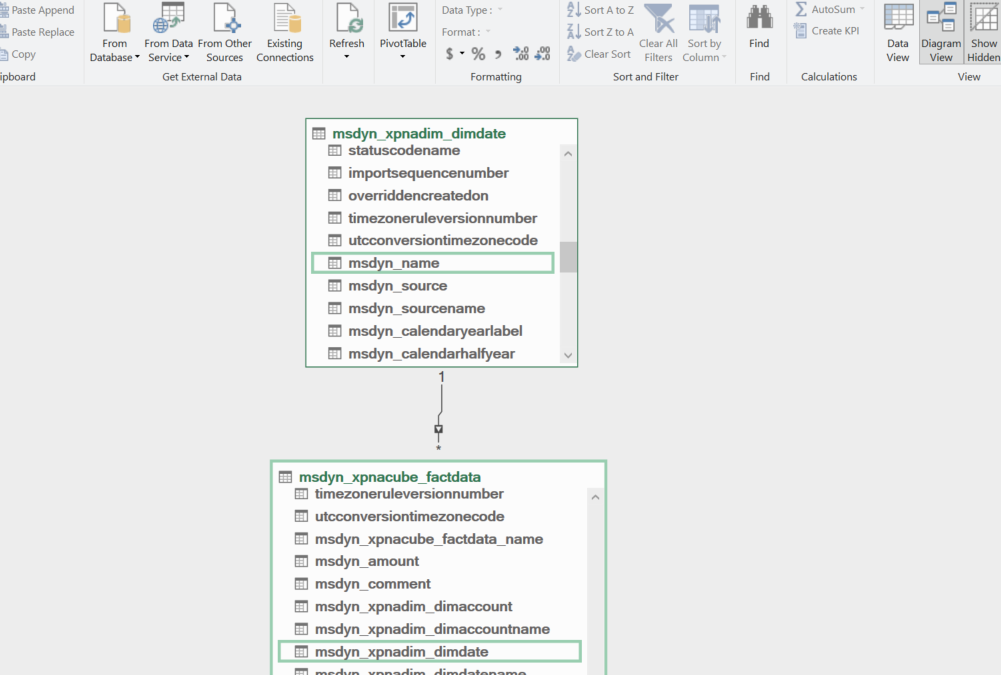
Alternatively, open a Power Pivot window by selecting Power Pivot > Manage from the Data Model section. In the new window, select Diagram View. All tables that you imported should display in your data model.
Then, you can select and link the two columns that you want to create a relationship with.


For more information, see Business performance planning dimensions and Power Pivot - Overview and Learning.
Begin planning
To begin planning by using a cube, follow these steps:
- On the Excel ribbon, select the Planning tab if it isn't already selected.
- If you're in Viewing mode, switch to Editing mode. The system should prompt you to authenticate.
- Based on your permissions and access, you can modify values in the PivotTable and then use the Save option to save your changes back to Dataverse.
- Optional - You should be able to modify the values at the top level (parent level) and/or the bottom level (child level) and then apply allocations proportionately.
- Optional - You can save the workbook locally and then share it with coworkers to allow collaborative planning. Your coworkers must authenticate by using their credentials. They must also update the data from the Data tab of the Excel ribbon.
- Optional - You can add comments to the cells that you're modifying the values for. These comments are workbook-specific and aren't stored on Dataverse. The system doesn't retain them if you download or create a new workbook from the Business performance planning app.
To begin planning by using dimensions, follow these steps:
- On the Excel ribbon, on the Planning tab, select Edit dimension. A list of all dimensions that you can view and edit appears.
- Select a dimension to open its contents on another worksheet.
- Based on your permissions and access, you can modify the values, modify entire rows, add new rows, and delete rows. Then, you can save your changes back to Dataverse.
- Optional - You can add comments to the cells that you're modifying the values for. These comments are workbook-specific and aren't stored in Dataverse. The system doesn't retain them if you download or create a new workbook from the Business performance planning app.