Prepare data for analysis and reporting
A semantic model defines the relationships between the different tables in the semantic model, the rules for how data is aggregated and summarized, and the calculations or measures that are used to derive insights from the data. These relationships and measures are included in the semantic model, which is then used to create reports in Power BI.
You can easily switch between the Data, Query, and Model view Fabric using the menu in the bottom left corner of the screen. The Data view shows the tables in the semantic model, the Query view shows the SQL queries that are used to create the semantic model, and the Model view shows the semantic model.
Tip
See Analyze data in a relational data warehouse to learn more about data models and data warehouse schema.
Build relationships
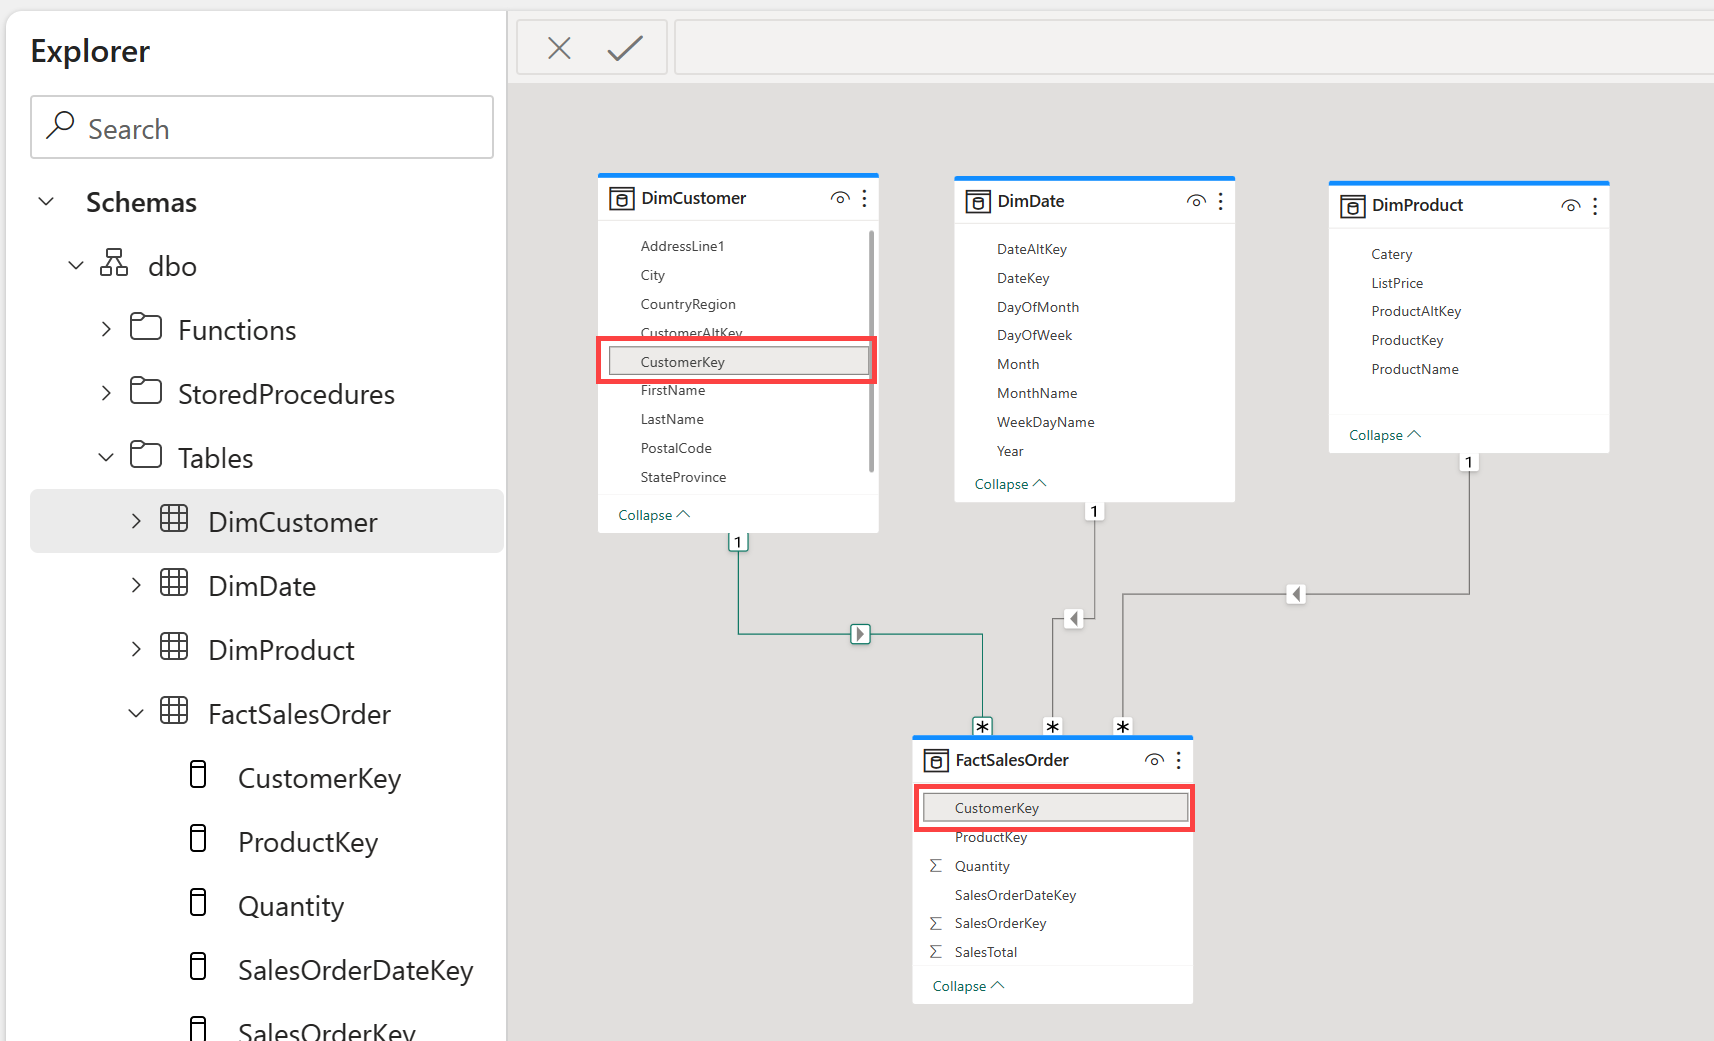
Relationships allow you to connect tables in the semantic model. Create relationships between tables in your data warehouse using a click-and-drag interface in Fabric in the Model view.

Tip
See Create and manage relationships for detailed information on creating relationships.
Create measures
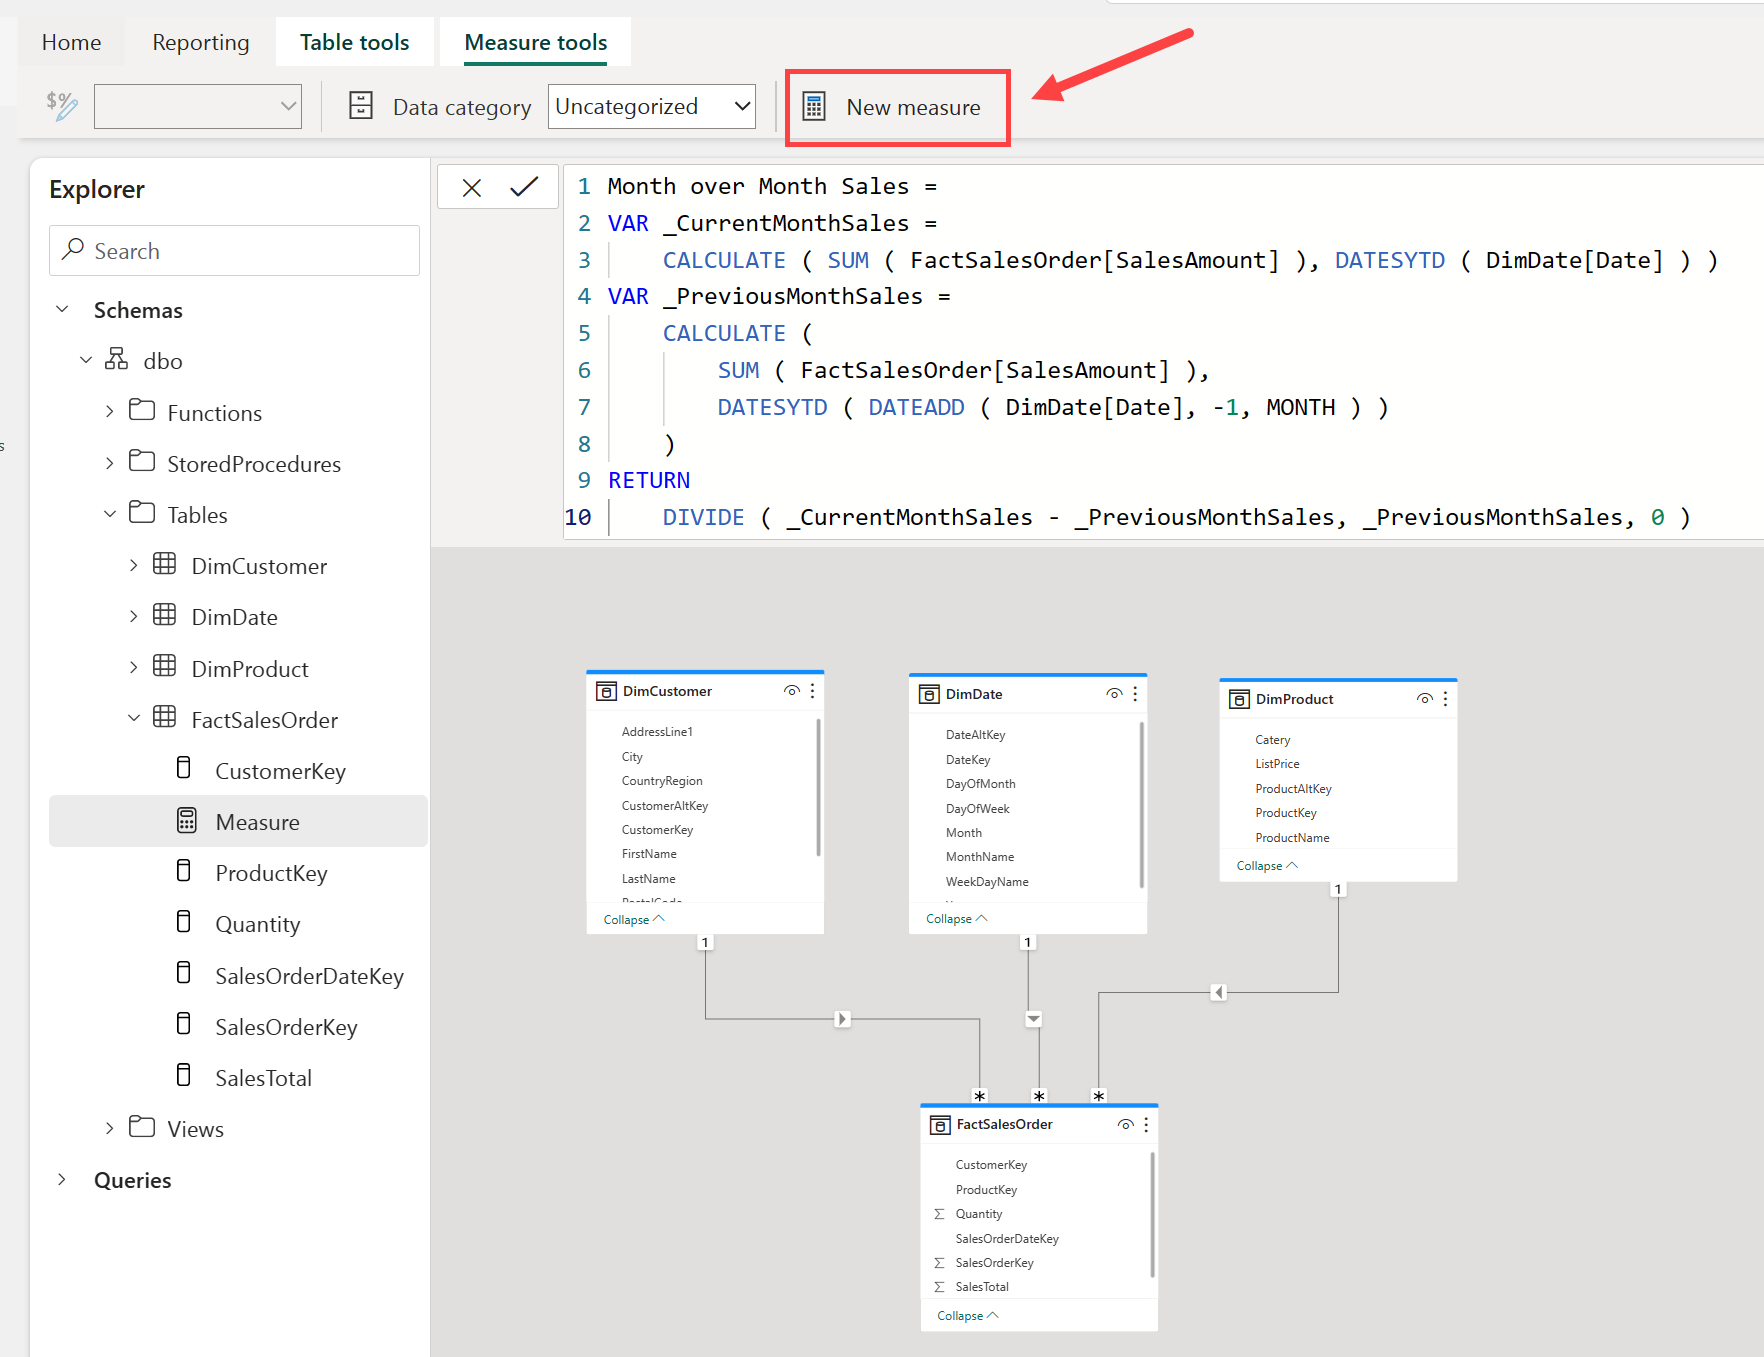
Measures are the metrics that you want to analyze in your data warehouse. You can create measures in Fabric by using the New measure button in the Model view.

Measures are calculated fields that are based on the data in the tables in your data warehouse using the Data Analysis Expressions (DAX) formula language.
Note
Fabric offers many tools to create data transformations. The creation of measures using DAX is one of many ways to create data transformations. To learn more about DAX, see Use DAX in Power BI.
Hide fields
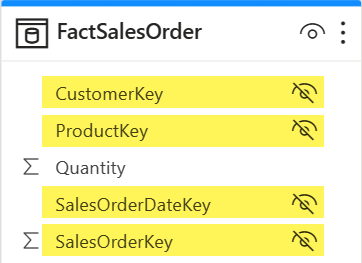
Building out the semantic model is a critical component to preparing your data for use in downstream reporting. To simplify things for your report builders, you can hide elements from view, either a table or a column. Right-click on the table or column and select Hide. Hiding fields removes the table or column from the model view, but it will still be available for use in the semantic model.

Understand semantic models
Every time a data warehouse is created, Fabric creates a semantic model for analysts and/or business users to connect to for reporting.
Semantic model has metrics that are used to create reports. Simply put, analysts use the semantic model you created in your warehouse, which is stored in a semantic model. If you're familiar with Power BI, working with semantic models created by the data warehouse experience will be straightforward.
Semantic models are automatically kept in sync with the data warehouse, so you don't have to worry about maintaining them. You can also create custom semantic models to meet your specific needs.
Understand the default semantic model
There's also a default semantic model automatically created for you in Fabric. It inherits business logic from the parent lakehouse or warehouse, which initiates the downstream analytics experience for business intelligence and analysis. This semantic model is managed, optimized, and kept in sync for you.
New tables in the Lakehouse are automatically added to the default semantic model. Users can also manually select tables or views from the warehouse they want included in the model for more flexibility. Objects that are in the default semantic model are created as a layout in the model view.
Note
Default semantic models follow the current limitations for semantic models in Power BI. See Default Power BI semantic models for more information.
Visualize data
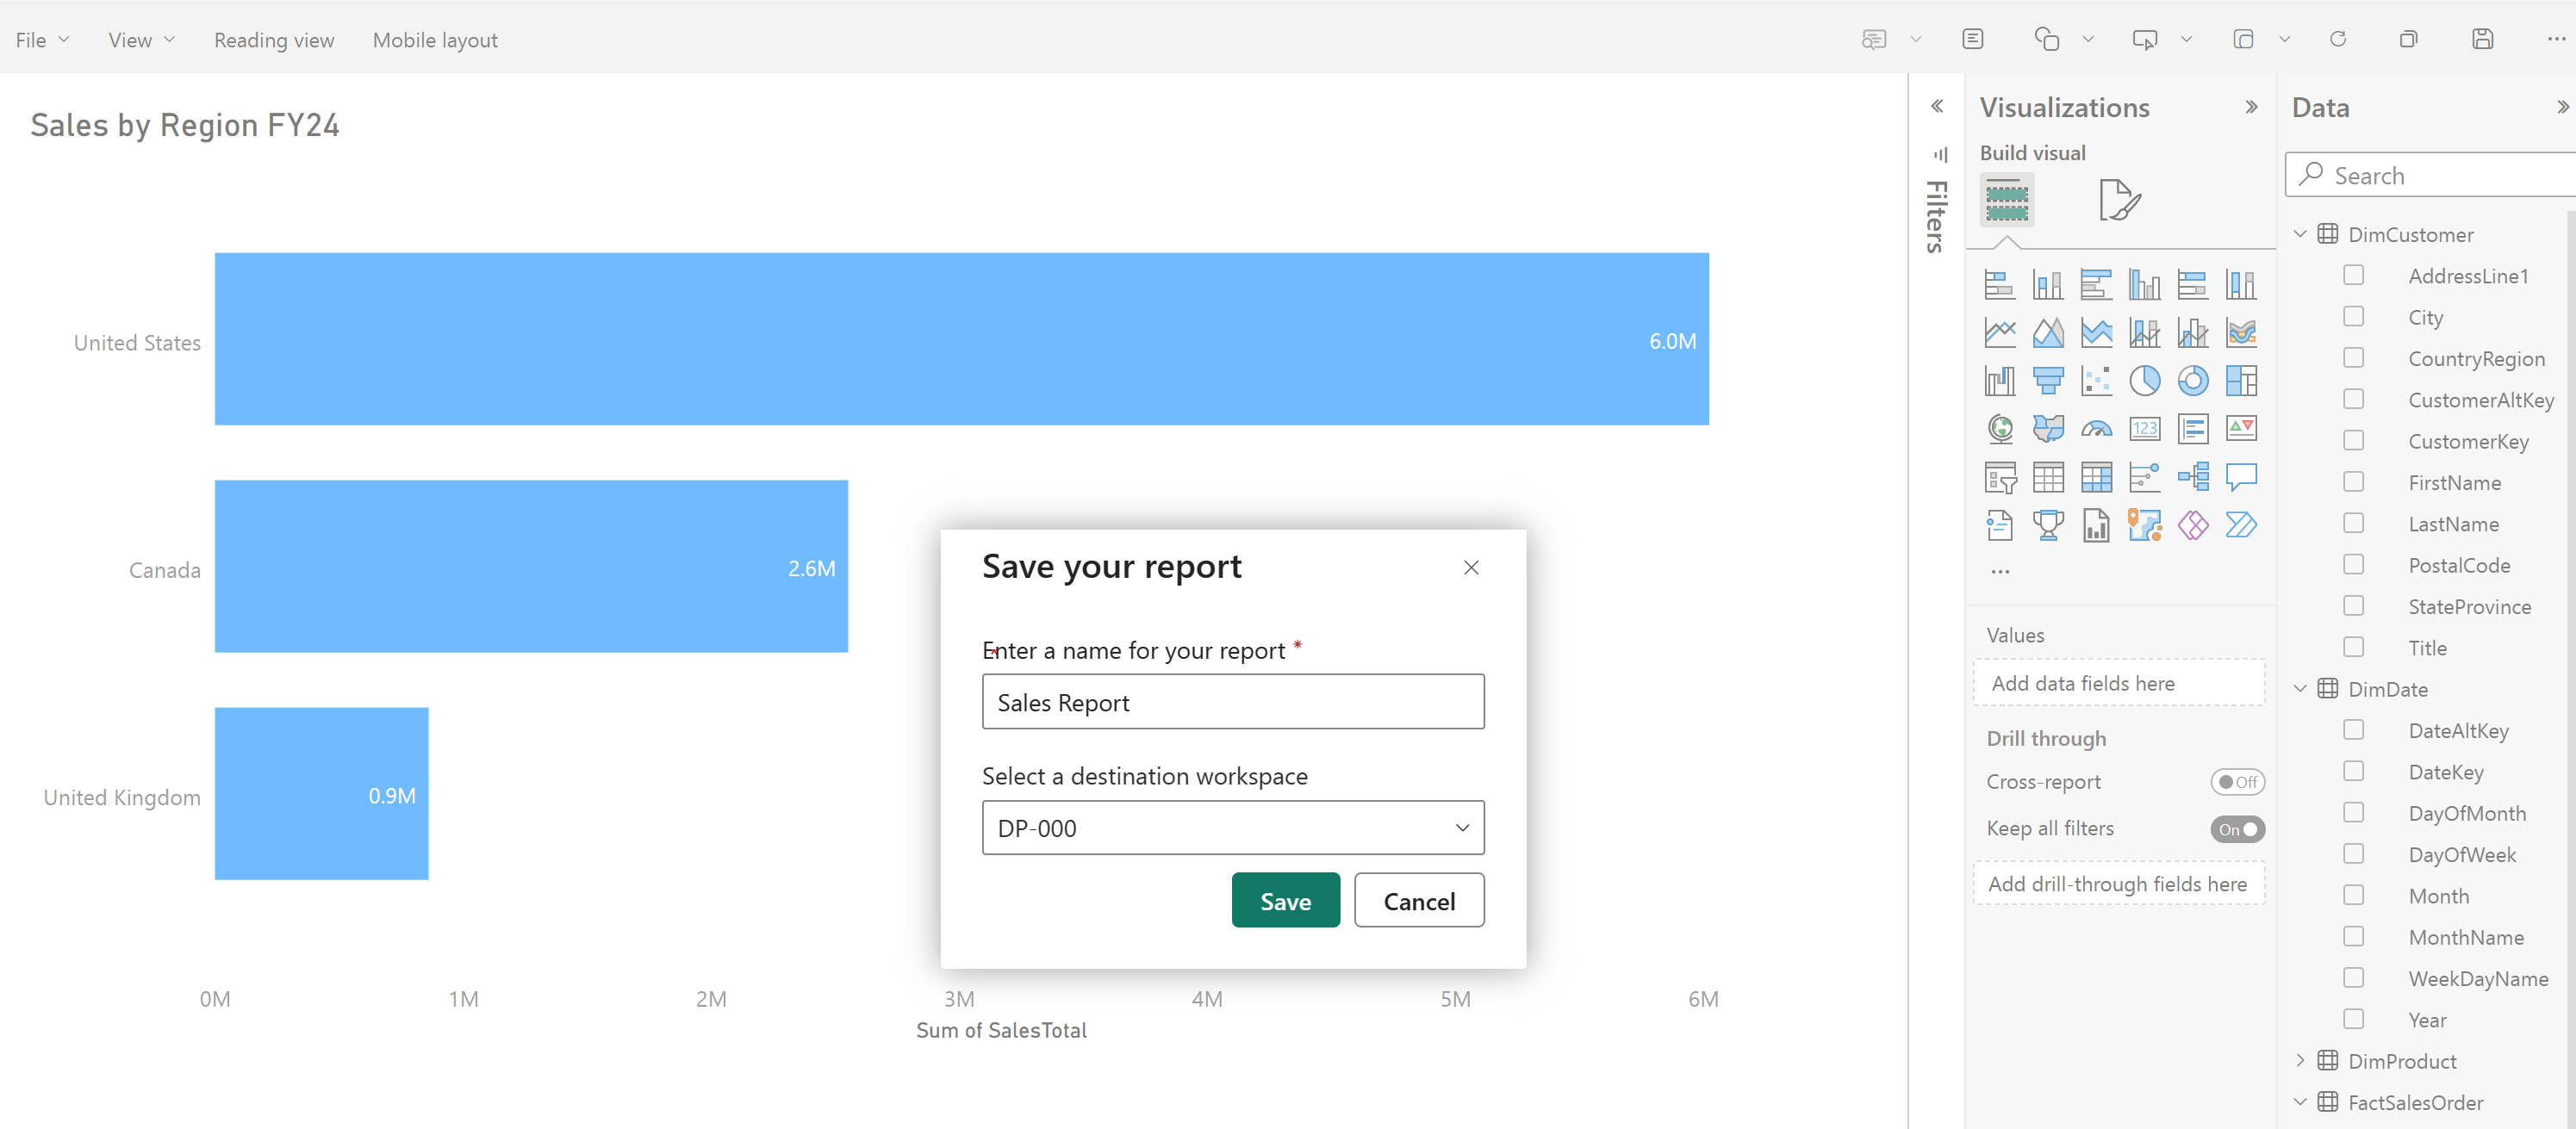
Fabric enables you to visualize the results of a single query or your entire data warehouse, without leaving the data warehouse experience. Exploring data while you work to ensure you have all the necessary data and transformations for your analysis is particularly useful.
Use the New report button to create a new Power BI report from the contents of your entire data warehouse. Using the New report button opens the Power BI service experience where you can build and save your report for use by the business.
