Exercise - Create a model-driven app
In the exercise from the previous module of this learning path, you created the Prospects table in Microsoft Dataverse and imported the existing leads.
Scenario
In this exercise, you'll use the Prospects table data to create a model-driven app.
If you don't have the Prospects table, then refer to this previous exercise. Our new app will help keep managers up to date on current sales leads and forecasted revenue.
Create the model-driven app for the Prospects table
You need the Prospects table from the previous exercise to build the model-driven app in this exercise.
Sign in to Power Apps using your organizational account.
Select the environment where you want the app to reside, or go to the Power Apps admin center to create a new one.
On the Home page, select the Start with a page design and then Blank page with navigation .

Enter the following name and select Create.
Name:
Prospect EntrySelect + Add page.
Select Dataverse table.
Find your Prospects table by scrolling through the list (or by entering
Prospectin the search field).Select Prospects and then Add. After a few moments, your new app will appear in the app editor screen.
Select Publish to save and publish your changes.
Create a chart
Inside of your app, select the Data tab from the left-side navigation ribbon.
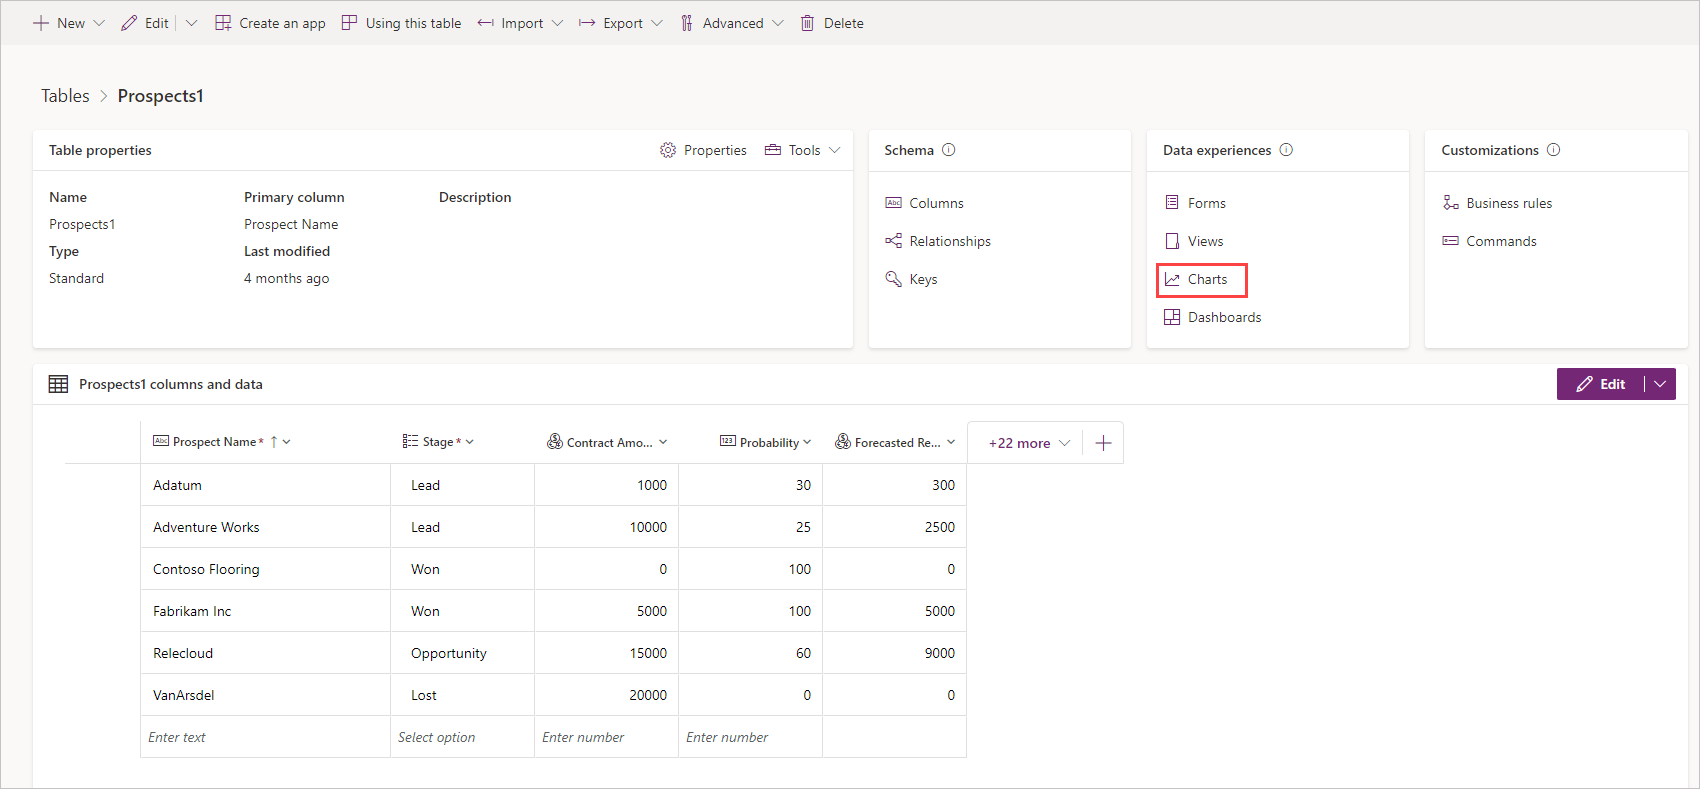
Select and expand In your app, and then find/select your Prospects table. Select the ellipses to the right of the table name, and select the Open option. Your table editor will open in a new browser tab.

Select Charts under Data experiences.
Select New chart from the header ribbon. The Chart:New editor appears as a new tab in your browser. The following screenshot helps you navigate through the next four steps.
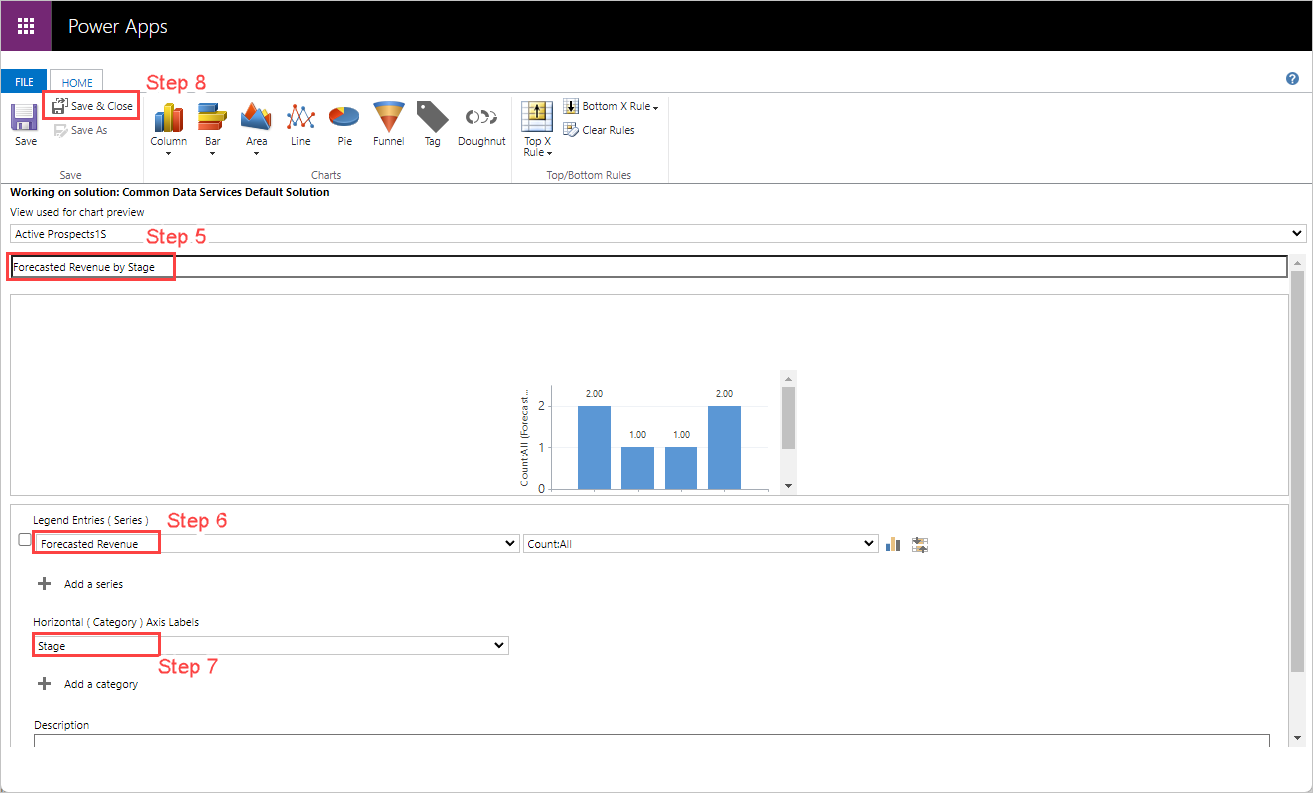
For the Chart Name, enter
Forecasted Revenue by Stage.For Legend Entries (Series), check the box to the left of this item, and select the Forecasted Revenue column. In the dropdown to the right, several different aggregates are available to display including Avg, Sum, Min, Max, Count:All, and Count:Non-empty.
For Horizontal (Category) Axis Labels, select the Stage column. After a few moments, a sample graph will appear below the chart name that you entered above. Now, you can select different aggregates from the dropdown to see what different selections look like. In our example we're showing the Count:All aggregate.
Select Save and Close. The chart editor closes and returns you to your Charts table. A pop-up asks if you're Currently creating a new chart; select Done. After a few moments, your Charts table will reflect your new chart. (You might need to refresh your browser.)
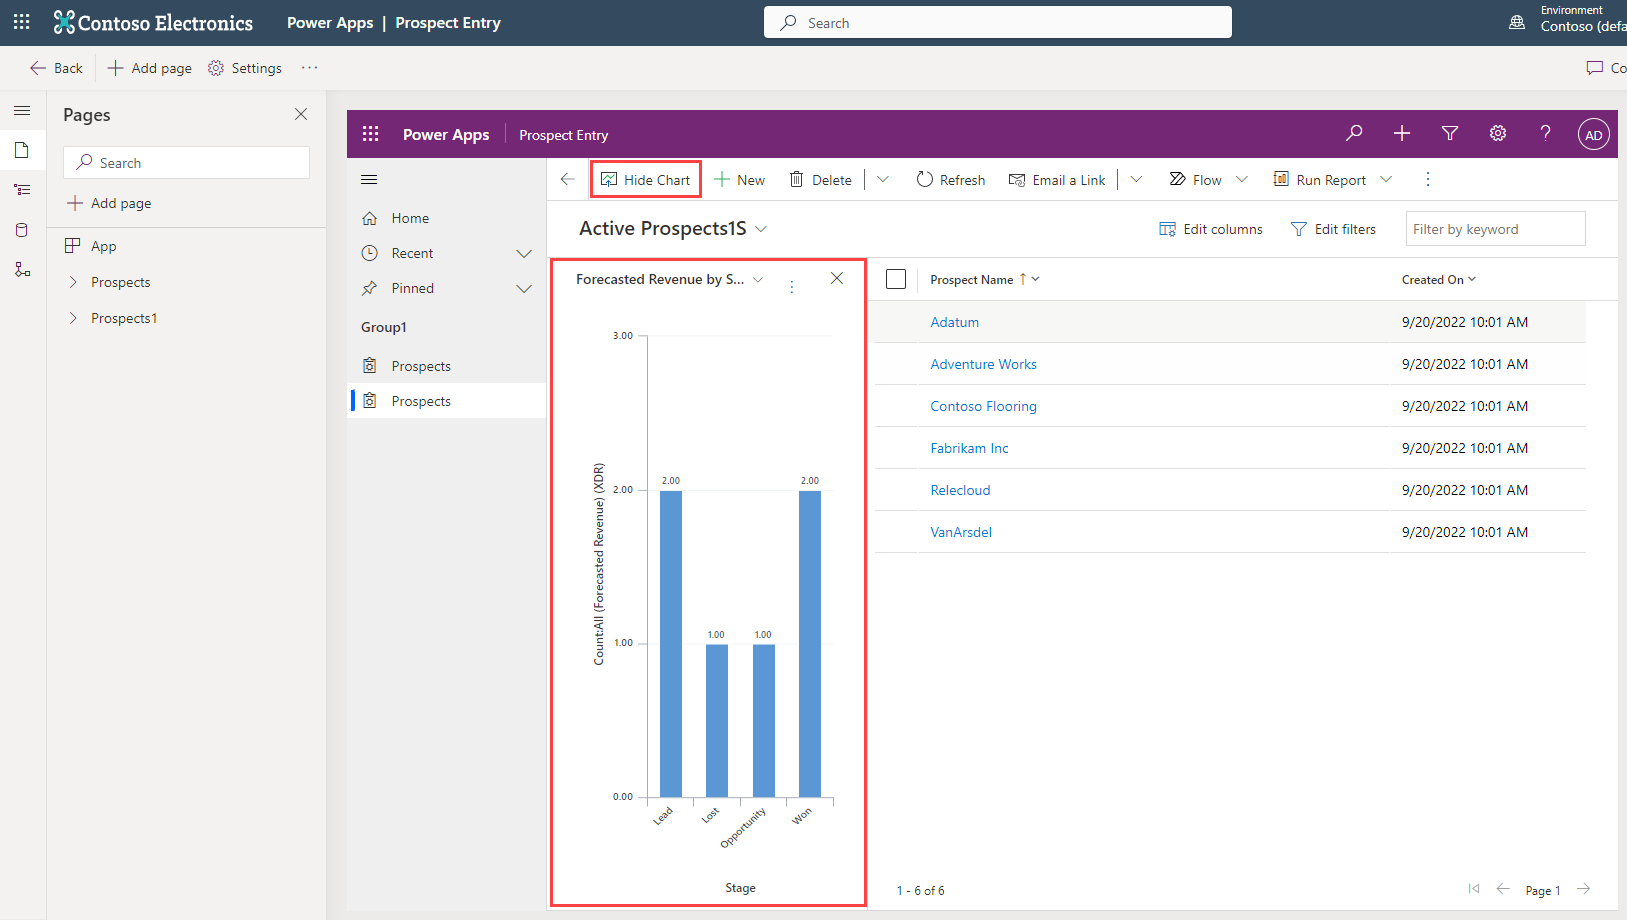
Return to your App Designer browser tab, and select the Show Chart button in the App screen header ribbon. (It might appear as an icon the first time you look for it, but it is near the image highlighted below.) The Show Chart button toggles to the Hide Chart button, so your user can toggle it on and off. If you have data in your table, you will see the chart you just created (if you don't have any data, you can return to your Prospects table and manually add some):
In your app editor, select Publish. Next, let's add a form for users to enter data.
Create the form
From the Power Apps Home screen, select Tables. Select the Prospects table.
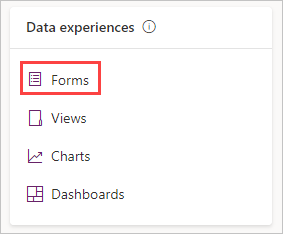
Select Forms under Data experiences.
Select the drop-down arrow next to + New form in the header, and then select Main Form and Create.
From the list of table columns on the left, select the Stage column to add it to your form. Then drag, and drop it below the Owner column in the form canvas. You can drag and drop any column to reposition it on the form. If you select a column without dragging it, the column is added below the currently selected form field.
Select the Contract Amount column to add it below the Stage column.
Select the Probability column to add it below the Contract Amount column.
Select the Forecasted Revenue column to add it below the Probability column.
With Forecasted Revenue still selected look at your Properties tab on the right side of the screen. Select the checkbox for Read-only column. When complete, your form should look similar to this screenshot:
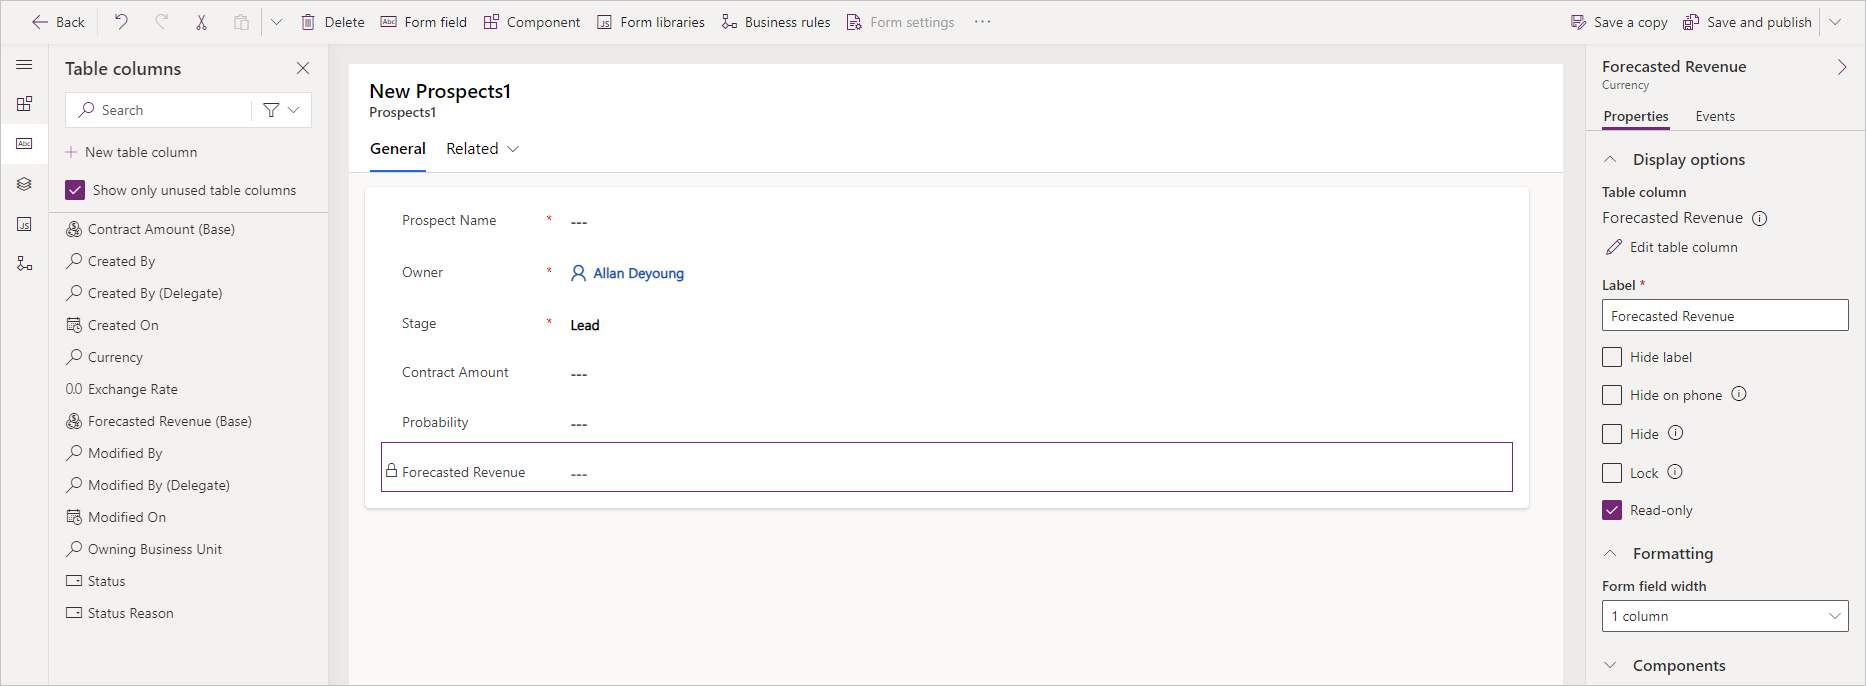
From the ribbon at the top, select Save and Publish.
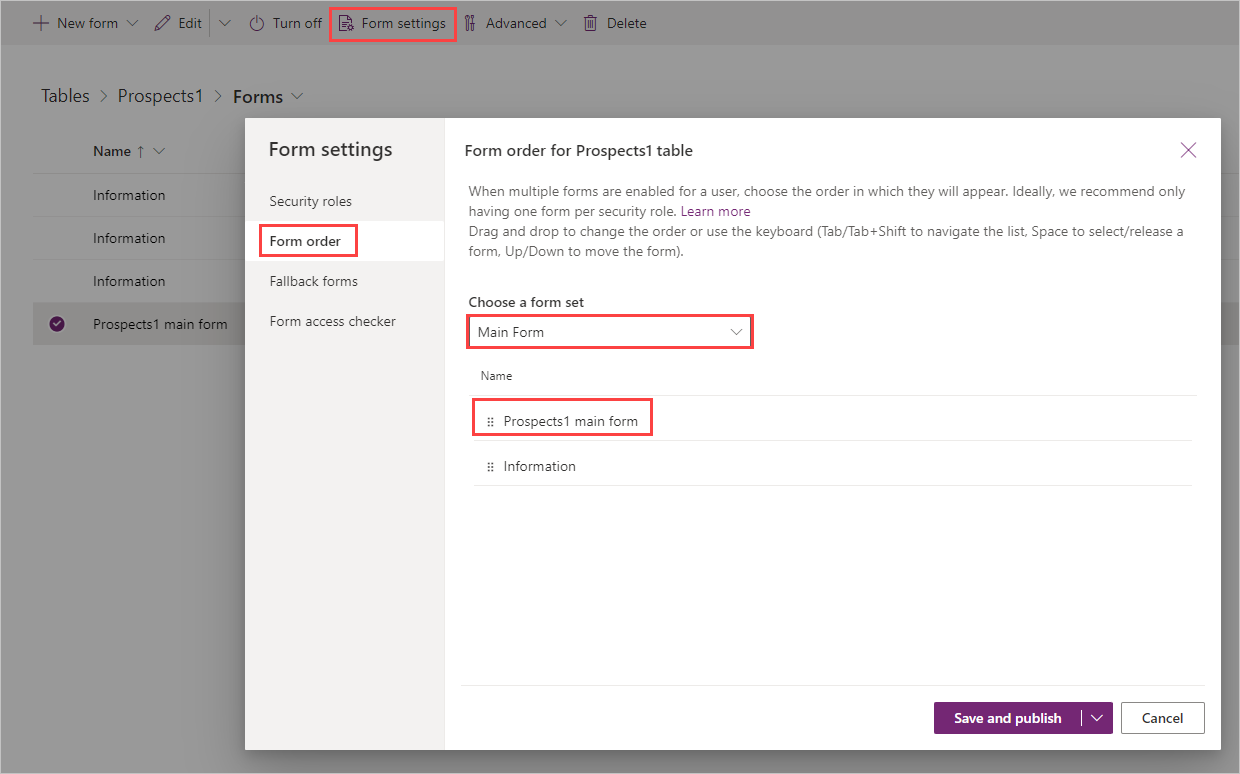
Return to the Tables>Prospects>Forms screen by selecting the Back button from the top left of the ribbon. Now let's make the form you just created the default form for your app.
Select Form settings from the Forms ribbon, then Form order in the pop-up. Make sure that Main Form is selected in the form set dropdown. Find your new "Prospects" form. You can drag and drop to change the form order. Move your new form above the form named Information (to the top of the list of forms). Then select Save and publish.
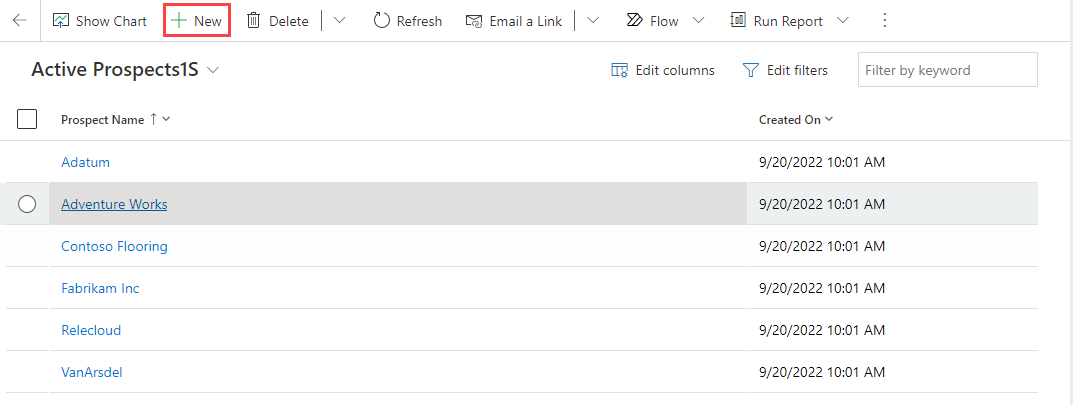
Open your app builder from the Power Apps Home screen by selecting Apps and then selecting the name of your app. In the app builder, go to your Home screen where you have your Prospects data, and select + New from the app header that is in the form canvas to bring up your new Main form.
Note
You might need to refresh the app to ensure that it's using your new form as the default.
Select New:
Your new form ready for data:
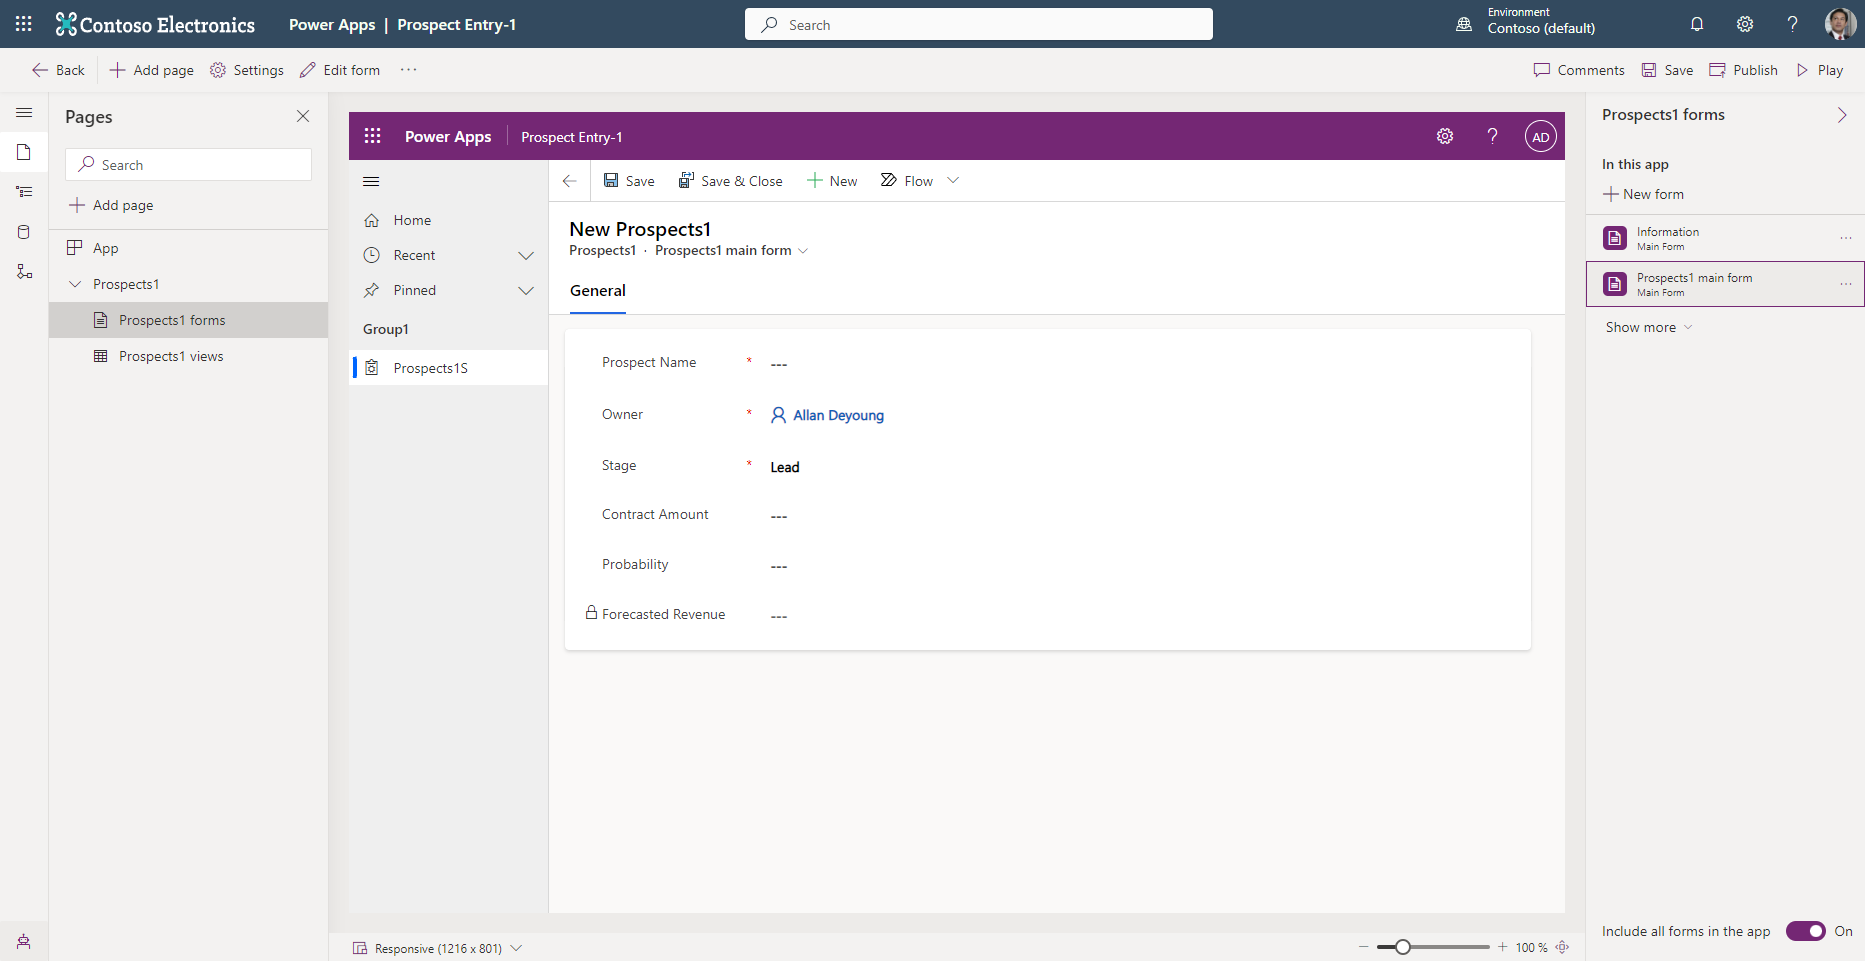
Notice that your Prospect Name, Stage, Contract Amount, and Probability fields are editable, and your Forecasted Revenue field is read-only.
Finally, Publish your app.
Congratulations! You have successfully created a new model-driven app based on your data. Your new app includes a chart to visualize your data and a form for users' data entry.