Use Power BI
In order to create reports with Power BI, you must first understand the tools necessary. There are three primary components to Power BI:
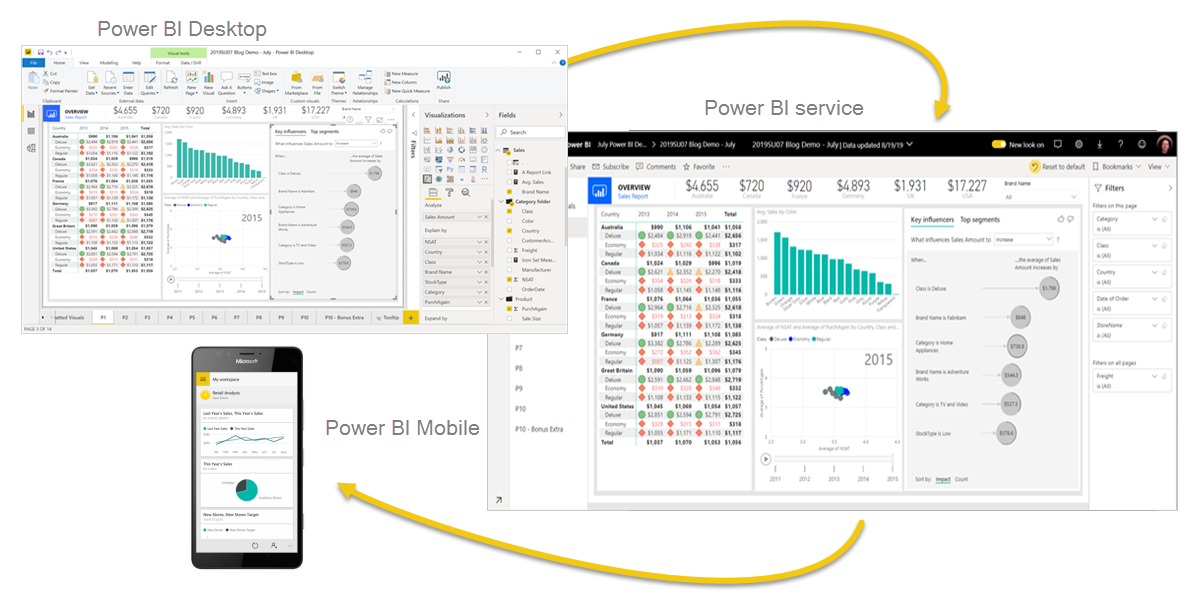
- Power BI Desktop (desktop application)
- Power BI service (online platform)
- Power BI Mobile (cross-platform mobile app)
Power BI Desktop is the development tool available to data analysts and other report creators. While the Power BI service allows you to organize, manage, and distribute your reports and other Power BI items. Power BI Desktop is available to download for free either through the Windows store or as a direct installer.
You can access the Power BI service at app.powerbi.com with a school or work account. If your organization doesn't already use Power BI, you can still explore the service by getting a free trial or signing up for a free Microsoft 365 Developer account.
Power BI Mobile allows consumers to view reports in a mobile-optimized format. You can create these optimized report views in Power BI Desktop.
Explore the flow of Power BI
There's a common flow when creating reports with Power BI. First, you start with Power BI Desktop to connect to data and create the report. Then you publish the report to the Power BI service and distribute to consumers.
The flow of Power BI is:
- Connect to data with Power BI Desktop.
- Transform data with Power Query Editor (comes with Power BI Desktop).
- Model data with Power BI Desktop.
- Create visualizations and reports with Power BI Desktop.
- Publish report to Power BI service.
- Distribute and manage reports in the Power BI service.
The Power BI service also allows you to create high-level dashboards that drill down to reports, and apps to easily group related reports to users in a simple format.
Tip
See additional details about Power BI in the reference documentation.