Use Power Apps with Power Automate and Power BI
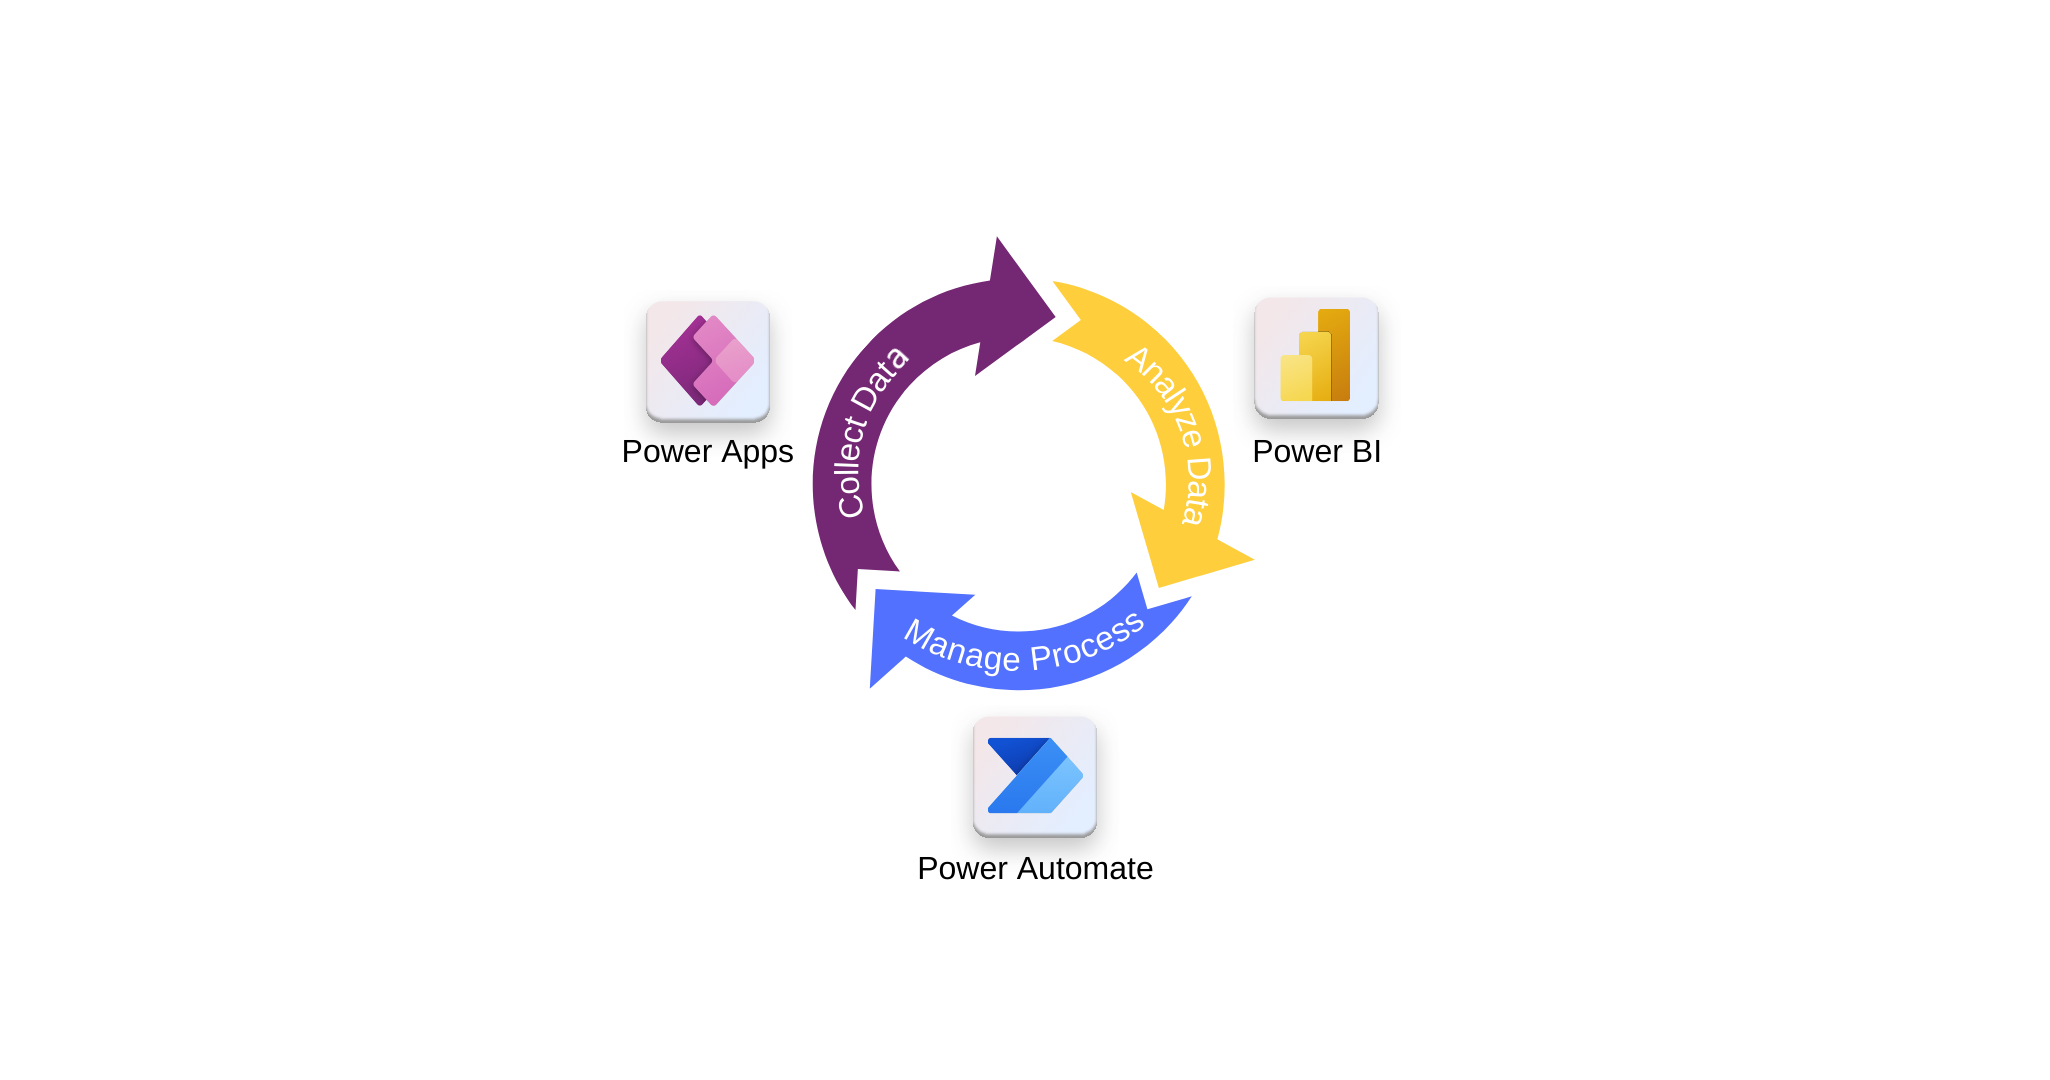
The Microsoft Power Platform includes Power Apps, Power Automate, and Power BI—three technologies that work together to support custom business solutions. Power Automate and Power BI integrate with Power Apps to create automated workflows and rich data visualizations. Like Power Apps, these services can connect to hundreds of data sources, including cloud and desktop systems. This unit introduces the purpose and typical use cases of Power Automate and Power BI.
Power Automate
Power Automate enables the creation of automated workflows that can send notifications, run business processes, collect data, and more. Flows can be triggered by events in a Power Apps app and can return data to the app. A single flow can perform multiple actions, such as:
- Updating a data source
- Downloading data
- Writing files
- Generating PDFs
- Sending email
- Scheduling calendar events
- Sending messages in Microsoft Teams
- Starting approval processes
Power Automate serves as a process automation engine for business scenarios.
Power Automate Desktop
Power Automate Desktop extends automation capabilities to legacy systems on a local machine. It can replicate routine user interactions on a desktop, such as clicking buttons or entering data. When used with premium connectors, desktop flows can be triggered from a cloud-based Power Automate flow and initiated through Power Apps.
When to use Power Automate
Power Automate is recommended when business logic goes beyond what Power Apps can perform natively. While Power Apps can handle actions like sending an email with dynamic content when a button is pressed, more complex processes—such as multi-step approvals or scheduled flows—are better suited to Power Automate.
For example, Power Automate can:
- Initiate a follow-up when a new incident report is submitted
- Trigger a process when new data is created in another system
- Check each morning for inspection tasks due that day and send email notifications with a link to the relevant Power Apps form
These scenarios benefit from Power Automate’s ability to manage sophisticated workflows across systems.
Power BI
Power BI is an analytics and reporting tool in the Microsoft Power Platform. It connects to multiple data sources and creates visualizations that help organizations gain insight from their data. Business users can build custom reports and dashboards using a wide range of visualization options.
Reports created in Power BI are private by default. To share them, both the report creator and viewers must have a Power BI Pro license, which requires an additional purchase. This license allows for content sharing and permissions management.
While Power Apps supports basic visual elements like charts and tables, solutions that require advanced analytics are better served by Power BI. Integration between Power Apps and Power BI provides additional flexibility.
Embed Power BI tiles in a canvas app
By embedding a Power BI tile in a Power Apps canvas app, it’s possible to present data visualizations directly within the app interface. This helps users consume key metrics in the context of their workflow.
Embed a canvas app in a Power BI dashboard
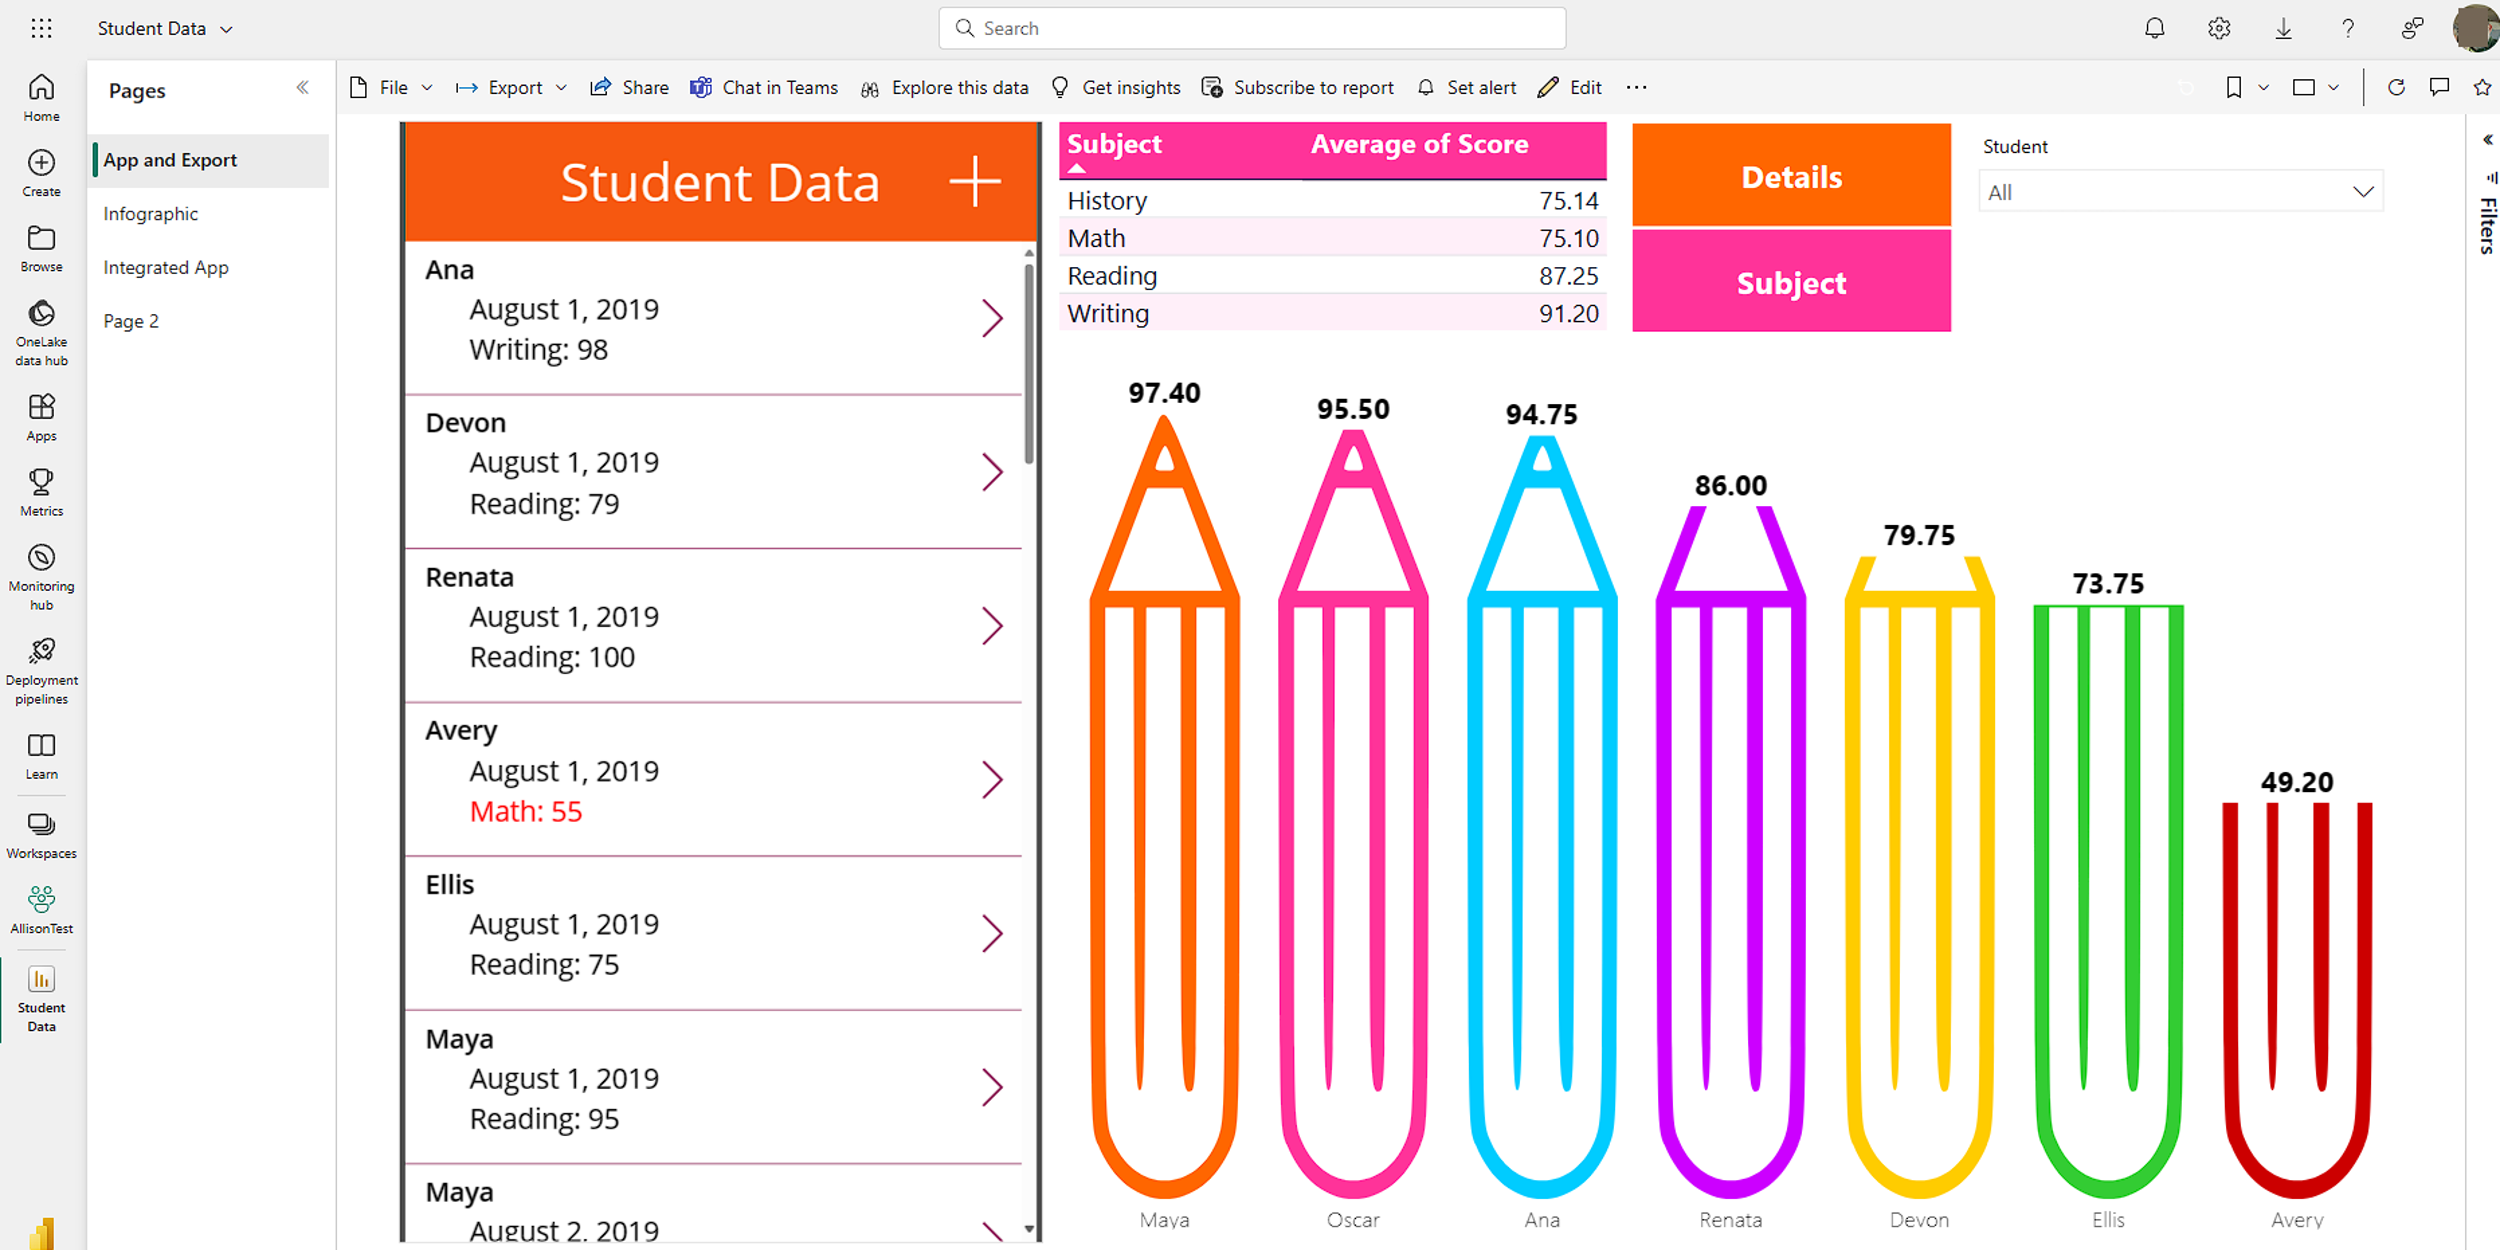
It’s also possible to embed a Power Apps canvas app in a Power BI dashboard. This allows users to act on insights within the dashboard view without switching tools.
For example, in an inventory management report for a manufacturing facility, a user can submit a material purchase request directly from the dashboard. The experience feels unified, though both Power BI and Power Apps are at work.
After embedding a Power Apps app in Power BI, users can navigate app screens and interact with filters that update visualizations in real time.
When to use Power BI
Choose Power BI when your solution requires in-depth data analysis and interactive visualizations. For example, dashboards that track KPIs, compare trends, or visualize aggregated metrics benefit from Power BI’s capabilities.
For simpler use cases, such as adding visual context to a form or showing basic charts, Power Apps may be sufficient. However, if the solution requires robust visual exploration and reporting, Power BI is the preferred tool—keeping in mind that it may require additional licensing for end users.
Summary
The Microsoft Power Platform offers robust integration across Power Apps, Power Automate, and Power BI. Power Automate streamlines business processes—from simple notifications to complex workflows—with support for desktop automation via Power Automate Desktop. Power BI transforms data into interactive reports and dashboards, ideal for advanced analytics.
Together, these tools help deliver complete solutions. Whether embedding a visualization in an app or integrating app controls into a dashboard, the Power Platform supports a seamless user experience tailored to diverse business needs.


