Manage data quality with pipeline expectations
Data quality issues can disrupt downstream analytics and erode trust in your data. When invalid records slip into production tables, they might cause report failures, incorrect business decisions, or compliance violations. Pipeline expectations in Lakeflow Spark Declarative Pipelines give you a way to define quality rules that run automatically as data flows through your pipeline.
With expectations, you specify what valid data looks like using SQL constraints. The pipeline then checks every record against these rules and takes the action you configure—logging the issue, dropping the record, or failing the update entirely.
Define expectations with three components
Every expectation consists of three parts: a name, a constraint, and an action. Understanding these components helps you design effective data quality checks.
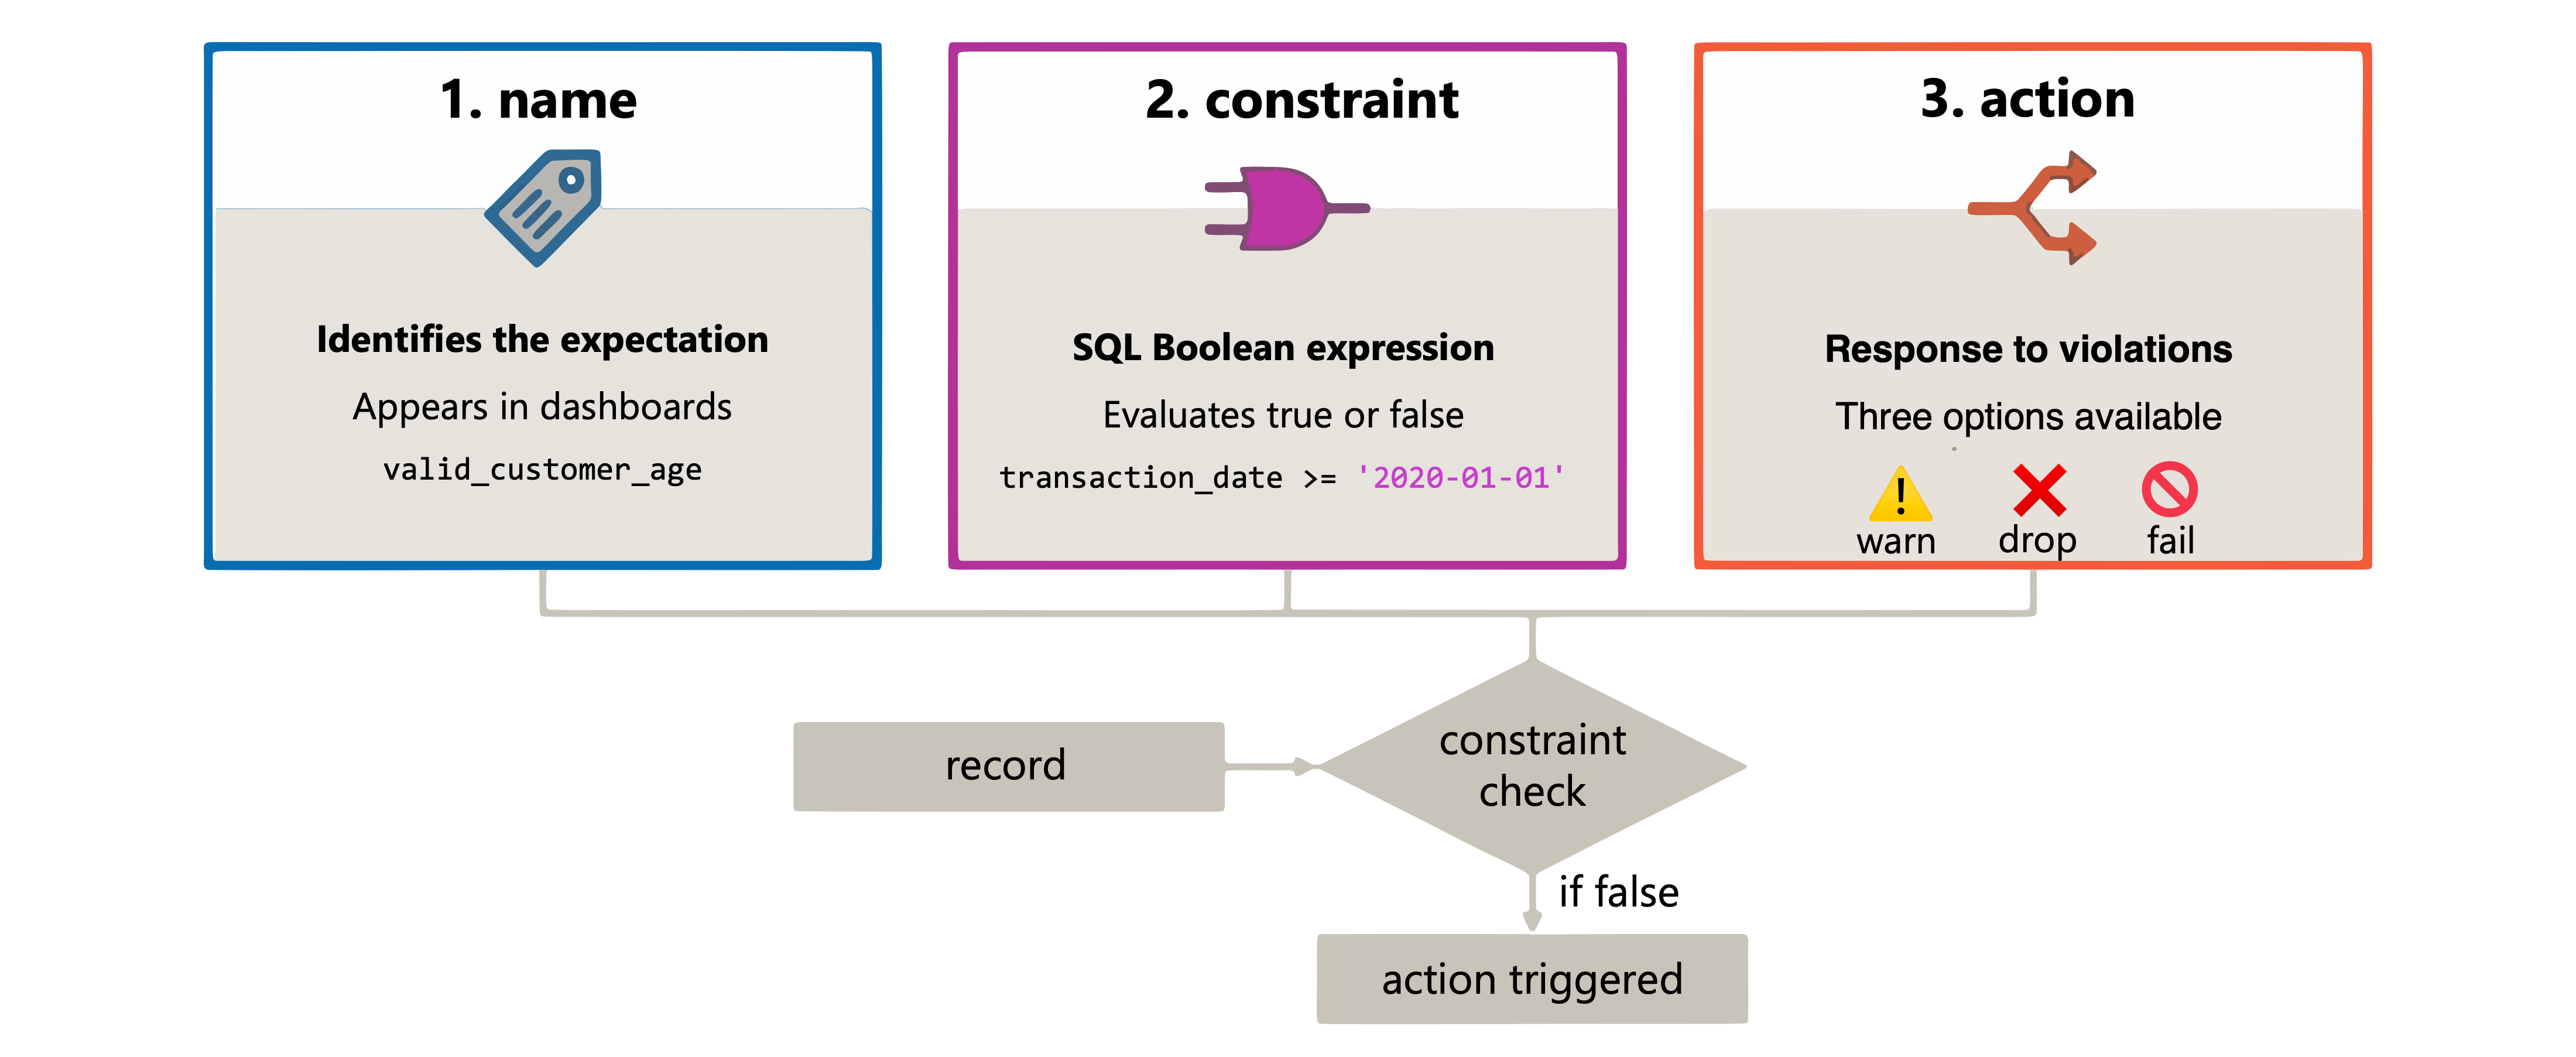
The name identifies the expectation and appears in monitoring dashboards. Choose names that clearly describe what you're validating. For example, valid_customer_age communicates the rule's purpose better than check_1.
The constraint is a SQL Boolean expression that evaluates to true or false for each record. When a record fails the constraint, the expectation triggers. You can use any valid SQL syntax except custom Python functions, external service calls, or subqueries.
Here's how you might check that transaction dates fall within an expected range:
@dp.expect("valid_transaction_date", "transaction_date >= '2020-01-01' AND transaction_date <= current_date()")
The same constraint in SQL:
CONSTRAINT valid_transaction_date EXPECT (transaction_date >= '2020-01-01' AND transaction_date <= current_date())
The action determines what happens when a record violates the constraint. You have three options, each suited to different scenarios in your data pipeline.
Choose the right action for invalid records
Your choice of action depends on how critical the data quality issue is and how you want to handle violations.
| Action | When to use | Behavior |
|---|---|---|
| Warn | Monitoring quality trends without blocking data | Invalid records flow through; metrics captured for review |
| Drop | Filtering out bad records automatically | Invalid records removed; valid records continue |
| Fail | Stopping the pipeline for critical violations | Update fails immediately; requires manual intervention |
The warn action is the default behavior. It writes all records to the target table, including invalid ones, while logging metrics about failures. This approach works well when you're establishing baselines or when downstream systems can handle some data quality issues.
@dp.expect("non_null_email", "email IS NOT NULL")
def customer_contacts():
    return spark.readStream.table("raw.customers")
The drop action removes records that fail validation before writing to the target. Use this when you need clean data downstream and can afford to lose some records.
@dp.expect_or_drop("valid_price", "price >= 0 AND price <= 10000")
def validated_orders():
    return spark.readStream.table("raw.orders")
The SQL equivalent uses ON VIOLATION DROP ROW:
CREATE OR REFRESH STREAMING TABLE validated_orders(
    CONSTRAINT valid_price EXPECT (price >= 0 AND price <= 10000) ON VIOLATION DROP ROW
) AS SELECT * FROM STREAM(raw.orders);
The fail action stops execution immediately when any record violates the constraint. The pipeline atomically rolls back any partial updates. This option makes sense for critical data where invalid records indicate a serious upstream problem.
@dp.expect_or_fail("required_customer_id", "customer_id IS NOT NULL")
def critical_transactions():
    return spark.readStream.table("raw.transactions")
In SQL, use ON VIOLATION FAIL UPDATE:
CREATE OR REFRESH STREAMING TABLE critical_transactions(
    CONSTRAINT required_customer_id EXPECT (customer_id IS NOT NULL) ON VIOLATION FAIL UPDATE
) AS SELECT * FROM STREAM(raw.transactions);
Note
When a pipeline has multiple parallel flows, a failure in one flow doesn't cause other flows to fail. Each flow operates independently.
Combine multiple expectations for comprehensive checks
Real-world data validation often requires multiple rules. You can stack expectations on a single dataset to check different aspects of data quality.
In Python, add multiple decorator calls:
@dp.expect("valid_amount", "amount > 0")
@dp.expect("valid_currency", "currency IN ('USD', 'EUR', 'GBP')")
@dp.expect("valid_timestamp", "created_at <= current_timestamp()")
def validated_payments():
    return spark.readStream.table("raw.payments")
Python also supports grouping expectations into reusable dictionaries. This approach helps you maintain consistency across multiple tables:
payment_rules = {
    "valid_amount": "amount > 0",
    "valid_currency": "currency IN ('USD', 'EUR', 'GBP')",
    "valid_timestamp": "created_at <= current_timestamp()"
}

@dp.expect_all_or_drop(payment_rules)
def clean_payments():
    return spark.readStream.table("raw.payments")
The expect_all, expect_all_or_drop, and expect_all_or_fail decorators apply the same action to all expectations in the group.
In SQL, separate multiple constraints with commas:
Tip
In-memory dictionaries are convenient for simple pipelines, but they embed rules inside your notebook. For production workloads where the same rules should apply across multiple pipelines, store expectations in a Unity Catalog Delta table instead — rules become version-controlled, auditable, and queryable like any other governed asset.
Store rules in a Unity Catalog table
Centralizing expectations in a Unity Catalog table separates quality rules from pipeline logic. You update or audit rules in one place, and every pipeline that references the table picks up the change automatically.
First, create a rules table in a governed schema:
CREATE OR REPLACE TABLE governance.data_quality.rules AS
SELECT col1 AS name, col2 AS constraint, col3 AS tag
FROM (
  VALUES
    ('valid_amount',    'amount > 0',                              'financial'),
    ('valid_currency',  'currency IN (''USD'', ''EUR'', ''GBP'')',  'financial'),
    ('non_null_email',  'email IS NOT NULL',                       'customer'),
    ('valid_hire_date', 'hire_date <= current_date()',             'hr')
);
Then define a helper function that reads rules filtered by tag and returns them as a dictionary:
from pyspark import pipelines as dp
from pyspark.sql.functions import col

def get_rules(tag):
    df = spark.read.table("governance.data_quality.rules").filter(col("tag") == tag).collect()
    return {row["name"]: row["constraint"] for row in df}

@dp.table
@dp.expect_all_or_drop(get_rules("financial"))
def validated_payments():
    return spark.readStream.table("raw.payments")

@dp.table
@dp.expect_all_or_drop(get_rules("customer"))
def validated_customers():
    return spark.readStream.table("raw.customers")
Because the rules table lives in Unity Catalog, it benefits from lineage tracking, access control, and audit logs alongside your data tables. Teams can update a constraint by editing one row in the rules table, without touching any pipeline notebook.
CREATE OR REFRESH STREAMING TABLE validated_payments(
    CONSTRAINT valid_amount EXPECT (amount > 0),
    CONSTRAINT valid_currency EXPECT (currency IN ('USD', 'EUR', 'GBP')),
    CONSTRAINT valid_timestamp EXPECT (created_at <= current_timestamp())
) AS SELECT * FROM STREAM(raw.payments);
Monitor expectation results
After you define expectations, you can track their results through the pipeline UI. This visibility helps you understand data quality trends and identify recurring issues.
To view expectation metrics:
- Open Jobs & Pipelines in the Azure Databricks workspace sidebar.
- Select your pipeline by name.
- Select a dataset that has expectations defined.
- Open the Data quality tab in the right sidebar.

The metrics show you how many records passed or failed each expectation during pipeline runs. For warn and drop actions, you see counts of violations. For fail actions, the pipeline stops before metrics are recorded, but error messages include details about the violating record.
When a fail expectation triggers, the error message provides context to help you investigate:
[EXPECTATION_VIOLATION.VERBOSITY_ALL] Flow 'sensor-pipeline' failed to meet
the expectation. Violated expectations: 'temperature_in_valid_range'.
Input data: '{"id":"TEMP_001","temperature":-500,"timestamp_ms":"1710498600"}'.
You can also query expectation metrics programmatically through the Lakeflow Spark Declarative Pipelines event log. This approach enables you to build custom dashboards or trigger alerts based on data quality thresholds.
Understanding when to use expectations sets you up to build pipelines that catch data quality issues before they affect downstream consumers. With the right combination of constraints and actions, you create a reliable data foundation for your analytics workloads.