Exercise - Add bookmarks to a report
Now that we have a report ready, let's use Bookmarks to tell the story we discovered. Bookmarks capture the currently configured view of a report page, including filtering and the state of visuals, which helps to present the story.
Section 1: Add bookmarks
Make sure you're using the MyFirstPowerBIModel file you've been working on in the previous units.
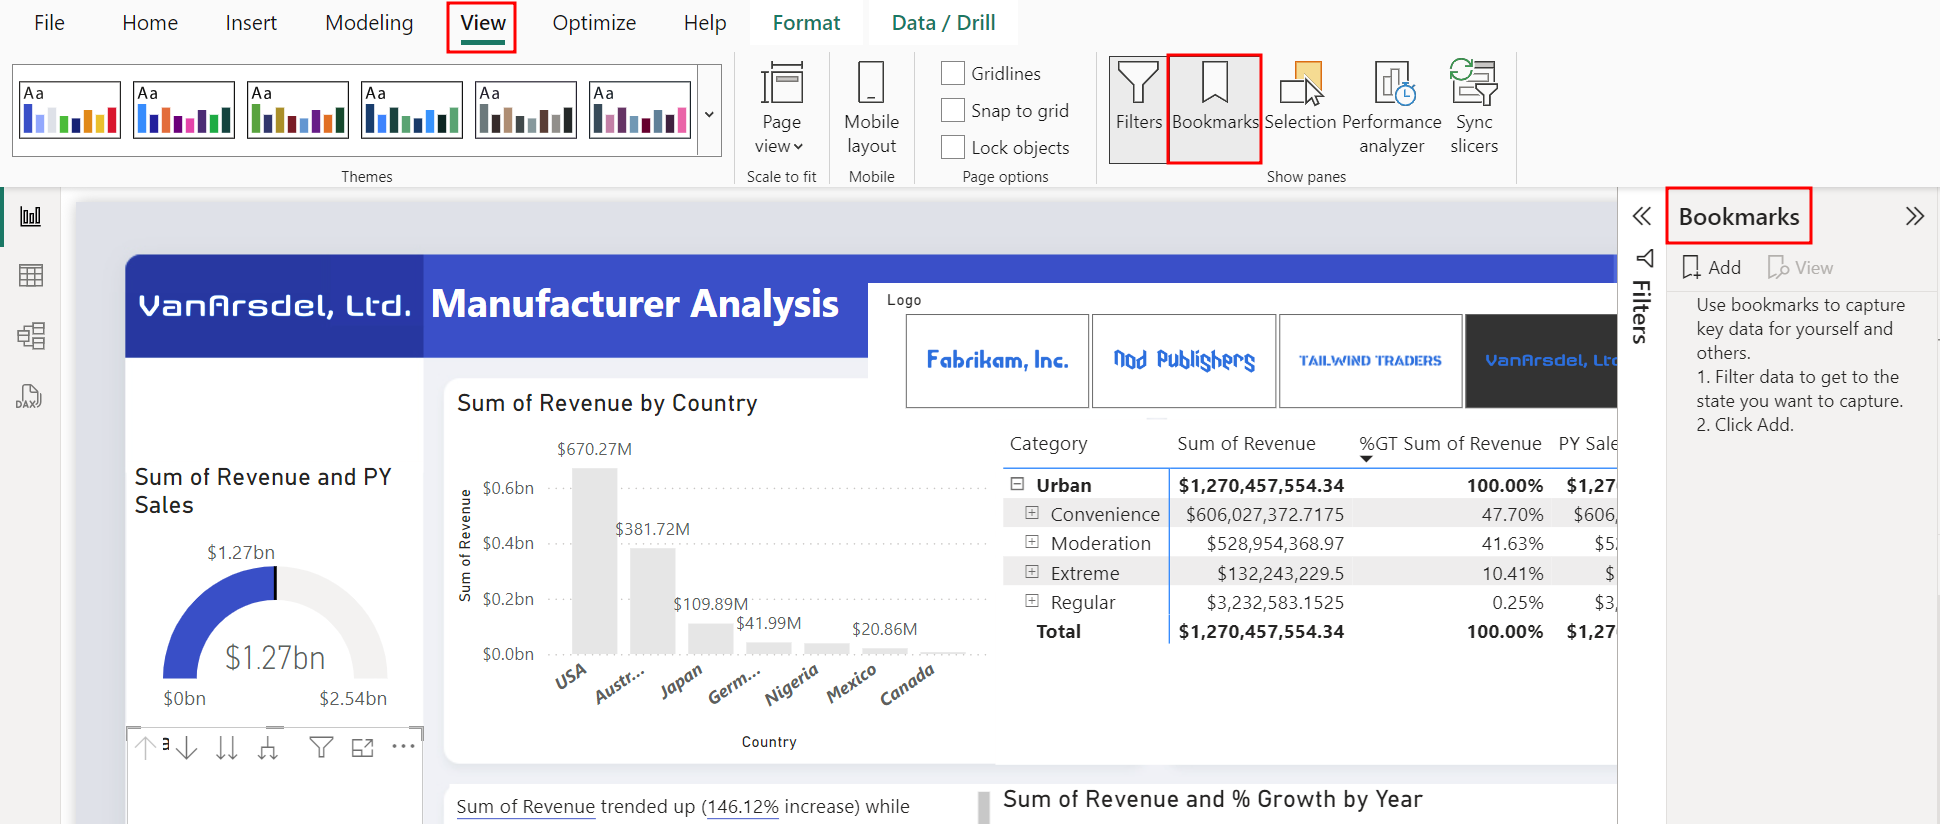
From the ribbon, select the View tab.
Select the Bookmarks button to turn on Bookmarks. The Bookmarks pane opens.
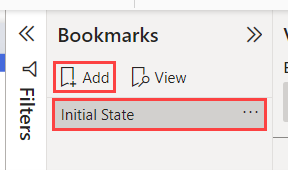
Select Add in the Bookmarks pane. This adds the current state of the visual to the bookmark.
Select the ellipses (...) to the right of the newly created Bookmark 1.
Choose Rename and change the name to Initial State.
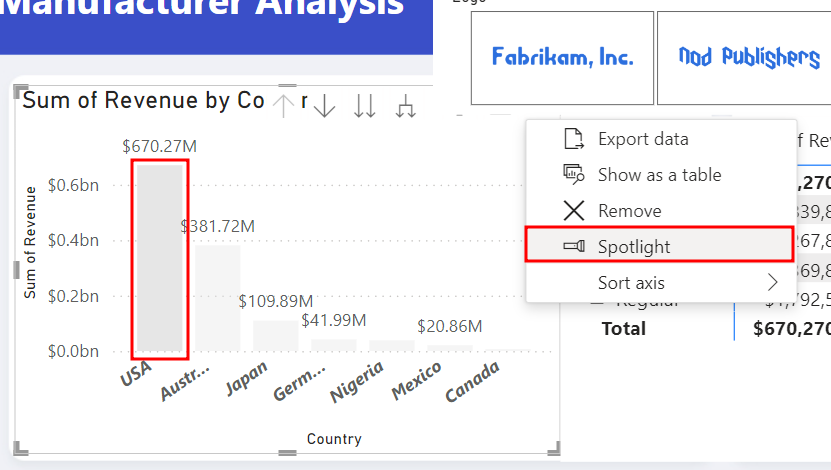
In the Sum of Revenue by Country visual, select the USA column.
Hover over the Sum of Revenue by Country visual and select the ellipses (...) in the top right corner.
Select Spotlight.
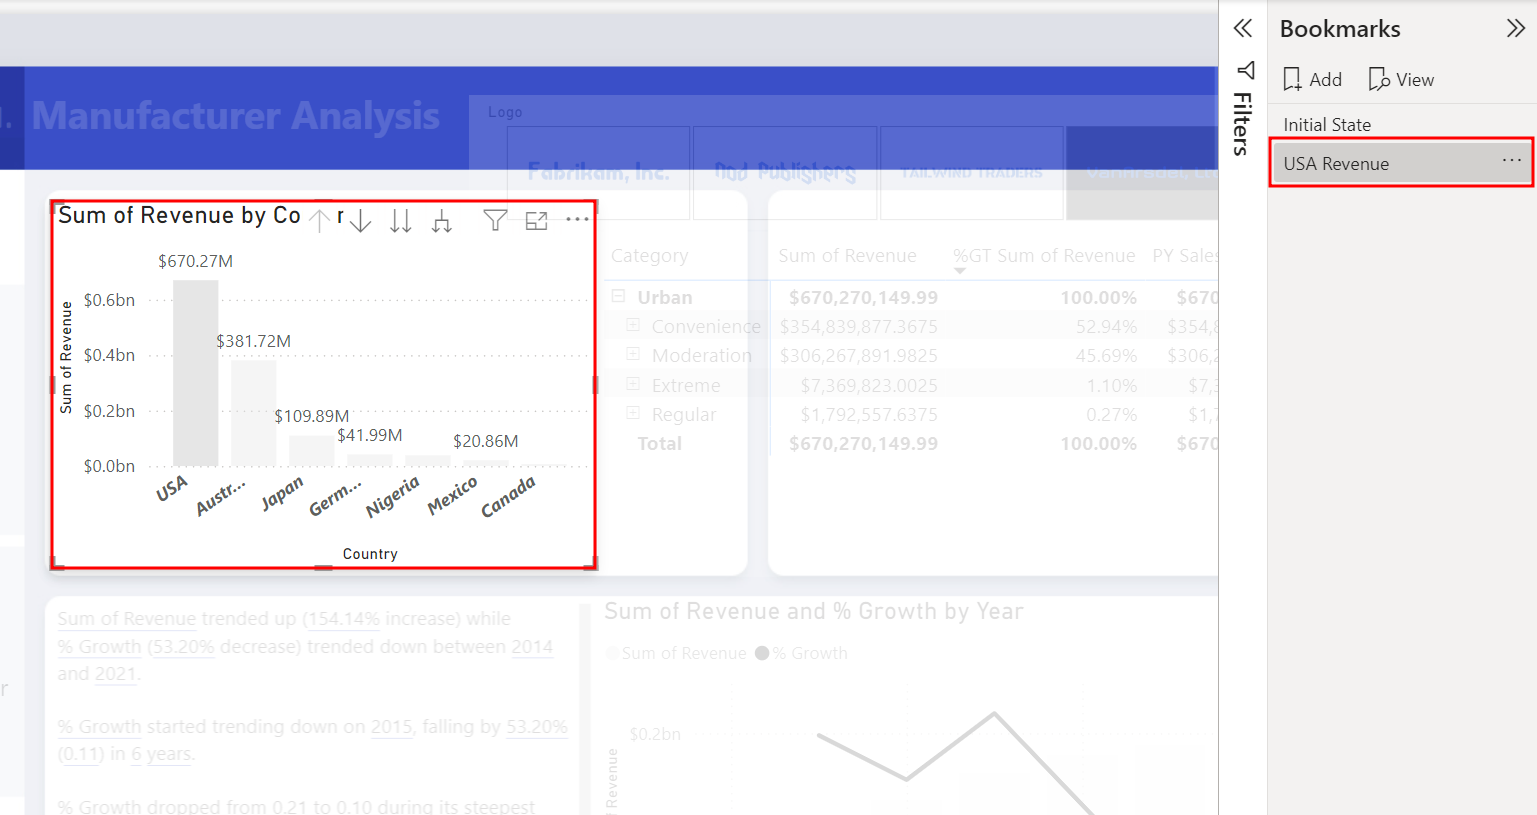
In the Bookmarks pane, select Add. This adds a new bookmark with the current state of the report.
Change the bookmark name to USA Revenue.
Select the canvas to ensure that nothing is currently selected.
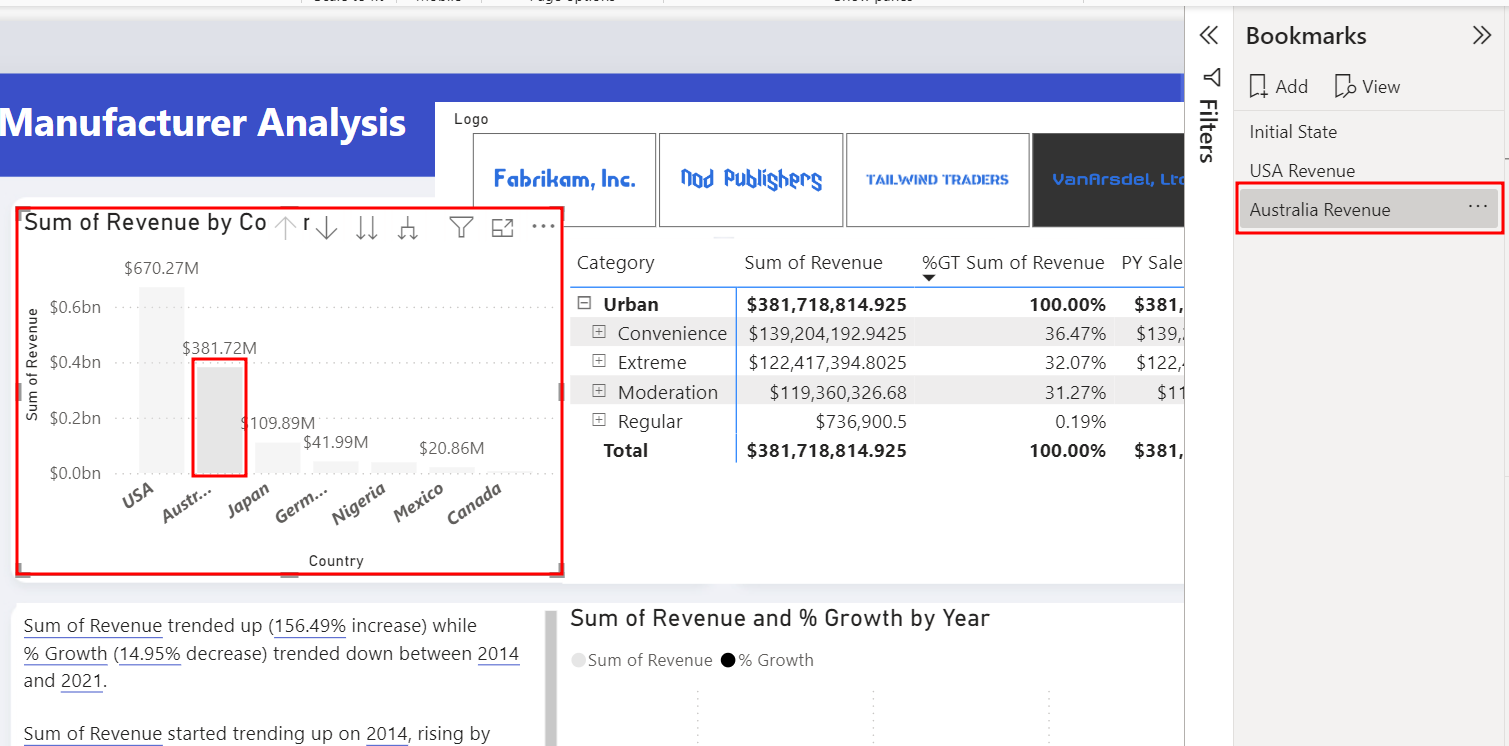
Select Australia within the Sum of Revenue by Country visual.
In the Bookmarks pane, select Add. This adds a new bookmark with the current state of the report.
Change the bookmark name to Australia Revenue.
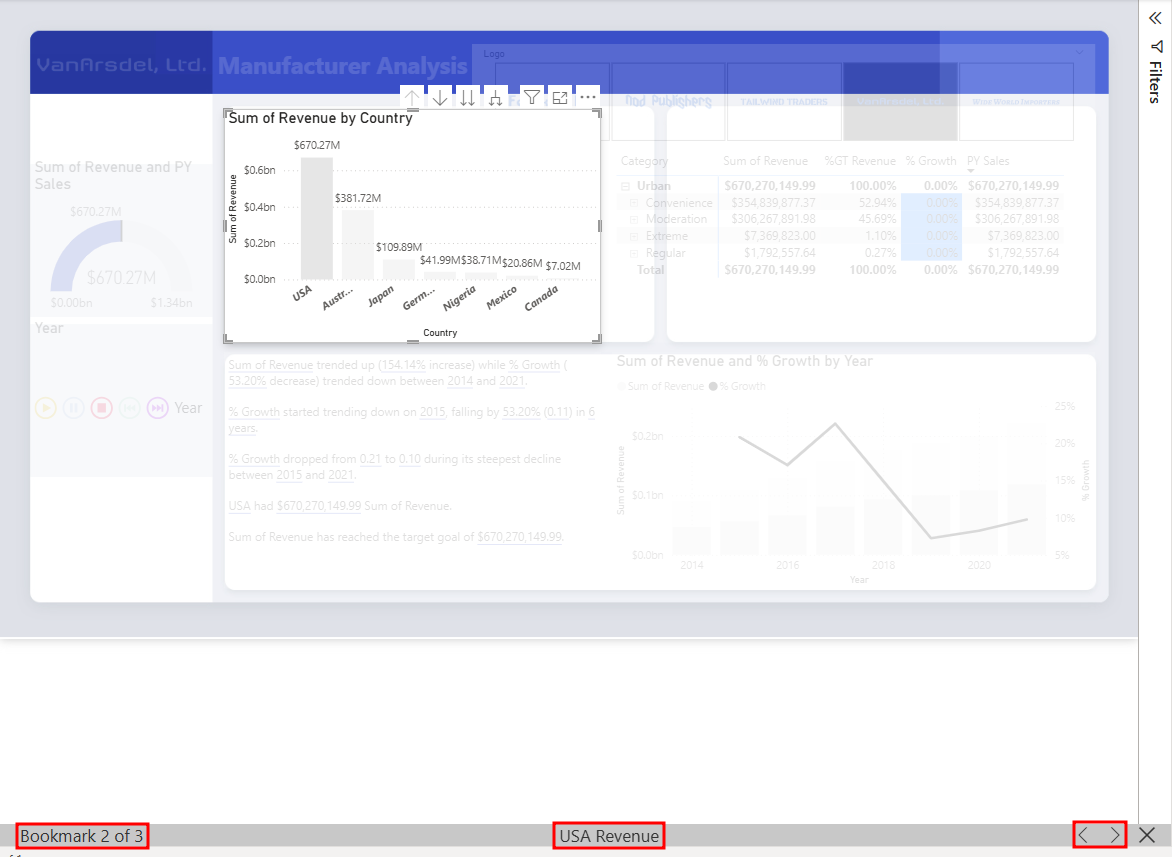
From the Bookmarks pane, select View. You're now in Bookmarks slide show mode. You're in the first bookmark, which we named Initial State. Notice on the bottom of the report pane there's an option to navigate between bookmarks.
You can use the arrows to navigate between bookmarks and tell your story.
From the Bookmarks pane, select Exit to exit the Bookmarks slide show mode.
If time permits, feel free to explore other options available with Bookmarks, such as Selected Visuals, as you continue to build your story.
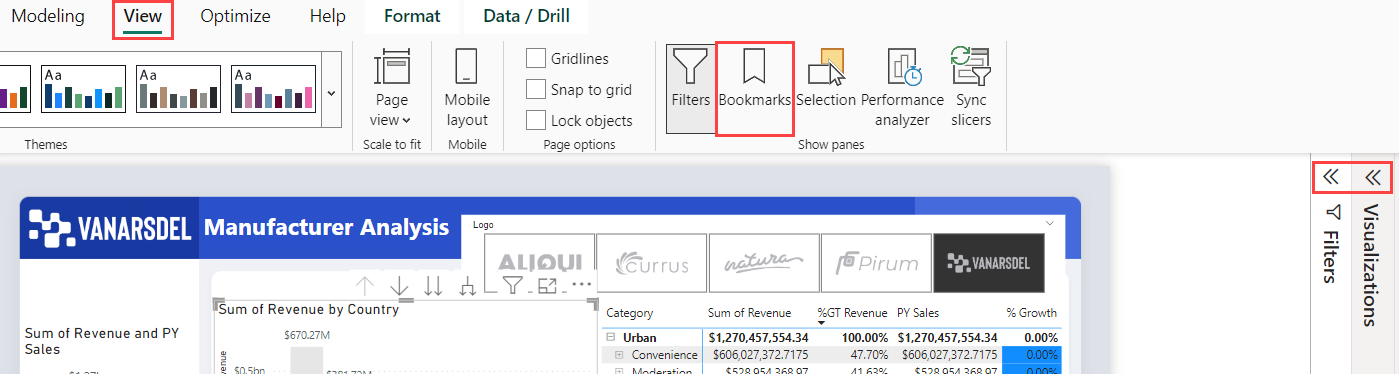
From the ribbon, select the View tab.
Unselect the Bookmarks Pane button.
Collapse the Visualizations and Filters panes by selecting the arrows to the top left corner of each pane.
Next we'll add a Bookmark navigator to move freely between bookmarks.
Section 2: Add a bookmark navigator
Let's add bookmark navigator buttons to the canvas.
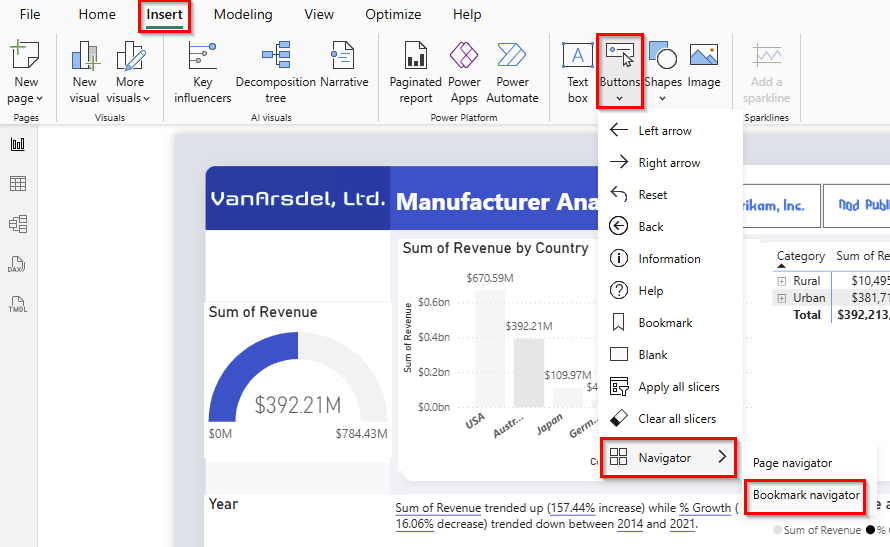
From the ribbon, select the Insert tab.
Select Buttons and choose Navigator > Bookmark navigator.
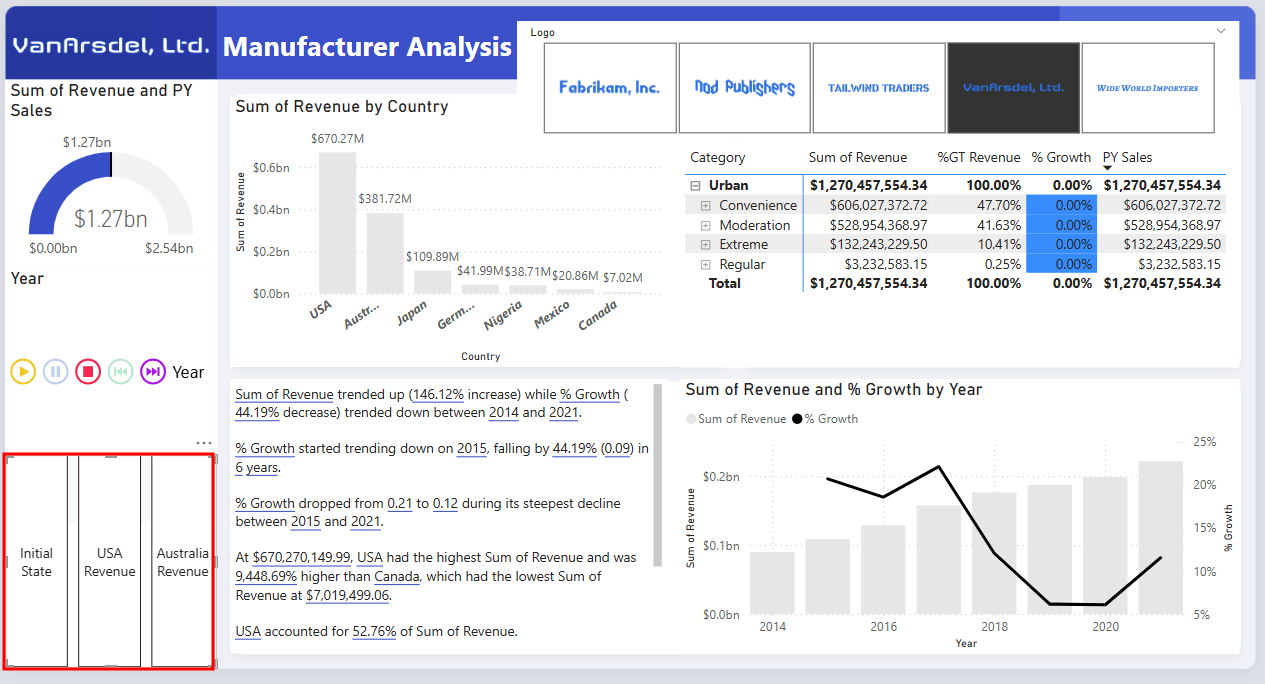
Arrange the Bookmark navigator to fit on the page as shown in the figure below:
With the buttons visual still selected, navigate to the Format navigator pane, expand the Style section, then expand the Fill section.
Change the Fill color to a light blue and set the Transparency to 40%.
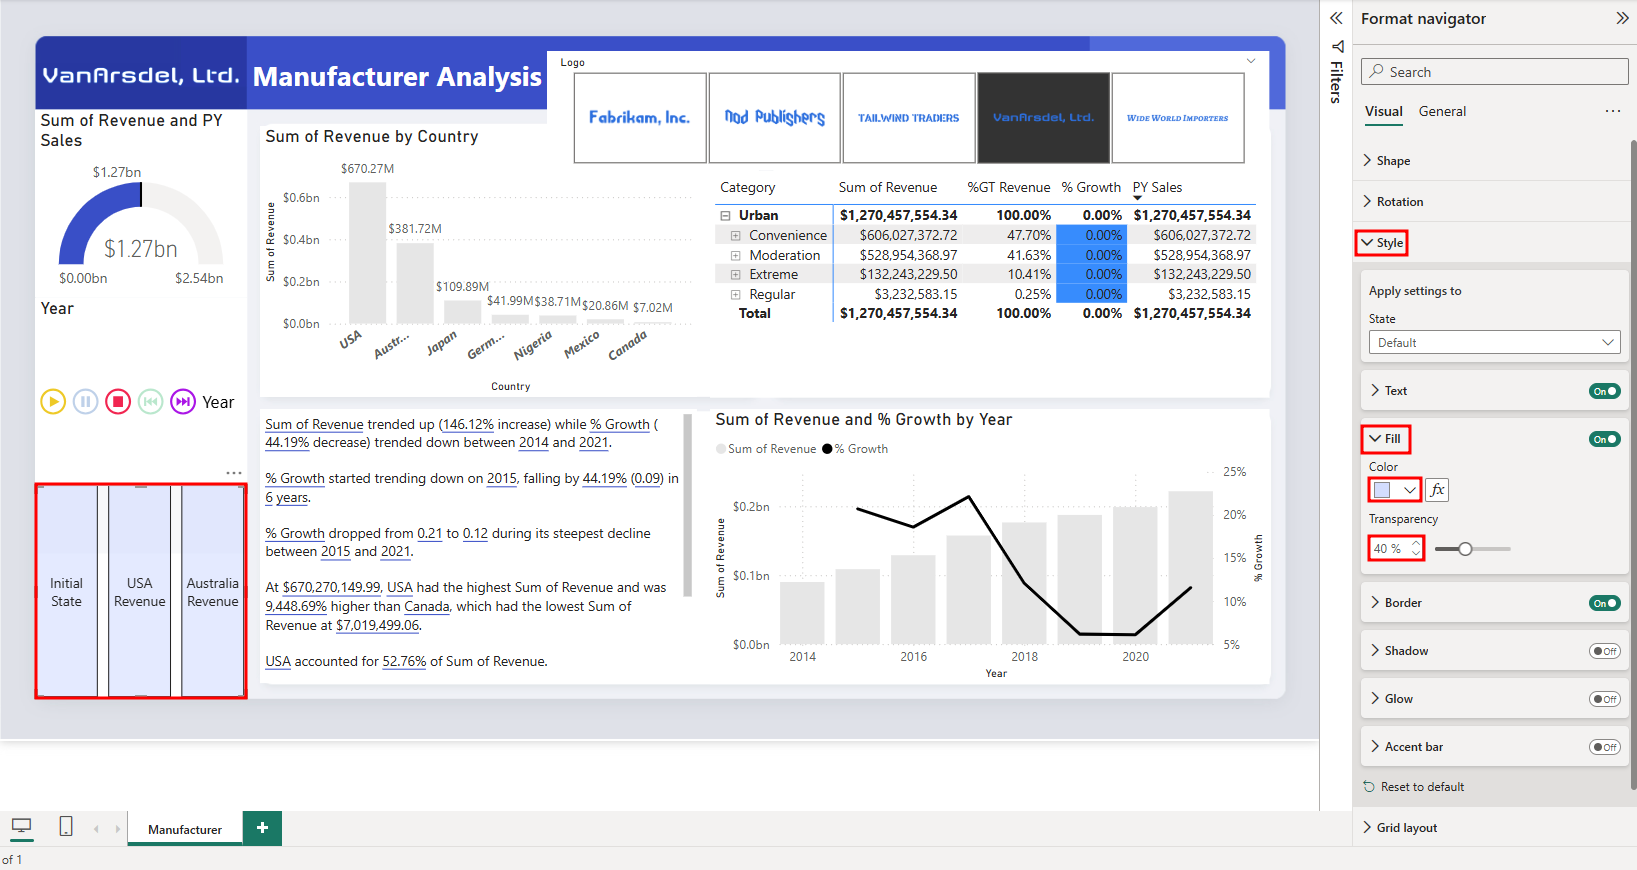
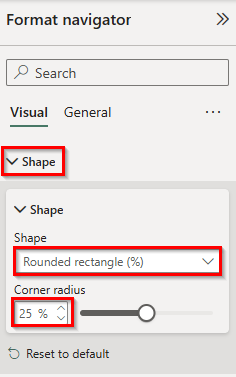
While still in the Format navigator pane, expand the Shape section.
From the Shape drop-down menu, select Rounded Rectangle.
Note
You may need to adjust the size of the buttons within the report after changing the shape.
Feel free to test out the new functionality.
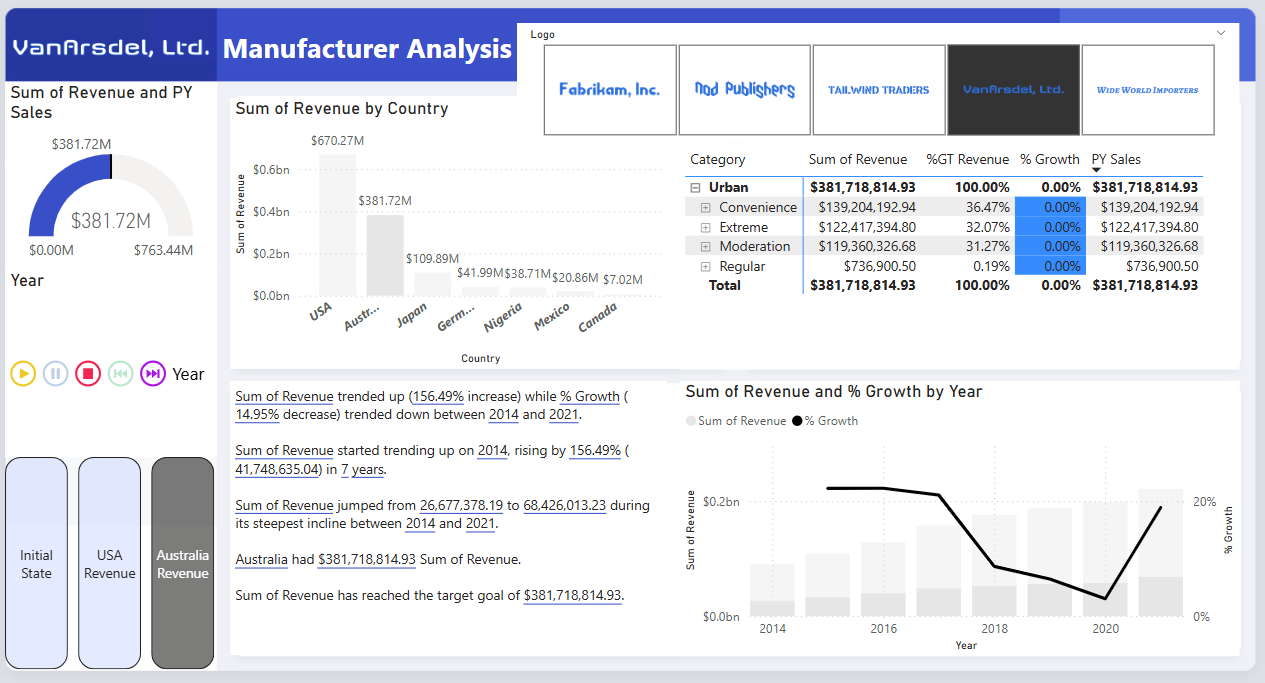
Using the Ctrl key on your keyboard, select the Australia Revenue bookmark from the visual. Notice how the data changes within the visuals in the report.
Note
To use the new buttons, you must use CTRL + Select while inside the Power BI Desktop. After publishing the report your end users will simply select the buttons without needing to hold CTRL.
Your report should look like the figure shown below. Now let's finish up by saving the file.
Note
Interacting with the report can significantly change the report's appearance. For example, selecting a year from the Sum of Revenue and % Growth by Year will activate the conditional formatting in the matrix.
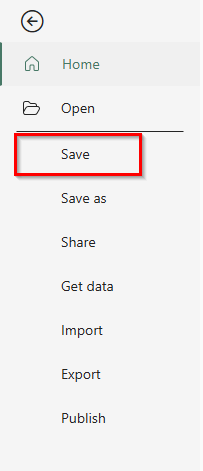
From the ribbon, select the File tab.
From the menu to the left, select Save.
You successfully created a report you can share with your team. The next Module covers creating a dashboard from this report to share with your team. You saw an overview of the functionality in Power BI Desktop. There are many more features for you to explore with your data in the next Modules.