Service level indicators (SLIs) and service level objectives (SLOs)
- 9 minutes
In this module thus far, we've learned how to increase our operational awareness, expand our understanding and framing of reliability, and have seen the Azure Monitor tools we'll need for our work. Now, it's time to explore one of the most important ideas in this module and the processes to implement it.
Let's answer the question, "how do I use all of this stuff to improve the reliability in my organization?"
Enter the feedback loop
Here's the big idea that can unlock the problem for us:
The right feedback loops improve reliability in your organization.
Improving reliability in your organization is an iterative process. In this unit, we're going to look at a highly effective practice from the site reliability engineering world to create and nurture the kind of feedback loop in an organization that helps it improve reliability. At the very least, it'll spark concrete conversations in your organization about reliability based on objective data.
Earlier in this module, we mentioned this as a definition for site reliability engineering:
Site Reliability Engineering is an engineering discipline devoted to helping organizations sustainably achieve the appropriate level of reliability in their systems, services, and products.
Here's where the concept of appropriate level of reliability comes into play.
Service Level Indicators (SLIs)
Service Level Indicators (SLIs) are connected to our previous discussion about the expansive understanding of reliability. Remember this diagram?
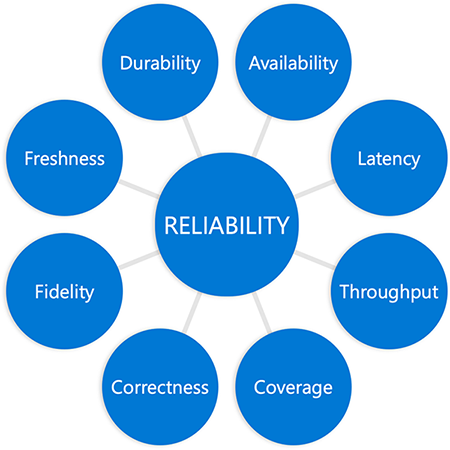
SLIs are our attempt to specify just how we're going to measure our system's reliability. What's the indicator that our service is behaving reliably (doing what we expect)? What can we measure to answer this?
Example: web server availability and latency
Let’s say we're working with a web server and its availability. We might be interested in the number of HTTP requests it received and the number of HTTP requests it successfully responded to. More precisely, we want to understand how successful it's been at being a web server by understanding the ratio of successful requests to total requests.
If we divide the number of total requests by the number of successful requests, we get a ratio. We can multiply this ratio by 100 to get a percentage. For an example using round numbers, if our web server received 100 requests and responded successfully to 80 of them, we'd have a ratio of 0.8. Multiply that by 100, and we can state that it has been 80% available.
Let’s try another one. This time, let’s specify a measurement associated with our web service's latency. We might be interested in knowing the ratio of number of operations that completed in less than 10 milliseconds against the number of total operations. If we do the same math—100 total requests divided by 80 requests that returned faster than our threshold—we again calculate a ratio of 0.8. Multiply by 100, and here too we can say we've been 80% successful around our latency requirements by this measurement.
Just to be clear: this isn't just a website thing. If we had a pipeline service that processed data, we could say we need to measure coverage (for example, how much of the data we processed). Very different system, but the same basic math.
SLIs: where to measure
For SLIs to be useful in concrete discussions using objective data, there's one other piece we need to specify beyond just what we're measuring. When creating an SLI, we need to note not only what we measured, but also where the measurement was taken.
For example, when we specified what we were measuring the availability of the web server mentioned before, we didn't say where we retrieved the success and total HTTP request numbers from. If you try to have a conversation about the reliability of this web server with some colleagues, and you look at the request statistics gathered at a load balancer in front of the server but they look at the statistics from the server itself, this conversation may not go so well. The numbers might be radically different, because the load balancer might see all of the requests coming into the network, but if there's a problem with the network or the load balancer itself, not all of the requests might reach the server. We'd be drawing conclusions based on two different datasets.
The simple way to address this is to be specific about data source in the SLI. For the web server, we'd say "the ratio of successful to total requests as measured at the load balancer" for availability. For the latency, we'd say something like "the ratio of number of operations that completed in less than 10 milliseconds to total operations as measured at the client."
This leads to the logical question: where's the best place to measure SLIs? Unfortunately, there isn't a universally "correct" answer. It’s a decision you must make with an understanding that there are tradeoffs either way. One piece of guidance we can offer harkens back to our previous discussion on reliability: try to measure things in a place that most accurately reflects your customer's experience.
Service Level Objectives (SLOs)
Deciding what to measure (and where) is a great start, but it only gets us halfway towards our goal. Let's say we retrieve the metrics we need for our web server's availability SLI, and we find that it's indeed 80% available.
Is that a good or a bad thing? Is that the "appropriate level of reliability?"
To answer these questions, we're going to need to set an objective for that SLI: a Service Level Objective (SLO). This objective will clearly state our goal for that service.
The basic recipe for creating an SLO consists of these ingredients:
The “thing” you’re going to measure: Number of requests, storage checks, operations; what you’re measuring.
The desired proportion: For example, "successful 50% of the time," "can read 99.9% of the time," "return in 10ms 90% of the time."
The time horizon What's the time period we're going to consider for the objective: the last 10 minutes, during the last quarter, over a rolling 30-day window? SLOs are more often than not specified using a rolling window versus a calendar unit like "a month" to allow us to compare data from different periods.
Putting these components together and including the important where information, a sample SLO might look like this:
90% of HTTP requests as reported by the load balancer succeeded in the last 30-day window.
Similarly, a basic SLO measuring latency might look like this:
90% of HTTP requests as reported by the client returned in <20ms in the last 30-day window.
Start with simple, basic SLOs such as these when you introduce the practice into your organization. You can create more complex SLOs later if needed.
SLIs and SLOs on Azure Monitor
As a final piece to this unit, let's see how we can represent a simple SLI/SLO in Azure Monitor using Log Analytics. To keep things consistent, we'll return to the web-server example.
We learned in the last unit that we can create queries in Log Analytics using the Kusto Query Language (KQL). Here's a KQL query that displays an availability SLI for a web service:
requests
| where timestamp > ago(30d)
| summarize succeed = count (success == true), failed = count (success == false), total = count() by bin(timestamp, 5m)
| extend SLI = succeed * 100.00 / total
| project SLI, timestamp
| render timechart
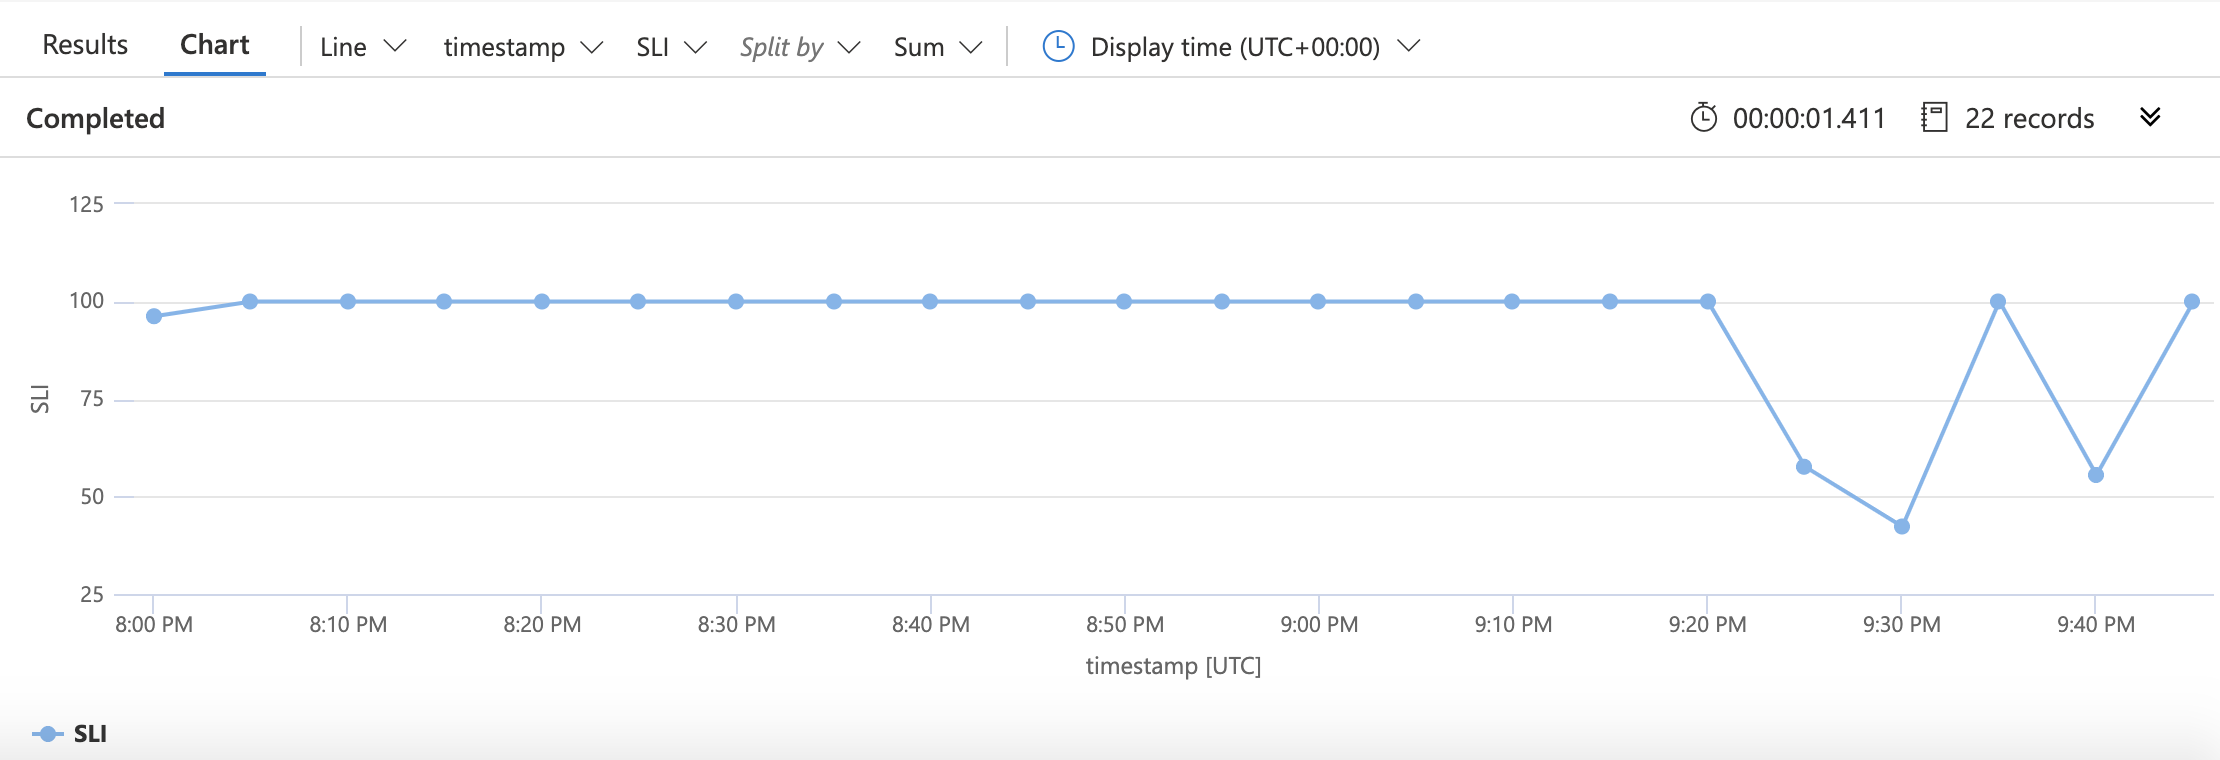
As before, we start with specifying the source of the data: the requests table. We then narrow down the data with which we'll be working to just the last 30 days worth of information. We then collect (in five-minute buckets) the number of successful requests, the number of failed requests, and the total number of requests. The SLI is created using the easy arithmetic we saw before. We tell KQL we'd like to plot that SLI along with timestamps and then create a chart that looks something like this:
Now, let's layer on a simple representation of an SLO:
requests
| where timestamp > ago(5h)
| summarize succeed = count (success == true), failed = count (success == false), total = count() by bin(timestamp, 5m)
| extend SLI = succeed * 100.00 / total
| extend SLO = 80.0
| project SLI, timestamp, SLO
| render timechart
There are two lines changed in this example from the previous one. The first defines the number we'll use for the SLO; the second tells KQL that the SLO should be included in the chart. The result looks like this:
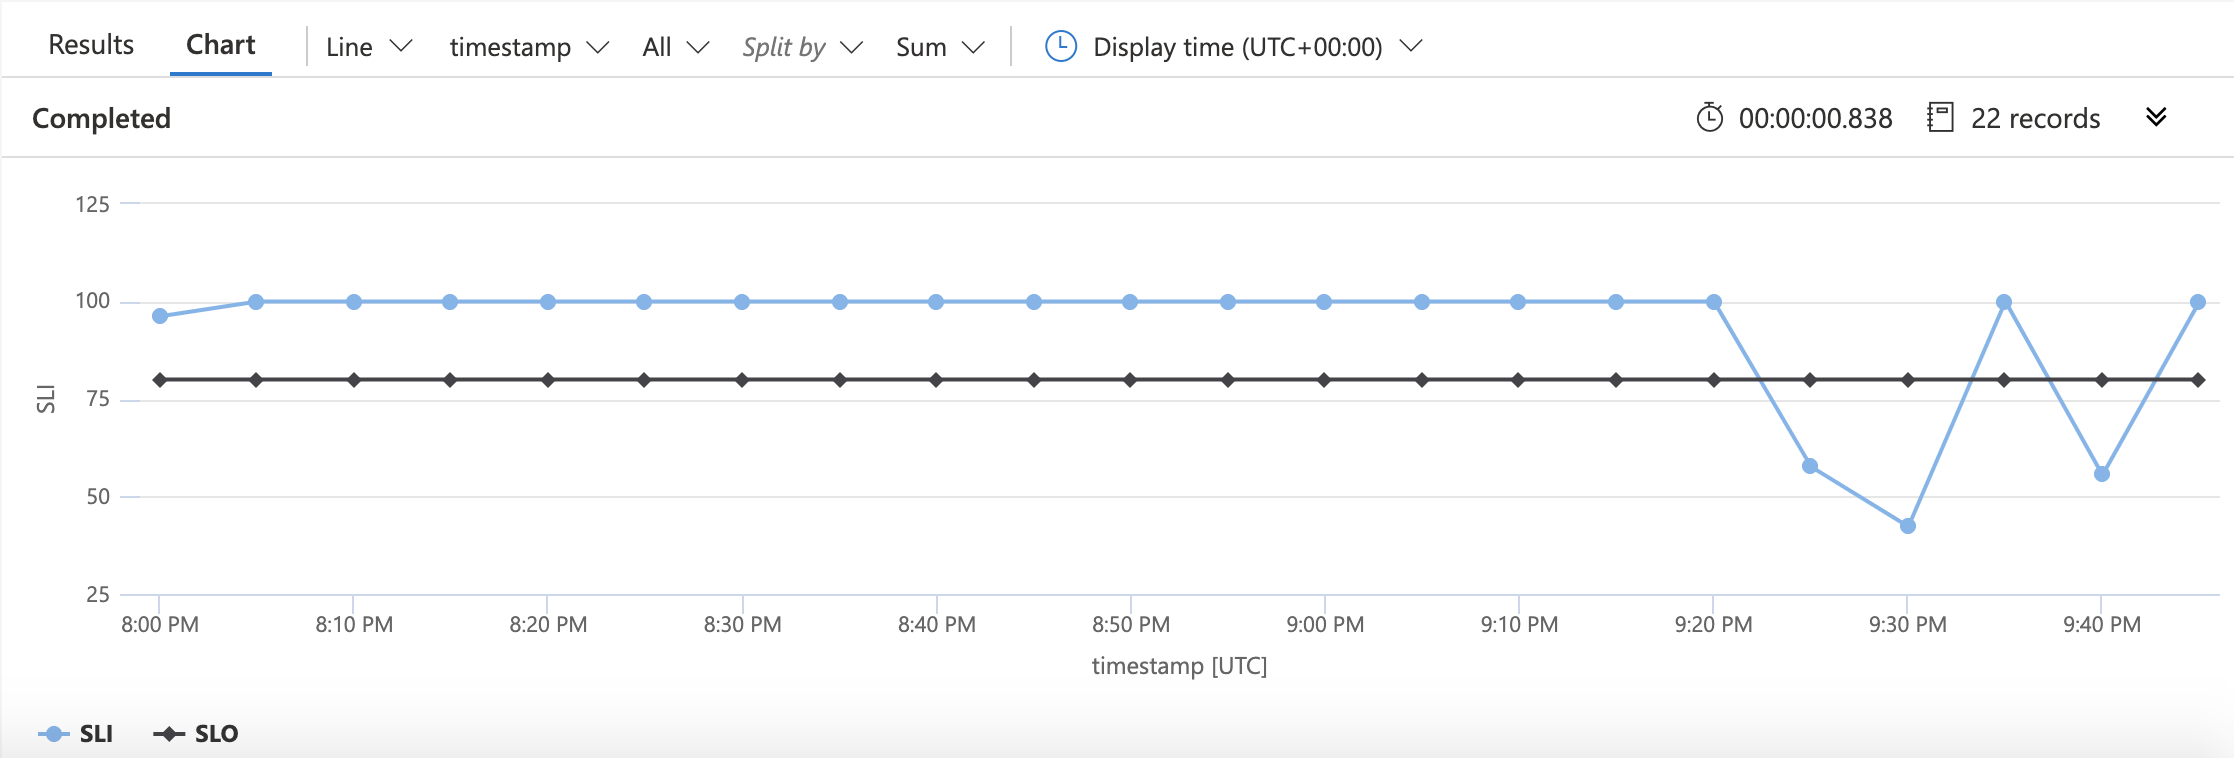
In this chart, it's easy to see the time where we dipped below our availability objective.
Using SLIs/SLOs
Invariably, there's some tuning that will have to take place with your SLIs and SLOs (this is an iterative process, after all). But once that's done, what do you do with the information?
The goods news is you'll probably notice just constructing the SLIs and SLOs will have positive effects on the organization. It requires discussions with stakeholders and other communication that sets things in a good direction. The next round of discussions on what to do with them can also be similarly helpful.
Ultimately, SLIs and SLOs are work-planning tools. They can help you make engineering decisions like "should we work on new features for the service or should we focus on reliability work instead?" They can help with the sort of feedback loops we discussed before.
A secondary but fairly common use for SLIs and SLOs is as part of a more immediate monitoring/response system. In addition to the work-planning aspect (which you should focus on first), many people use them as an operations signal. For example, they might choose to alert their personnel if the service drops below its SLO for a prolonged period of time. That sort of alert leads us to our next unit in this module.