Monitoring and Azure Monitor
This unit gives you an overview of monitoring and Azure Monitor. You learn about Azure Monitor capabilities that are important for the successful operation of your Azure and hybrid resources and applications.
Introduction to monitoring
Your IT environment might contain many resources, services, networks, and other infrastructure. Monitoring tracks the state, health, behavior, and performance of your applications and IT environment. One goal of monitoring is to ensure that your applications and environment are operating optimally, securely, and reliably. Another goal is to detect and help address any issues.
Monitoring includes the following key activities:
- Data collection: Metrics, logs, and log traces to provide insights into the functioning and performance of monitored components.
- Data analysis: Understand current state, predict potential issues, identify patterns, trends, and anomalies.
- Alerts: Trigger when specific conditions are met, such as high CPU usage or low disk space. Helps notify administrators or trigger automated responses.
- Visualizations: Present collected data in user-friendly visual formats to help administrators quickly assess system and resource status.
- Diagnostics and troubleshooting: Help identify the root causes of problems and make informed decisions to address them.
Monitoring provides the following important benefits:
- Performance and cost optimization: Identifies performance bottlenecks and areas for improving resource utilization, efficiency, and costs.
- Proactive management: Lets you take proactive rather than reactive measures to prevent downtime, disruptions, and other problems.
- Reliability: Provides quick identification, troubleshooting, and recovery when problems occur.
- Capacity planning: Helps you analyze historical usage patterns to aid in forecasting, planning, and infrastructure scaling.
- Security monitoring: Detects and responds to security threats, breaches, and suspicious activities to help maintain your system's security posture.
- Compliance and governance monitoring: Can monitor adherence to standards, regulations, and policies.
Overview of Azure Monitor
When you run applications built on various services and resources, a key element of monitoring is the ability to relate your applications' performance and health to the components they're built on. This observability lets you analyze and troubleshoot application issues effectively.
Azure Monitor provides features and tools for collecting, managing, and analyzing IT data from all of your Azure, other cloud, and on-premises resources. The following diagram shows a high-level architectural view of Azure Monitor.

Data collection and storage
As soon as you add resources to an Azure subscription, Azure Monitor starts collecting data about the resources. Azure Monitor provides the following capabilities for collecting, storing, and managing monitoring data:
- Native monitoring of your entire Azure deployment.
- Tools such as data collection agents and APIs for monitoring all layers in your stack. This includes applications and infrastructure, in and outside of Azure.
- Integration with the Azure Event Hubs data streaming service.
- Data transformations during ingestion to let you filter out data you don't need.
- Configurable data retention periods, archiving, and restore options.
- Pricing tier discounts based on data volume.
- A low-cost Basic logs plan for collecting and storing high-volume verbose logs you use for debugging, troubleshooting, and auditing. However, these aren't for analytics and alerts.
Data analysis and response
Azure Monitor offers a broad set of tools and capabilities to help you analyze and gain insights from your monitoring data. Azure Monitor includes the following features to support data analysis and response:
- An easy-to-use portal UI that lets you view, filter, and manipulate monitoring data.
- Kusto Query Language (KQL), a powerful query language that's optimized for ad-hoc queries, data exploration, and near-real time analysis of large volumes of data streamed from multiple sources.
- A range of tools for customizing your analysis, visualizations, alerting, and responses.
- Out-of-the-box recommended alerts.
- Ready-to-use monitoring experiences with advanced, built-in analysis and visualizations of your deployment.
- Autoscale to automatically add and remove resources according to the load on your application.
- Native machine learning and artificial intelligence capabilities that help you detect and respond to anomalies.
Alerts, workbooks, and visualizations
Interactive monitoring is one way to monitor your application. Another option is to configure alerts to send text messages or email to a person or team for further investigation. You can also trigger response actions in certain situations.
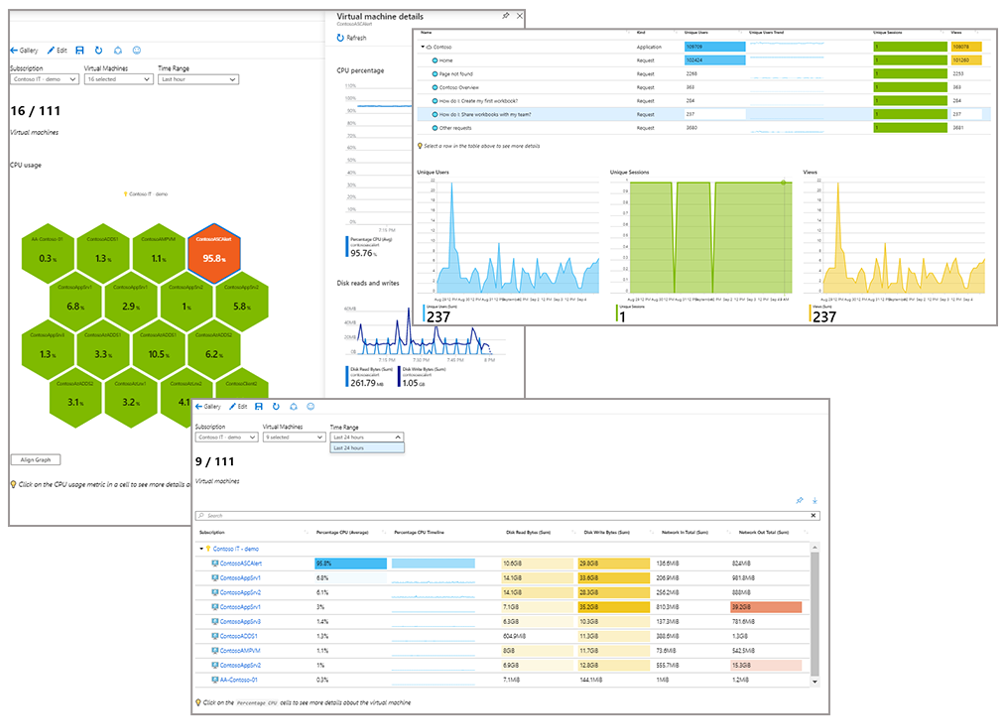
Azure Monitor workbooks provide a flexible canvas for analyzing data and creating rich visual reports in the Azure portal. Workbooks can tap into multiple Azure data sources and combine them into unified interactive experiences. You can use the ready-made workbooks that Azure Monitor provides, or create your own workbooks from predefined templates.
The following image shows three types of workbooks that display logged data in different chart and table formats.
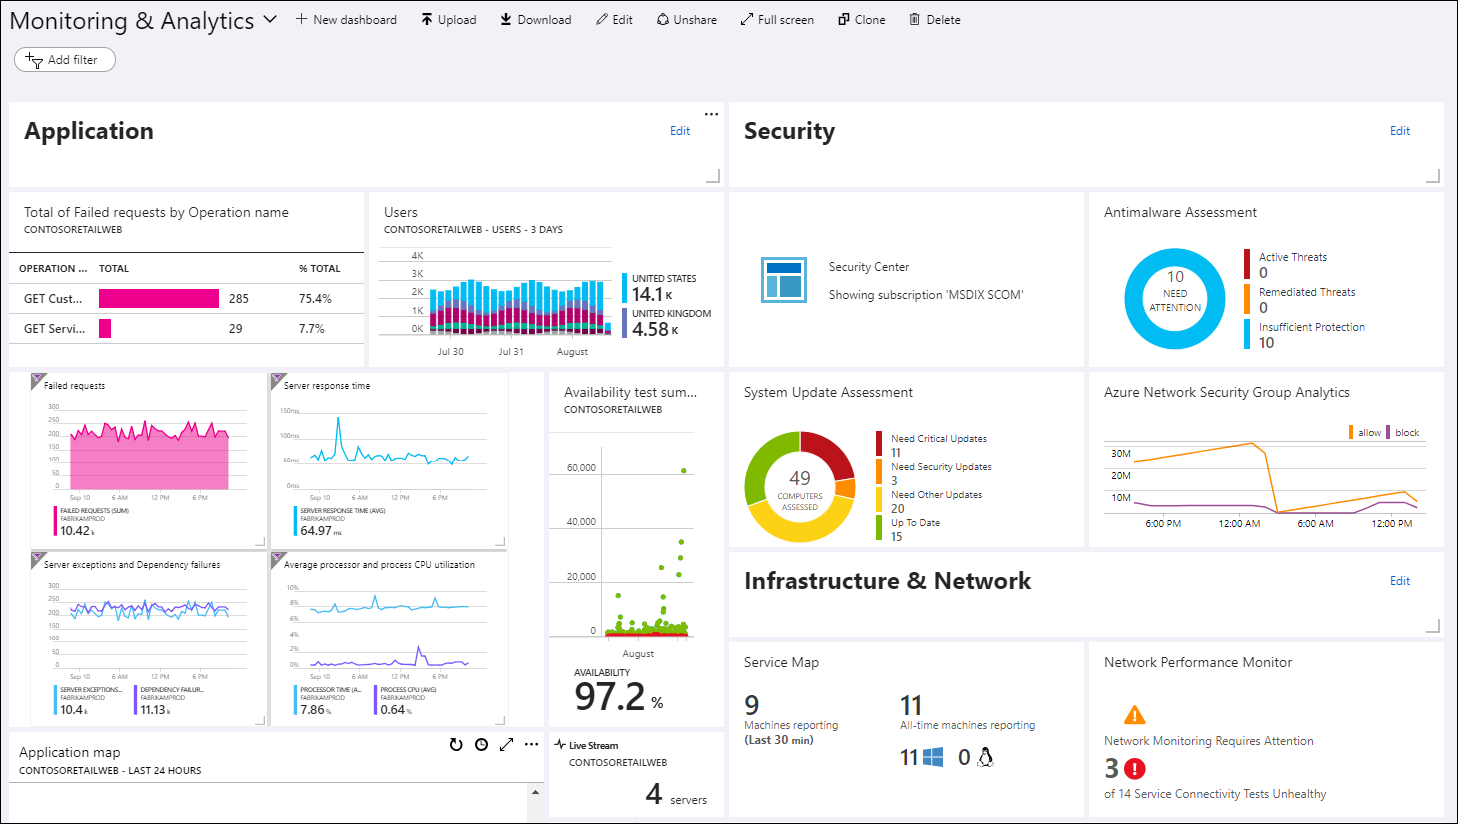
You can add the visualizations you create in Azure Monitor to Azure dashboards, which let you combine different kinds of data into a single pane in the Azure portal.