How Azure Network Watcher works
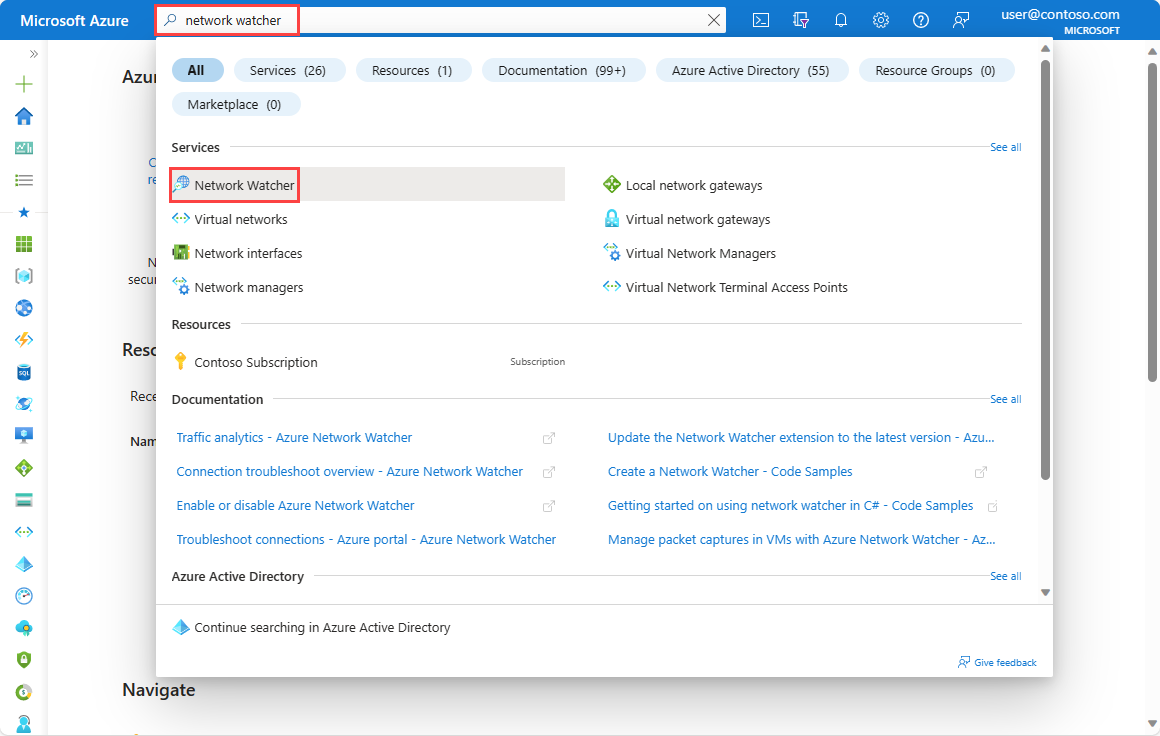
Network Watcher becomes automatically available when you create a virtual network in an Azure region in your subscription. You can access Network Watcher directly in the Azure portal by typing Network Watcher in the Search bar.
Network Watcher Topology tool
The topology capability of Azure Network Watcher allows you to view all of the following resources in a virtual network. Including, the resources associated to resources in a virtual network and the relationships between the resources.
- Subnets
- Network interfaces
- Network security groups
- Load balancer
- Load balancer health probes
- Public IP addresses
- Virtual network peering
- Virtual network gateways
- VPN gateway connections
- Virtual machines
- Virtual Machine Scale Sets
All resources returned in a topology have the following properties:
- Name: The name of the resource.
- Id: The URI of the resource.
- Location: The Azure region the resource is in.
- Associations: A list of associations to the referenced object. Each association has the following properties:
- AssociationType: References the relationship between the child object and the parent. Valid values are
ContainsandAssociated. - Name: The name of the referenced resource.
- ResourceId: The URI of the resource referenced in the association.
- AssociationType: References the relationship between the child object and the parent. Valid values are
Connection Monitor tool
Connection Monitor provides unified, end-to-end connection monitoring in Azure Network Watcher. Connection Monitor supports both hybrid and Azure cloud deployments. You can use the Connection Monitor tool to measure the latency between resources. Connection Monitor can detect changes that affect connectivity, such as network configuration changes or modifications to NSG rules. You can configure Connection Monitor to probe VMs at regular intervals to look for failures or changes. Connection Monitor can diagnose problems and provide explanations about why the issue occurred and the steps that you can take to fix an issue.
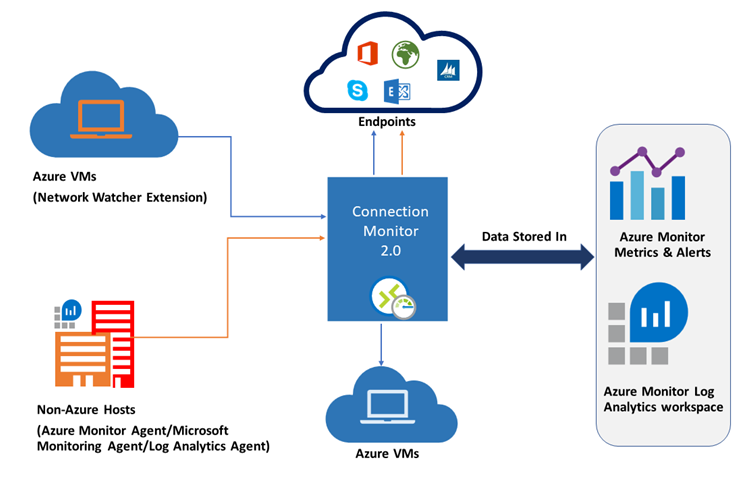
To use Connection Monitor for monitoring, you need to install monitoring agents on the hosts that you monitor. Connection Monitor uses lightweight executable files to run connectivity checks, whether a host is located in an Azure virtual network or in an on-premises network. With Azure VMs, you can install the Network Watcher Agent VM, also known as the Network Watcher extension. For on-premises computers, you can enable this functionality by installing the Log Analytics agent.
IP flow verify
The IP flow verify tool uses a 5-tuple packet parameter-based verification mechanism to detect whether packets that are inbound or outbound are allowed or denied from a VM. Within the tool, you can specify a local and remote port, the protocol (TCP or UDP), the local IP, the remote IP, the VM, and the VM's network adapter.
Next hop
Traffic from an IaaS VM is sent to a destination based on the effective routes associated with a network interface (NIC). Next hop gets the next hop type and IP address of a packet from a specific VM and NIC. Knowing the next hop helps you determine whether traffic is being directed to the intended destination or whether the traffic is being sent nowhere. An improper configuration of routes, in which traffic is directed to an on-premises location or to a virtual appliance, might lead to connectivity issues. Next hop also returns the route table associated with the next hop. If the route is defined as a user-defined route, that route is returned. Otherwise, next hop returns System Route.
Effective security rules
Network security groups (NSGs) filter packets based on their source and destination IP address and port numbers. More than one NSG can apply to an IaaS resource on an Azure virtual network. By taking into account all rules that are applied across all NSGs for a resource, the Effective Security Rules tool allows you to determine why some traffic might be denied or allowed.
Packet capture
Packet capture is a virtual machine extension that is remotely started through Network Watcher. This capability eases the burden of running a packet capture manually on a specific virtual machine by using operating system tools or third-party utilities. Packet capture can be triggered through the portal, PowerShell, the Azure CLI, or REST API. Network Watcher allows you to configure filters for the capture session to ensure you capture traffic you want to monitor. Filters are based on 5-tuple (protocol, local IP address, remote IP address, local port, and remote port) information. The captured data is stored on the local disk or in a storage blob.
Connection troubleshoot
The connection troubleshoot tool checks TCP connectivity between a source and a destination VM. You can specify the destination VM by using an FQDN, a URI, or an IP address. If the connection is successful, information about the communication appears, including:
- The latency in milliseconds.
- The number of probe packets sent.
- The number of hops in the complete route to the destination.
If the connection is unsuccessful, the tool displays details about the fault. You might see the following fault types:
- CPU: The connection failed because of high CPU utilization.
- Memory: The connection failed because of high memory utilization.
- GuestFirewall: A firewall outside of Azure blocked the connection.
- DNSResolution: The destination IP address couldn't be resolved.
- NetworkSecurityRule: An NSG blocked the connection.
- UserDefinedRoute: There's an incorrect user route in a routing table.
VPN troubleshoot
Network Watcher provides the capability to troubleshoot gateways and connections. The capability can be called through the portal, PowerShell, the Azure CLI, or REST API. When called, Network Watcher diagnoses the health of the gateway or connection, and then it returns the appropriate results. The request is a long-running transaction. The preliminary results that are returned give an overall picture of the health of the resource.
The following list describes the values that are returned by calling the VPN troubleshoot API:
- startTime: The time the troubleshooting started.
- endTime: The time the troubleshooting ended.
- code: This value is
UnHealthyif there's a single diagnosis failure. - results: A collection of results returned on the connection or the virtual network gateway.
- id: The fault type.
- summary: A summary of the fault.
- detailed: A detailed description of the fault.
- recommendedActions: A collection of recommended actions to take.
- actionText: Text that describes what action to take.
- actionUri: The URI for documentation that describes what action to take.
- actionUriText: A short description of the action text.