Build a basic dashboard
Now that we introduced you to some of the core concepts in Power BI such as reports, dashboards, and workspaces, let’s see how these different elements would be used to support common business scenario. Managers often want to see how their salespeople are performing. It wouldn't be uncommon for your manager to ask to see your latest sales and profit figures by the end of the day. Many individuals keep those details in an Excel spreadsheet on their computer. Historically, getting that data into a format that a manager can easily consume could take several hours if not days.
With Power BI, we can easily create and share a dashboard with a manager by connecting to a data source such as an Excel spreadsheet on your laptop. While the data sources that you use might be different, the process for building and sharing a dashboard are same.
You need to take the following steps:
Prepare your data: Preparing the data ensures that it's in a format that Power BI can easily consume.
Build a report: The report contains the visuals that you want to include in your dashboard. Depending on the scenario, reports can be built in either Power BI Desktop or using the Power BI Service.
Pin the report visuals to a dashboard: Dashboards are the primary element that users use for viewing data. They can include data from multiple reports as needed.
Share a link to the dashboard: Any users with the link and the necessary permissions are easily able to view and interact with the data.
Prepare the data
The first thing you need to do is ensure that your data is ready to be consumed. Depending on the data source and the volume of data you're working with, you may need to do some data cleansing and transforming using Power Query. If you are connecting to an Excel spreadsheet, make sure the data is in a flat table, and that each column contains the right data type. For example, text, date, number, or currency. It's also important that you have a header row but no columns or rows that display totals. Total operations are handled in Power BI as we create the visuals.
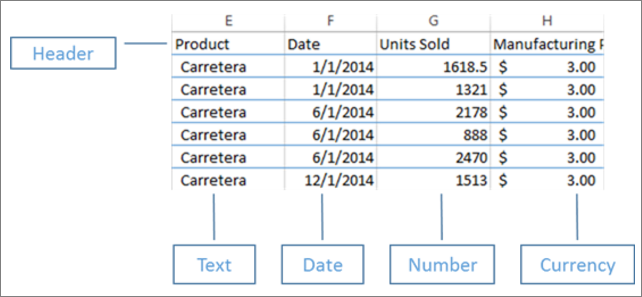
You can see that there's a header column, and each column has the correct data type associated with the data.
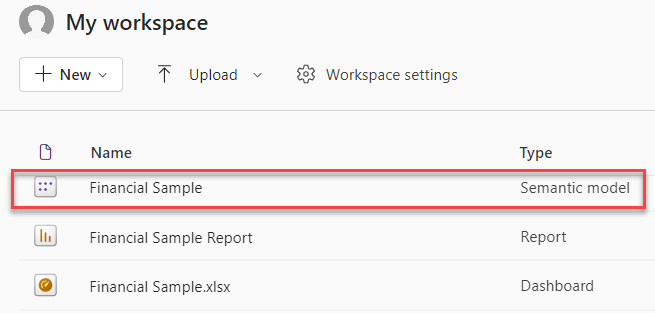
Upload your data to the Power BI service
The Power BI service is where you're able to create reports that connect to your data sources. This includes Excel files that live on your computer. With a few simple clicks, you can attach to a dataset, and Power BI creates a blank dashboard where you're able to place visuals later.
In the image, we attached to sample financial data. It shows the completed Financial Sample dataset, and the blank dashboard.
Build your report
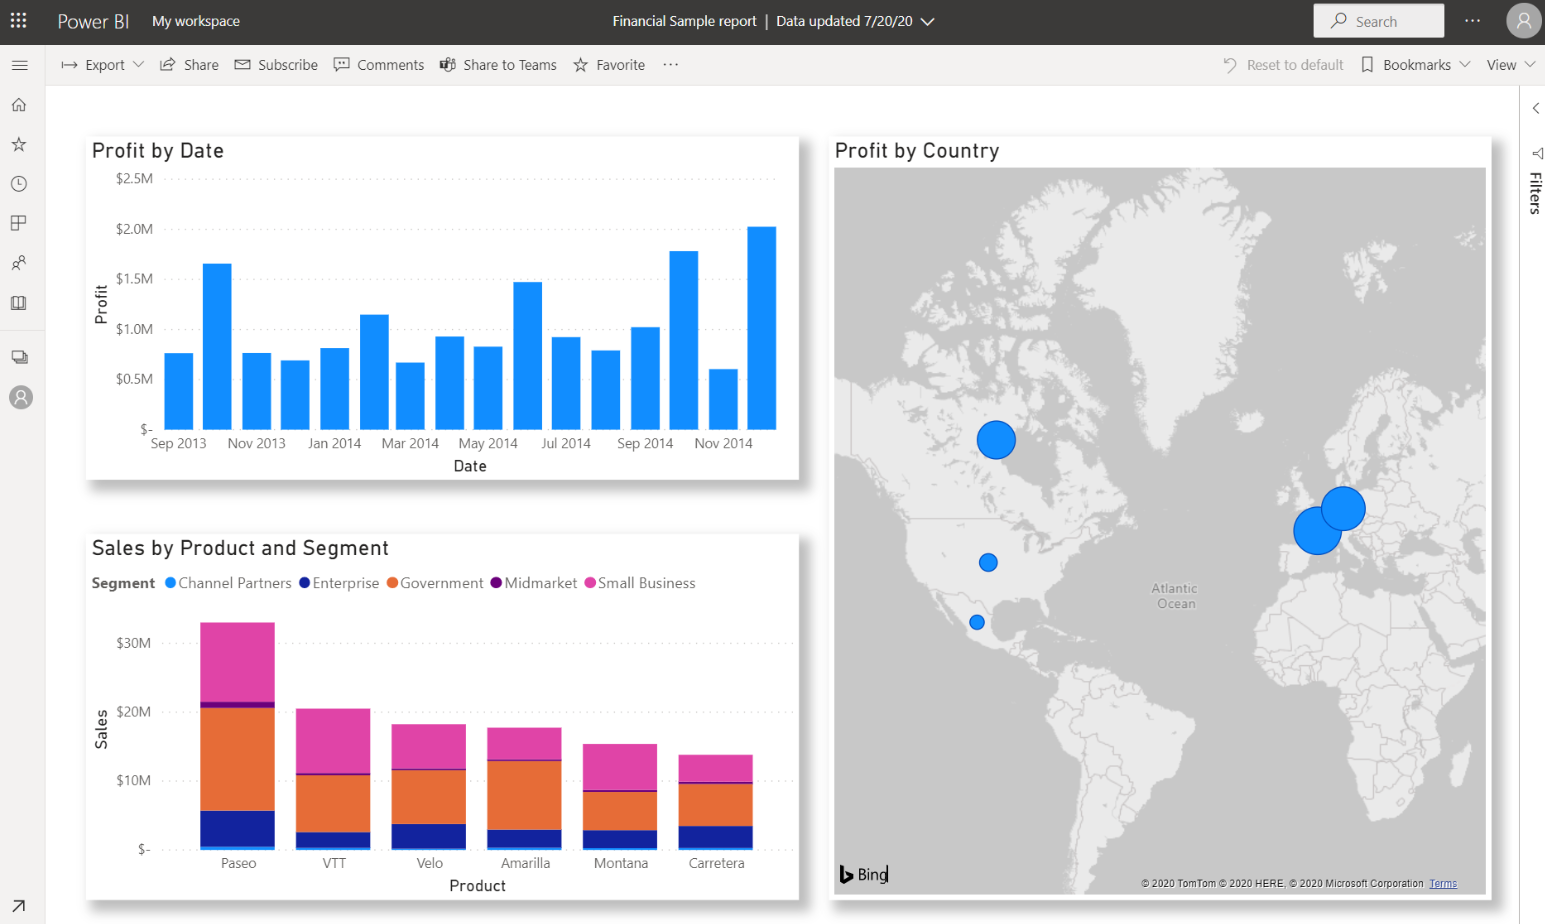
Once you connected to your data, you can either create a new report or edit an existing report that was created previously. Then we can begin editing the report by using the editing view. On the right are the Visualizations, Filters, and Fields panes. Your Excel workbook table data appears in the Fields pane. At the top is the name of the table, financials. Under that, Power BI lists the column headings as individual fields.
Different visualizations are available that you can use to display the data in your report. Different visualizations can be added to the report based on the data that you want to communicate. In the image, multiple bar charts are being used to showcase the number of units being sold. Additionally, map control is included to show sales volumes per country/region.

Each visualization includes a series of filters and controls that can be used to impact how the data is being presented. For example, if you want to change the sum of units sold to display profit by date, you could switch the Y-axis from Sum of Units sold, to Sum of Profit.
More visualizations are being added to Power BI to reflect how business is being done. For example, there's a Power Apps visualization that lets you build a canvas app directly in your Power BI report, which is connected to the Power BI data set. As people interact with the data, the data in the Power App changes. For example, you could create a canvas app that includes actions such as sending emails or scheduling meetings. As you drill down on a Power BI report, you identify customers we haven't talked to in a while. The embedded canvas app lets us initiate actions, such as sending an email, right from the Power BI report.
Pin to a dashboard
After you have all your visualizations on your reports, you can build your dashboard. Dashboards are easy to build because you're just determining which visuals from your created reports you want to include.
In the image, we're taking the Profit by Date visualization and pinning it to a dashboard.
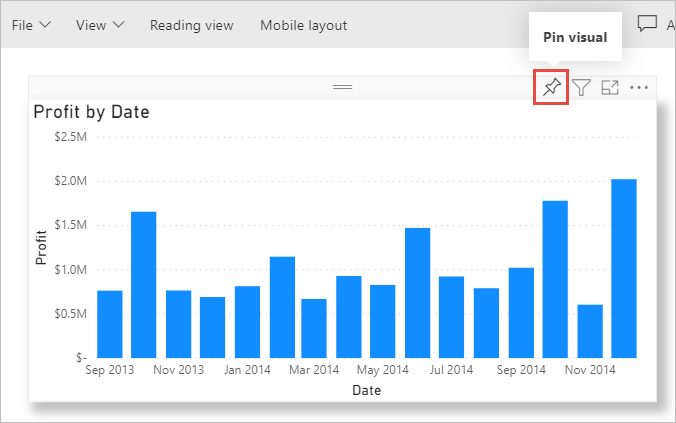
Since dashboards can have visuals from multiple reports, it makes it easy to have detailed dashboards that include data from multiple data sources, even if some of those data sources might be unrelated.
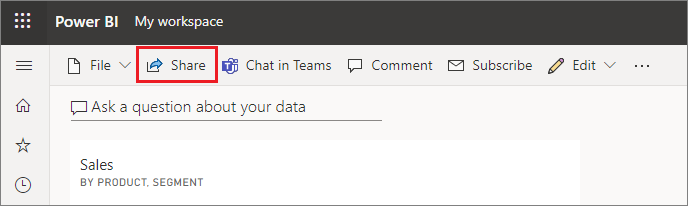
Share a link to your dashboard
Initially dashboards that you create are only visible to the person that created them. However, Power BI makes it simple to share dashboards with other individuals. You can share your dashboard and underlying report with any colleague who has a Power BI account. They can interact with it, but they can't save changes. If you allow it, they can reshare with others or build a new report based on the underlying dataset.
Now that we talked about the process of building a dashboard using Power BI, let’s see the process in action.