Explore how to fix it
The notifications include diagnostic information. Here's an example:
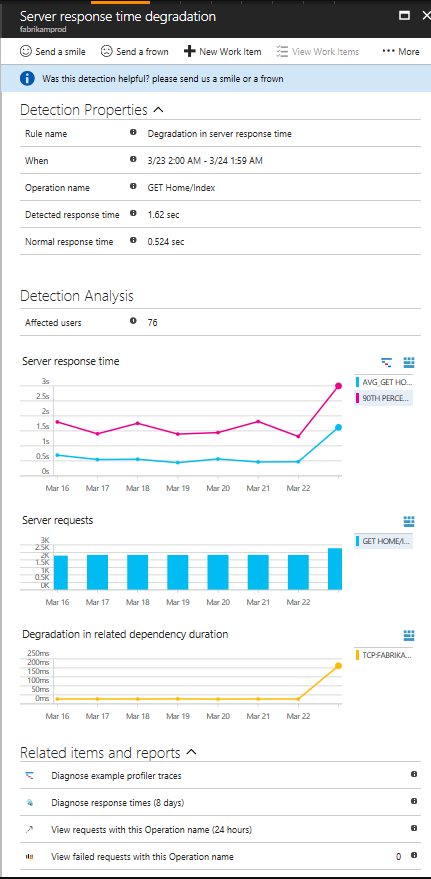
- Triage. The notification shows you how many users or how many operations are affected. It can help you assign a priority to the problem.
- Scope. Is the problem affecting all traffic, or just some pages? Is it restricted to particular browsers or locations? This information can be obtained from the notification.
- Diagnose. Often, the diagnostic information in the notification will suggest the nature of the problem. For example, if response time slows down when the request rate is high, that means your server or dependencies are overloaded. Otherwise, open the Performance blade in Application Insights. There, you'll find Profiler data. If exceptions are thrown, you can also try the snapshot debugger.