Monitor automated tasks
After automating your tasks, it's crucial to monitor them to ensure they're functioning correctly. This helps maximize the performance and availability of your services and proactively identify problems.
Monitor Runbooks
Your runbooks should be modular, with reusable, and easily restartable logic. Monitoring a runbook's progress ensures that its logic is executed correctly if issues arise.
You can use a database, storage account, or shared file to monitor a runbook's progress. Ensure your runbook checks the last action performed before initiating the next action. Based on the results, the logic can either skip or continue specific tasks in the runbook.
You can monitor runbook execution in the Azure portal. Select Job in the Process Automation section of the main blade of your automation account.
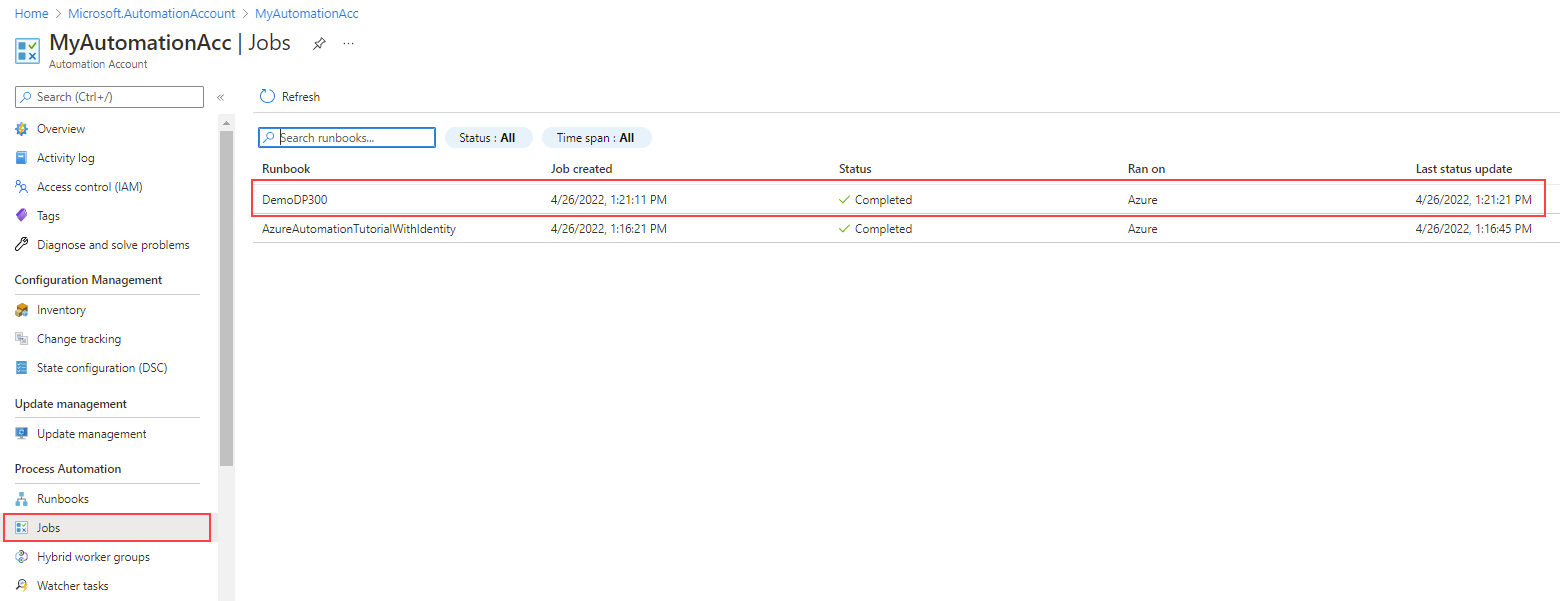
As shown in the following image, the highlighted runbook was completed. To investigate the details and status, select the job.
To learn more about how to troubleshoot runbooks problems, see Troubleshoot runbook issues.
Alerts
You can also create metric alerts to monitor the execution of your runbooks. Alerts allow you to define conditions to monitor and actions to take when those conditions are met.
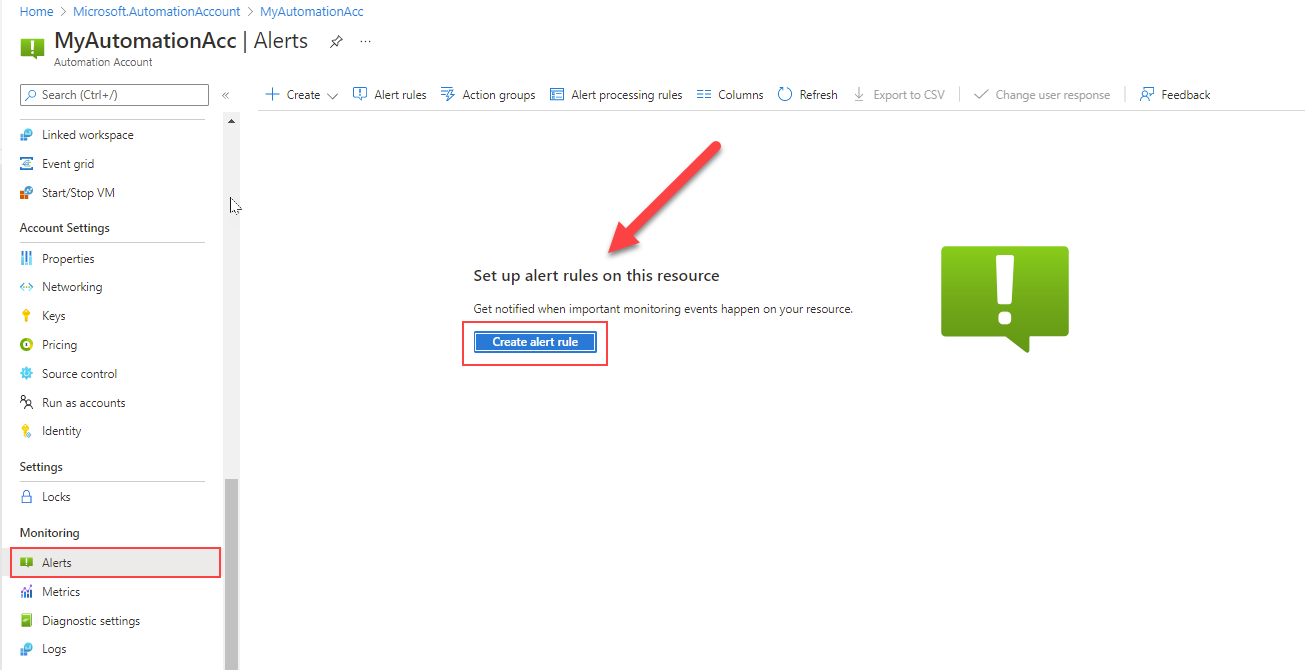
When you select Create alert rule, the Select a signal slide-out opens on the right side of your screen. Next, select a signal that is most appropriate for your scenario. For this example, select Total Jobs.
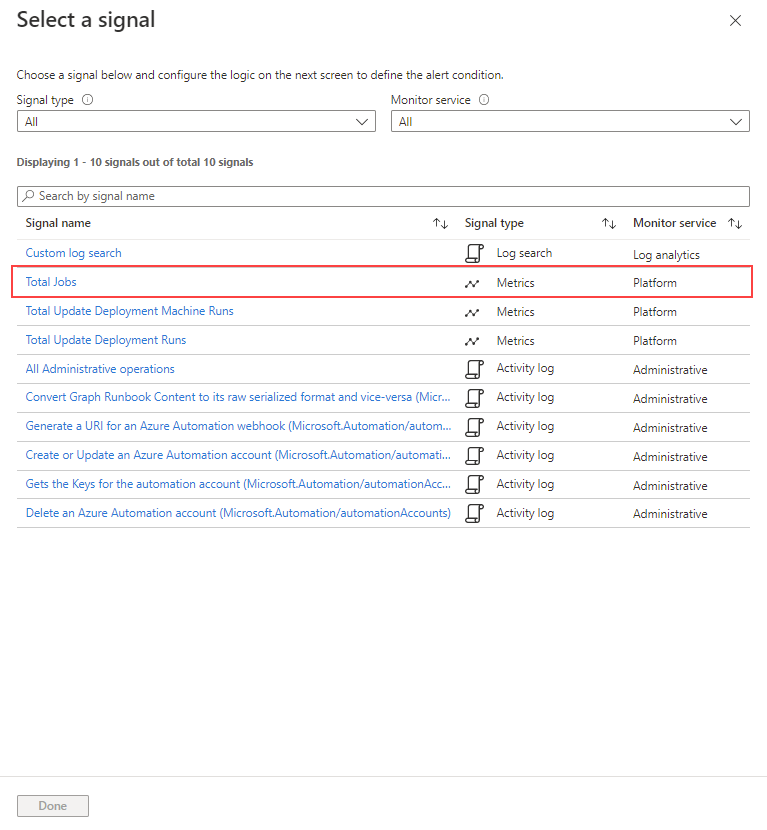
In the Configure signal logic slide-out, select Static for the Threshold property. Then, set the Operator property to Greater than, and the Aggregation type to Total. Enter 10 for the Threshold value.
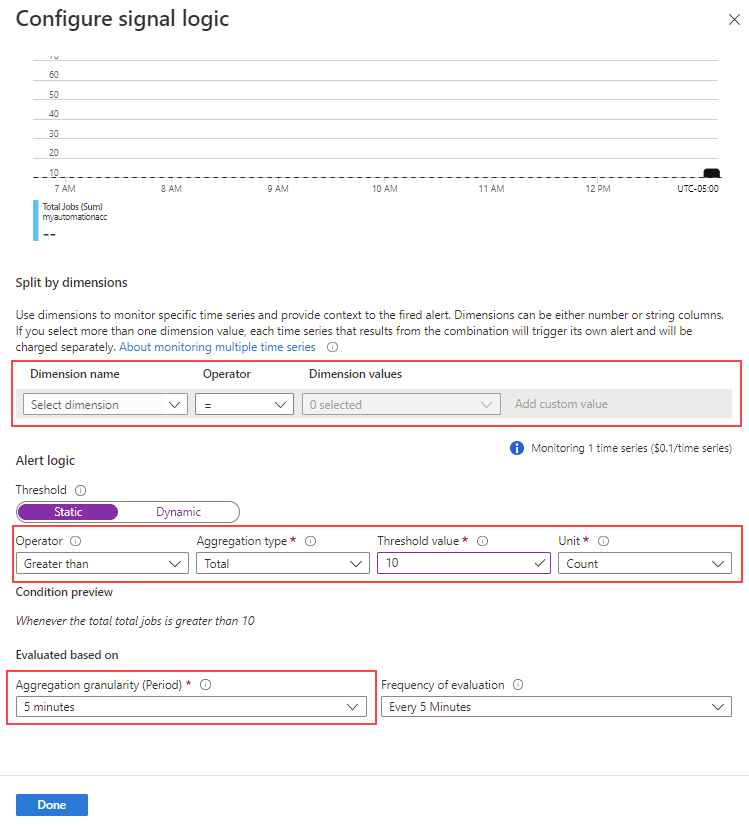
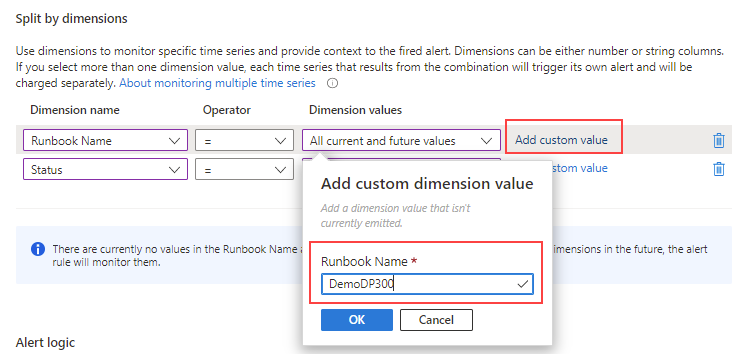
Alternatively, you can specify a dimension. For example, you can define that an alert rule will only trigger for a specific runbook and status. If you don't specify a dimension, no filter is applied.
Next, configure an action group. An action group is a collection of actions that you can use across multiple alerts, including email notifications, runbooks, webhooks, and more.
[NOTE] You can combine Azure Automation with Azure Alerts action groups to initiate an Automation runbook when an alert is raised.
Activity log
In Azure Automation, runbooks are executed and details are collected in an activity log.
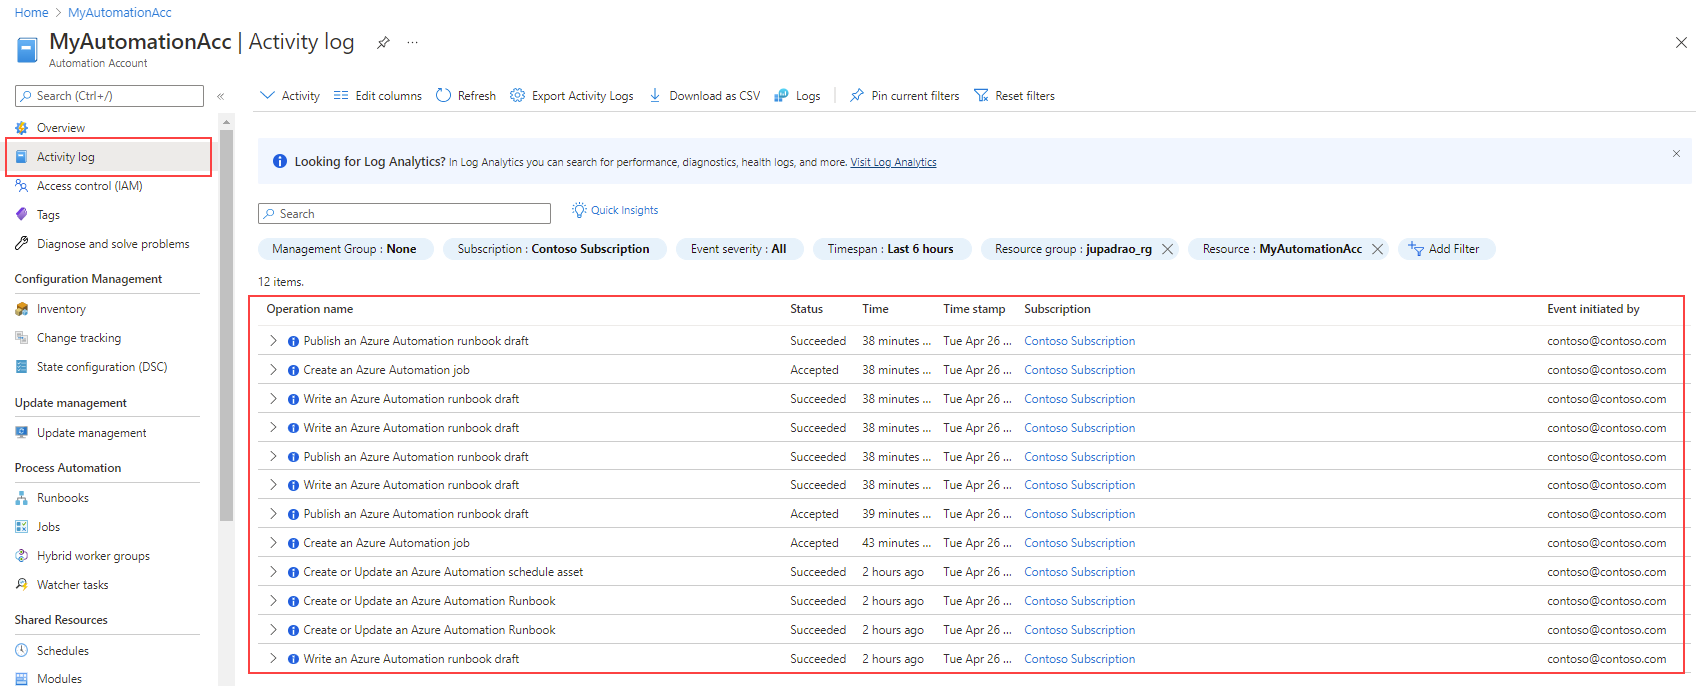
In the following image, you can retrieve runbook details, such as the person or account that started a runbook.
As an alternative, the following PowerShell example provides the last user to run the specified runbook.
$rgName = 'MyResourceGroup'
$accountName = 'MyAutomationAccount'
$runbookName = 'MyRunbook'
$startTime = (Get-Date).AddDays(-1)

$params = @{
    ResourceGroupName = $rgName
    StartTime         = $startTime
}
$JobActivityLogs = (Get-AzLog @params).Where( { $_.Authorization.Action -eq 'Microsoft.Automation/automationAccounts/jobs/write' })

$JobInfo = @{}
foreach ($log in $JobActivityLogs) {
    # Get job resource
    $JobResource = Get-AzResource -ResourceId $log.ResourceId

    if ($null -eq $JobInfo[$log.SubmissionTimestamp] -and $JobResource.Properties.Runbook.Name -eq $runbookName) {
        # Get runbook
        $jobParams = @{
            ResourceGroupName     = $rgName
            AutomationAccountName = $accountName
            Id                    = $JobResource.Properties.JobId
        }
        $Runbook = Get-AzAutomationJob @jobParams | Where-Object RunbookName -EQ $runbookName

        # Add job information to hashtable
        $JobInfo.Add($log.SubmissionTimestamp, @($Runbook.RunbookName, $Log.Caller, $JobResource.Properties.jobId))
    }
}
$JobInfo.GetEnumerator() | Sort-Object Key -Descending | Select-Object -First 1
Log Analytics
Azure Automation can send runbook job status and job streams to your Log Analytics workspace. This method doesn't require workspace linking and is independent.
Azure Monitor logs integrated with Automation account, enables you to:
- View the status of your Automation jobs
- Write advanced queries across your job workflow
- Trigger an email or alert based on your runbook job status
- Correlate data from multiple Automation jobs
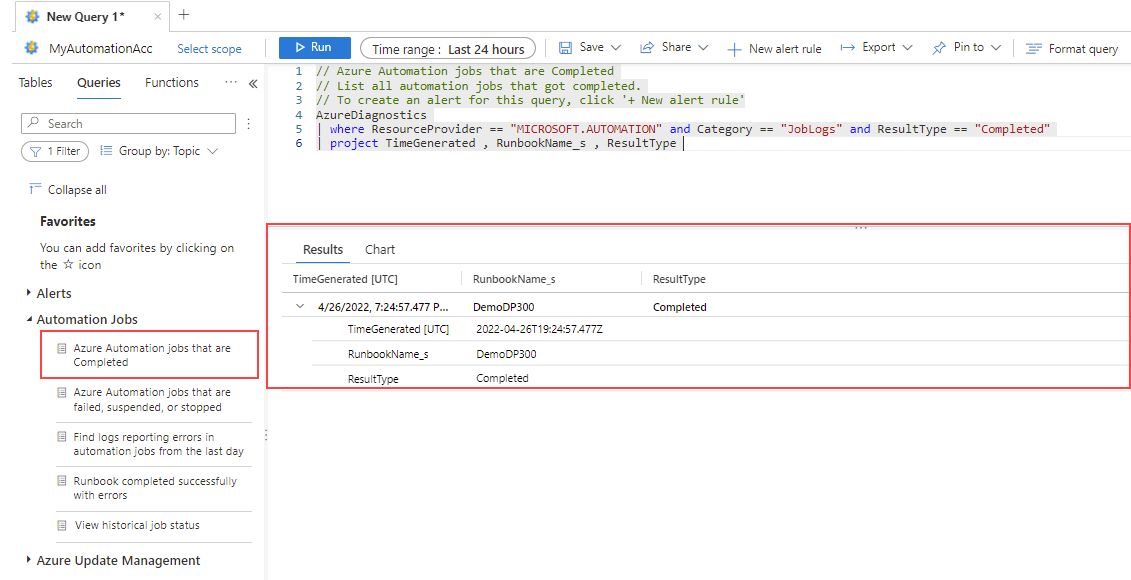
To run queries, select Logs from the Monitoring section of your automation account main blade.
The Azure portal provides a few query templates so you can get started. As we can see below, we used an existing Kusto query template to list all completed jobs in the automation account.
The ability to forward Azure Automation diagnostic logs to a Log Analytics workspace is an important feature that helps you monitor the health of your runbooks.
Note
Before you start using Log Analytics to query Automation jobs data, you must configure Diagnostic settings for your Automation Account.
Monitor elastic jobs
With elastic jobs, job executions are logged, and any failures are automatically retried. The automatic retry feature provides services more resilient to transient failures.
You can monitor elastic jobs execution through Azure portal, PowerShell, and T-SQL.
Azure portal
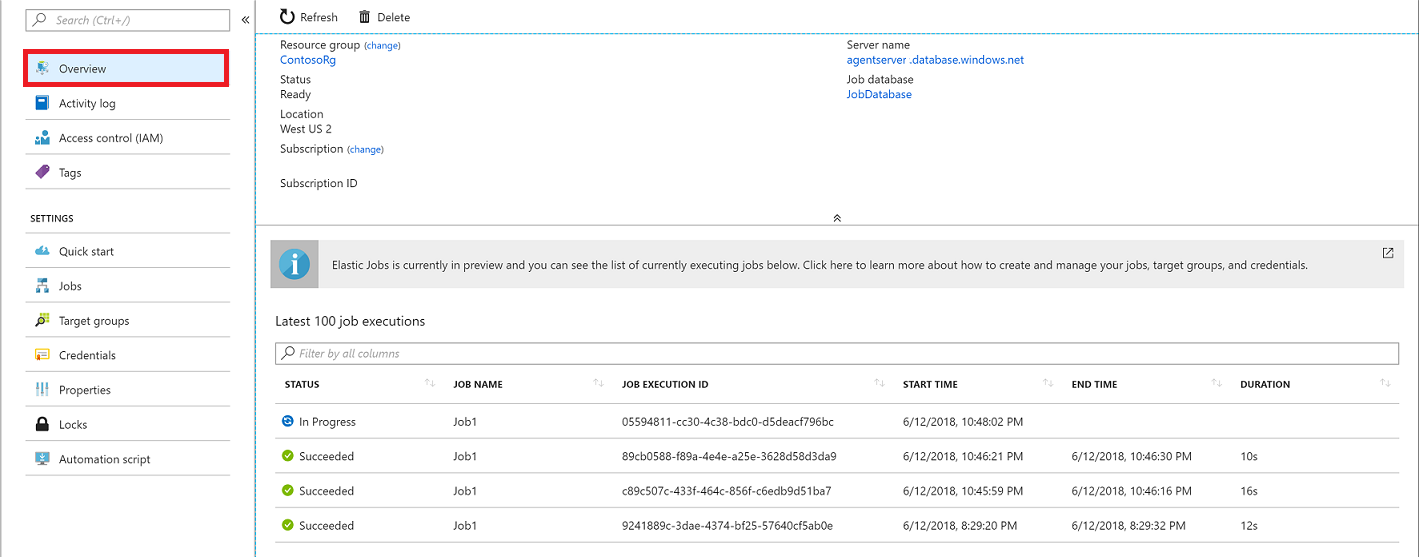
To view the history of jobs execution, select Overview for your Elastic Job agent main blade.
PowerShell
The following code snippets get job execution details.
# get the latest 5 executions run
$jobAgent | Get-AzSqlElasticJobExecution -Count 5

# get the job step execution details
$jobExecution | Get-AzSqlElasticJobStepExecution

# get the job target execution details
$jobExecution | Get-AzSqlElasticJobTargetExecution -Count 2
T-SQL
The following example shows how to view execution status details for all jobs. Create a job agent and connect to the job database, then run the following command:
--View all execution status for all jobs
SELECT *
FROM jobs.job_executions
ORDER BY start_time DESC;

--View all execution statuses for job named 'MyJob'
SELECT * FROM jobs.job_executions
WHERE job_name = 'MyJob'
ORDER BY start_time DESC;

-- View all active executions
SELECT *
FROM jobs.job_executions
WHERE is_active = 1
ORDER BY start_time DESC;