Query logs
Azure resources produce Azure Diagnostic Logs, which provide detailed operational data of those resources. Diagnostic settings are used to collect those resource logs.
While some logs like activity and platform metrics are collected automatically, diagnostic settings must be created to collect resource logs. These logs can be forwarded outside of Azure Monitor. Enabling diagnostic settings in Azure Cosmos DB accounts can be forwarded to Log Analytics workspaces, Event hubs, and Storage Accounts.
Forwarding data to Log Analytics workspaces, writes the logs into tables that can be queried using the Kusto Query Language (KQL). So, to use the diagnostic data stored in these tables, knowledge on reading and writing Kusto queries is essential. These tables can be a generic legacy table called Azure Diagnostics, or the recommended Resource-specific tables.
Create Azure Cosmos DB diagnostic settings
There are multiple ways to create the diagnostic settings, the Azure portal, via REST API, PowerShell or via Azure CLI.
To create the diagnostic settings using the Azure portal, navigate to the Azure Cosmos DB account, and under the Monitoring section, choose Diagnostic settings. Either edit an existing diagnostic setting or choose + Add diagnostic setting and choose the logs you wish to collect and the destinations to forward these logs to.
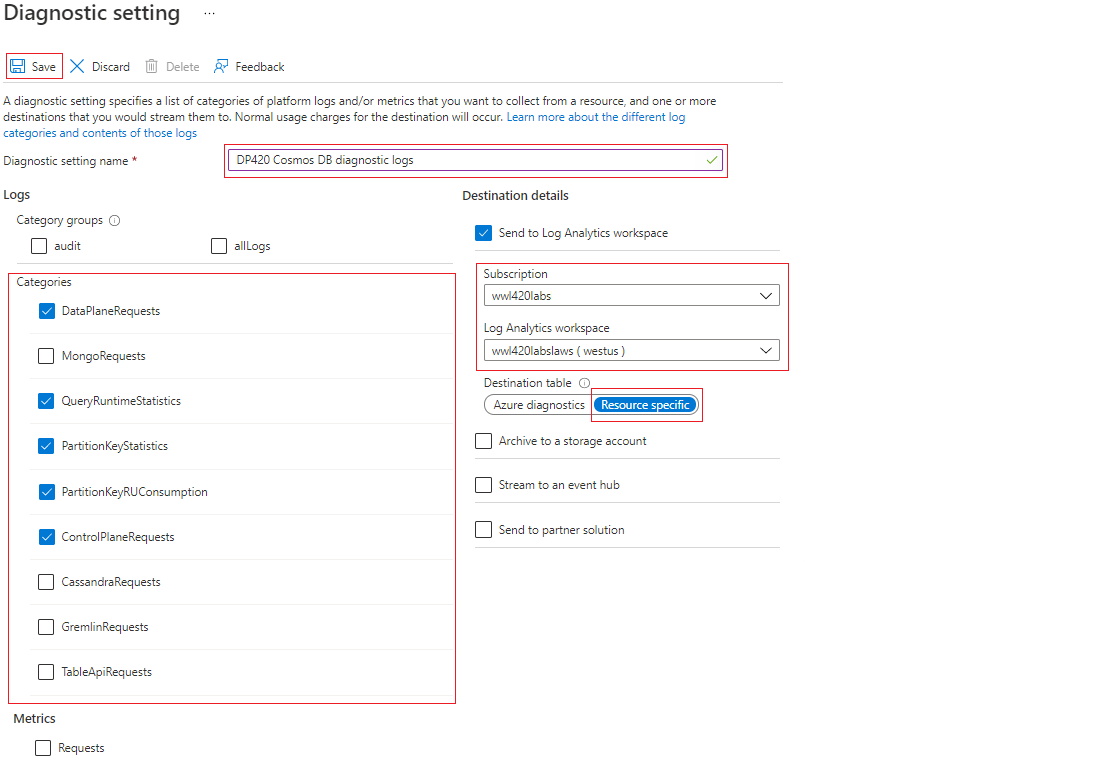
The NoSQL API log tables are:
DataPlaneRequests- This table logs back-end requests for operations that execute create, update, delete, or retrieve data.QueryRuntimeStatistics- This table logs query operations against the NoSQL API account.PartitionKeyStatistics- This table logs logical partition key statistics in estimated KB. It's helpful when troubleshooting skew storage.PartitionKeyRUConsumption- This table logs every second aggregated RU/s consumption of partition keys. It's helpful when troubleshooting hot partitions.ControlPlaneRequests- This table logs Azure Cosmos DB account control data, for example adding or removing regions in the replication settings.
Troubleshoot issues with diagnostics queries
When Azure Cosmos DB diagnostics data is sent to Log Analytics, it's sent to either the AzureDiagnostics table or to Resource-specific tables. The preferred mode is to send the data to Resource-specific tables, as such, each log chosen under the diagnostic settings options will have its own table. Choosing this mode makes it easier to work with the diagnostic data, easier to discover the schemas used, and improve performance in latency and query times.
AzureDiagnostics queries
If the legacy mode is chosen, the diagnostics data will be stored in the AzureDiagnostics table, so all kusto queries will be executed against that table. Since multiple Azure resources could also be populating this table, include the filter ResourceProvider=="MICROSOFT.DOCUMENTDB" in your where clause to only return Azure Cosmos DB entries. Additionally, to differentiate between the different logs you picked under diagnostic settings, add a filter on the Category column. For example, to return documents for the QueryRuntimeStatistics log, include the where clause | where ResourceProvider=="MICROSOFT.DOCUMENTDB" and Category=="QueryRuntimeStatistics". Kusto is case-sensitive so make sure your column names are the right case. Let's review a couple of Kusto query examples using the AzureDiagnostics table.
- Query that returns the count and the total request charged of the different Azure Cosmos DB operation types in the last hour.
AzureDiagnostics
| where TimeGenerated >= ago(1h)
| where ResourceProvider=="MICROSOFT.DOCUMENTDB" and Category=="DataPlaneRequests"
| summarize OperationCount = count(), TotalRequestCharged=sum(todouble(requestCharge_s)) by OperationName
| order by TotalRequestCharged desc
- Create a query that returns a timechart graph for all successful (status 200) and rate limited (status 429) requests in the last hour. The requests will be aggregated every 10 minutes.
AzureDiagnostics
| where TimeGenerated >= ago(1h)
| where ResourceProvider=="MICROSOFT.DOCUMENTDB" and Category=="DataPlaneRequests"
| summarize requestcount=count() by statusCode_s, bin(TimeGenerated, 10m)
| render timechart
Resource-specific Queries
Unlike the AzureDiagnostic queries, the resource-specific queries will be run against the different tables that were created for each log category chosen in the diagnostic setting dialog. To use these tables, prefix the table names in the list above with the string CDB. Let's review a couple of examples.
- Query that returns the count and the total request charged of the different Azure Cosmos DB operation types in the last hour.
CDBDataPlaneRequests
| where TimeGenerated >= ago(1h)
| summarize OperationCount = count(), TotalRequestCharged=sum(todouble(RequestCharge)) by OperationName
| order by TotalRequestCharged desc
- Create a query that returns a timechart graph for all successful (status 200) and rate limited (status 429) request in the last hour.
CDBDataPlaneRequests
| where TimeGenerated >= ago(2h)
| summarize requestcount=count() by StatusCode, bin(TimeGenerated, 10m)
| render timechart